The level of pollution in the River Thames has long been a problem, even in 2026, decades of under investment in sewage treatment has resulted in effluent being dumped in the river. Hopefully something the Tideway Tunnel will help resolve.
The state of the river in the 19th century was far worse than it is today. The rapid rise of London’s population and industry resulted in large quantities of effluent being dumped, untreated in the river.
Similar to the Tideway Tunnel, Joseph Bazalgette’s sewer system and pumping works of the 1860s and 1870s acted as an interceptor, catching sewage before it was dumped in the river, and routing it to new treatment works.
Before construction of this new system, the condition of the river was an open sewer, and what was worse, the river was used as a source of water by the water companies that supplied the city. Even the companies that relied on other sources were frequently drawing on heavily polluted water.
In April 1850, Arthur Hill Hassall published “A Microscopic Examination of the Water Supplied to the Inhabitants of London and the Suburban Districts”, where he reported on an investigation into the sources of water used by the London water companies, and examined the condition of their water supplies using a microscope to see what material the water contained.
Arthur Hill Hassell was the son of a Doctor and was born in Teddington in 1817. He was a student in Dublin and apprenticed to his uncle, Sir James Murray, a Dublin physician, and whilst in Dublin he published his first work “A Catalogue of Irish Zoophytes”, where he used a microscope to examine microscopic organisms, which at the time were believed to be somewhere between plants and animals.
After graduating, he returned to London and setup in general practice in Notting Hill, but he continued to be fascinated in what could be revealed by the microscope, and his next publications were “A History of British Freshwater Algae” (1845), and “The Microscopic Anatomy of the Human Body” (1849).
His 1850 publication would reveal the horrendous state of the water supplied to the residents of London.
In his description of the method used, he states that he collected a wine bottle full of water from the output of the different water companies, the river, and the sewer system, and examined samples of this water under a microscope.
Arthur Hill Hassall:
Licence: Public Domain Mark, Credit: Arthur Hill Hassall. Photograph. Wellcome Collection. Source: Wellcome Collection.
In 1850, there were a number of privately owned water companies that supplied different areas of London. These were, along with the main source of their water as listed in Hassall’s book:
- New River Company (source – springs around Ware in Hertfordshire and the River Lea)
- East London Company (source – the River Lea near Old Ford, Stratford, below Lea Bridge)
- Hampstead Company (source – several large ponds near to Hampstead Heath)
- Kent Company (source – the River Ravensbourne)
- Lambeth Company (source – the River Thames at Lambeth)
- Vauxhall Company (source – the River Thames at Vauxhall)
- Southwark Company (source – the River Thames, also at Vauxhall)
- Chelsea Company (source – the River Thames, near Battersea)
- West Middlesex Company (source – the River Thames at Barnes)
- Grand Junction Company (source – the River Thames at Brentford)
In his examination of the water under the microscope, he was looking for organic and inorganic matter, including specific organic material that he described as “complex in organisation, endowed with life, and in many cases possessed of active powers of locomotion”.
Using the scientific understanding and terminology of the time, he described this type of organic material as:
- Infusoria – animal productions, and include a great variety of singularly organized atoms, most of which are invisible to the common eye
- Entomostraca – constitute a well defined division of Crustacea, or the Crab tribe and are remarkable for having their bodies enclosed in shell-like cases
- Conferveae – vegetable productions of very simple organisation, consisting of cells or utricles, placed end to end and joined together, forming, by their union, threads often of extreme fineness
- Desmideae – also vegetable productions, exhibiting however, some affinities to animals, so that, for a long time, it was a matter of doubt and dispute to which of the kings of the organic world they really belonged.
- Diatomaceae – unite in their organization the characters of both plants and animals, insomuch that it is still uncertain which they really are. They are readily distinguished from all other organisms by their colour, which is brown, and by the fact that they are furnished with skeletons of Silex, or flint; it is this which renders them so durable – indeed, almost indestructible.
These are rather dry descriptions of what could be found in samples of water, so in a perfect example of a picture is worth a thousand words, Hassall included colour illustrations of what he saw whilst looking through the microscope at the samples of water collected in a wine bottle from across London.
Firstly, the Thames at Brentford and at Hungerford (near where the railway bridge is located today between the South Bank and Charing Cross):
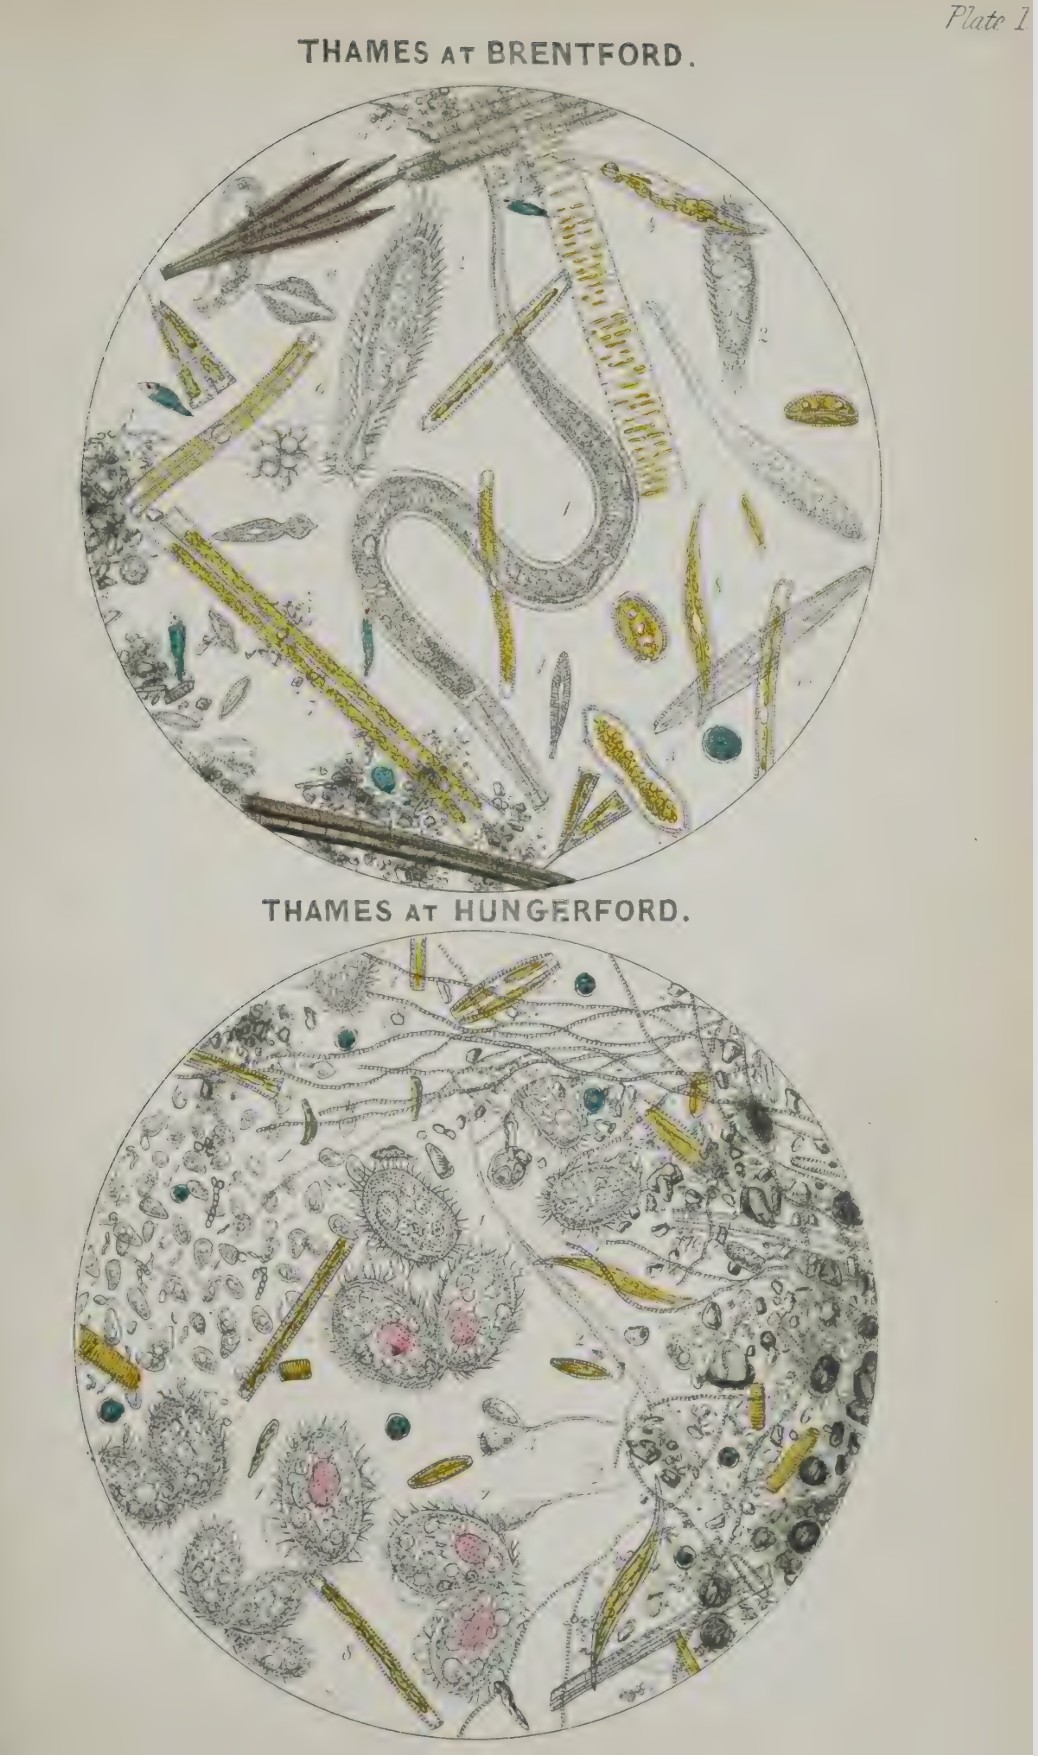
Comparing these two illustrations shows that whilst the Thames at Brentford was bad enough, in central London there was a dense collection of both organic and inorganic matter.
Hassell adds little notes to show how he collected the water, and for Hungerford he added that the water was collected “two hours after the steam-boats ceased to ply”. Presumably, then as now, powered boats on the river churn up the sediment and prevent it from settling, and Hassall wanted to collect his samples in as near a natural state as possible.
As well as the view through the microscope, he added that the water from Hungerford presented a dirty and opaque appearance, and also contained dead organic matter, very considerable, both animal and vegetable, ochreous substance; down of wheat.
Hassall was surprised by the amount of living matter that he found in the water at Brentford, and he conducted further tests along the river, and came to the conclusion that “these have brought to light the singular and important fact, that Thames water, from Brentford in one direction, to Woolwich in the opposite, warms with living productions”, and that they are met with the greatest abundance near to central London and in the neighbourhood of the bridges.
He also added the following description of what a walker alongside the Thames in the mid 19th century would see:
“In one spot he will notice the carcases of dead animals, rotting, festering, swarming with flies and maggots, and from which a pestilential odour proceeds, contaminating the air around; in another he will see a variety of refuse borne along by the lazy current of the stream – decaying vegetables, the leaves and stalks of cabbages, grass from a recently mown lawn, excrement; in another he will remark on the commotion of the water, occasioned by the bubbling up of some noxious gas; and still further on, he will perceive some sewer; discharging its corrupt and filthy contents into the bed of the river, and causing the water around to assume an inky blackness.
Should the tide be out, the observer should now abandon the towing path, take a boat, and row to some of the shallower parts of the stream, If here he plunges his hand into the water, he will bring up a dirty and slimy mass. Entire acres (I might say without exaggeration) of a substance similar to the above may frequently noticed on the recession of the tide.”
To show what was being put into the Thames, he included a picture and description of sewer water, which contained large amounts of both organic and inorganic matter, much dead and decomposing matter, a black carbonaceous matter on which the inky colour of many sewer waters depend, and large quantities of sulphated hydrogen.
All this was being pumped into the river, frequently not that far from where a water company was drawing water to supply the residents and industries of the city.
Drawings of the view through the microscope of sewer water, and the first of the water companies examined- the Grand Junction Company:
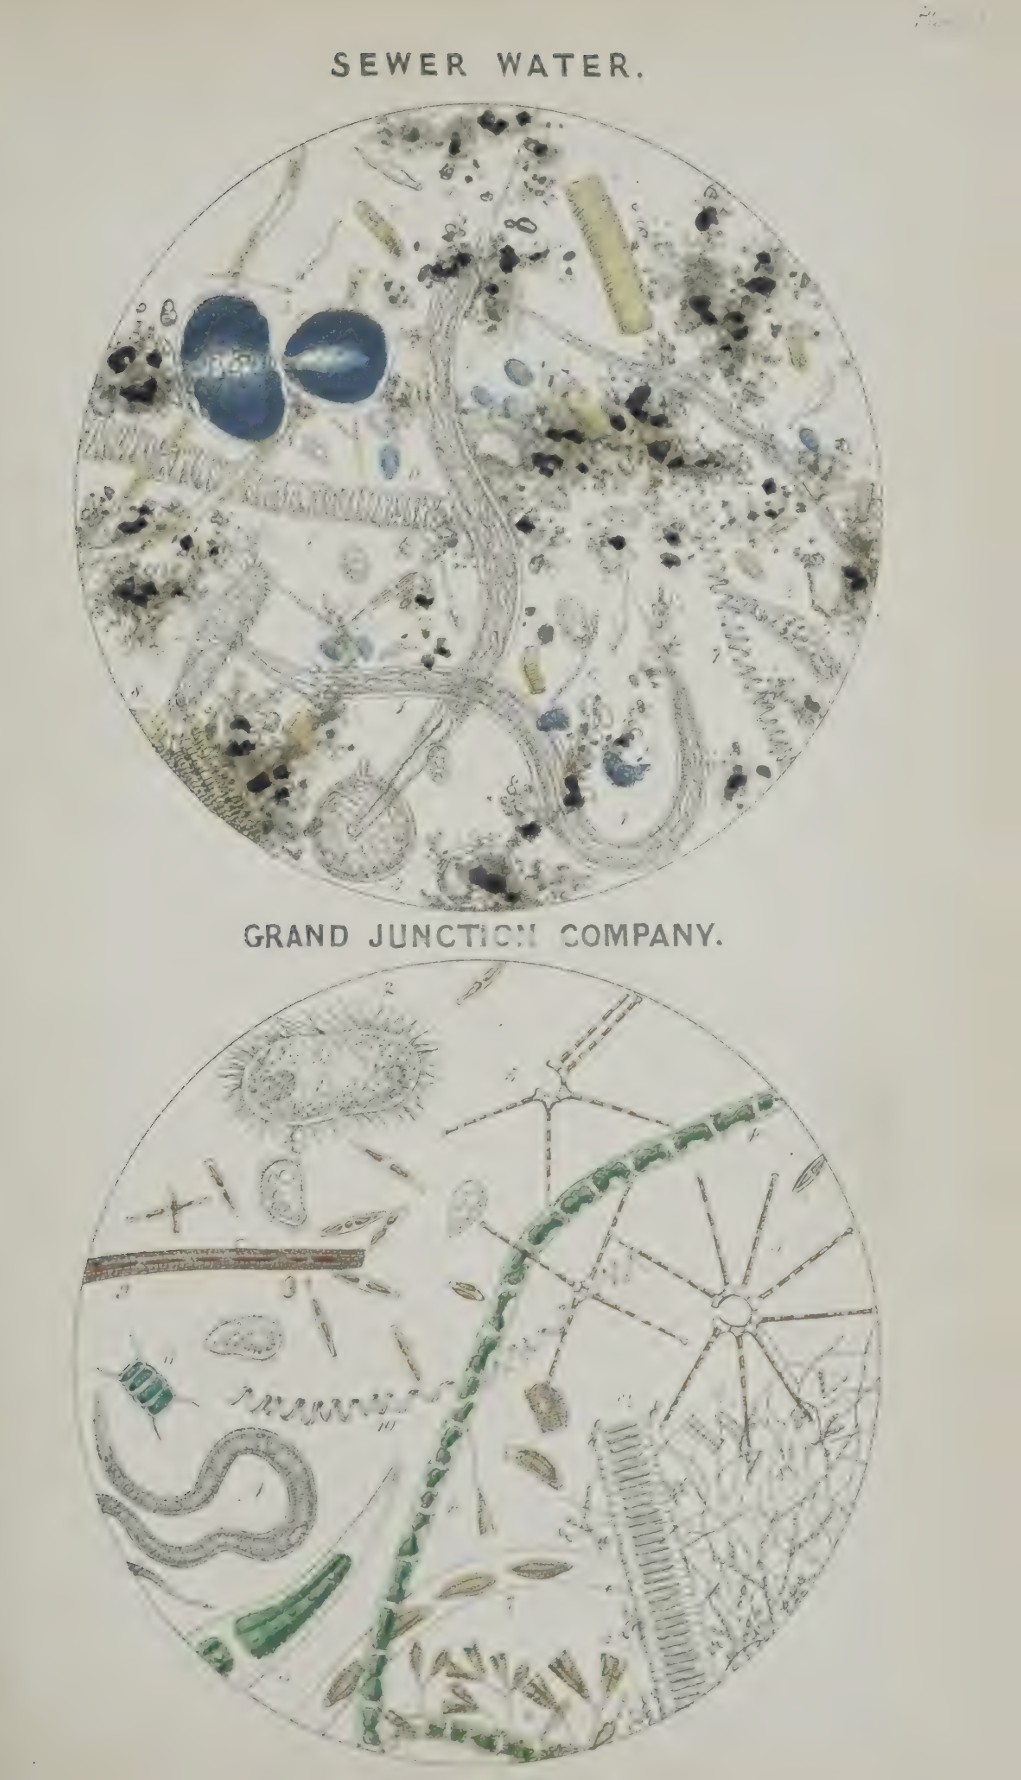
The Grand Junction Company took their water from the Thames at Brentford, at a place which Hassall described as being “within reach of the sewage of that large and dirty town”.
Next came the West Middlesex Company, which took water from the Thames at Barnes, along with a sample of Cistern water:
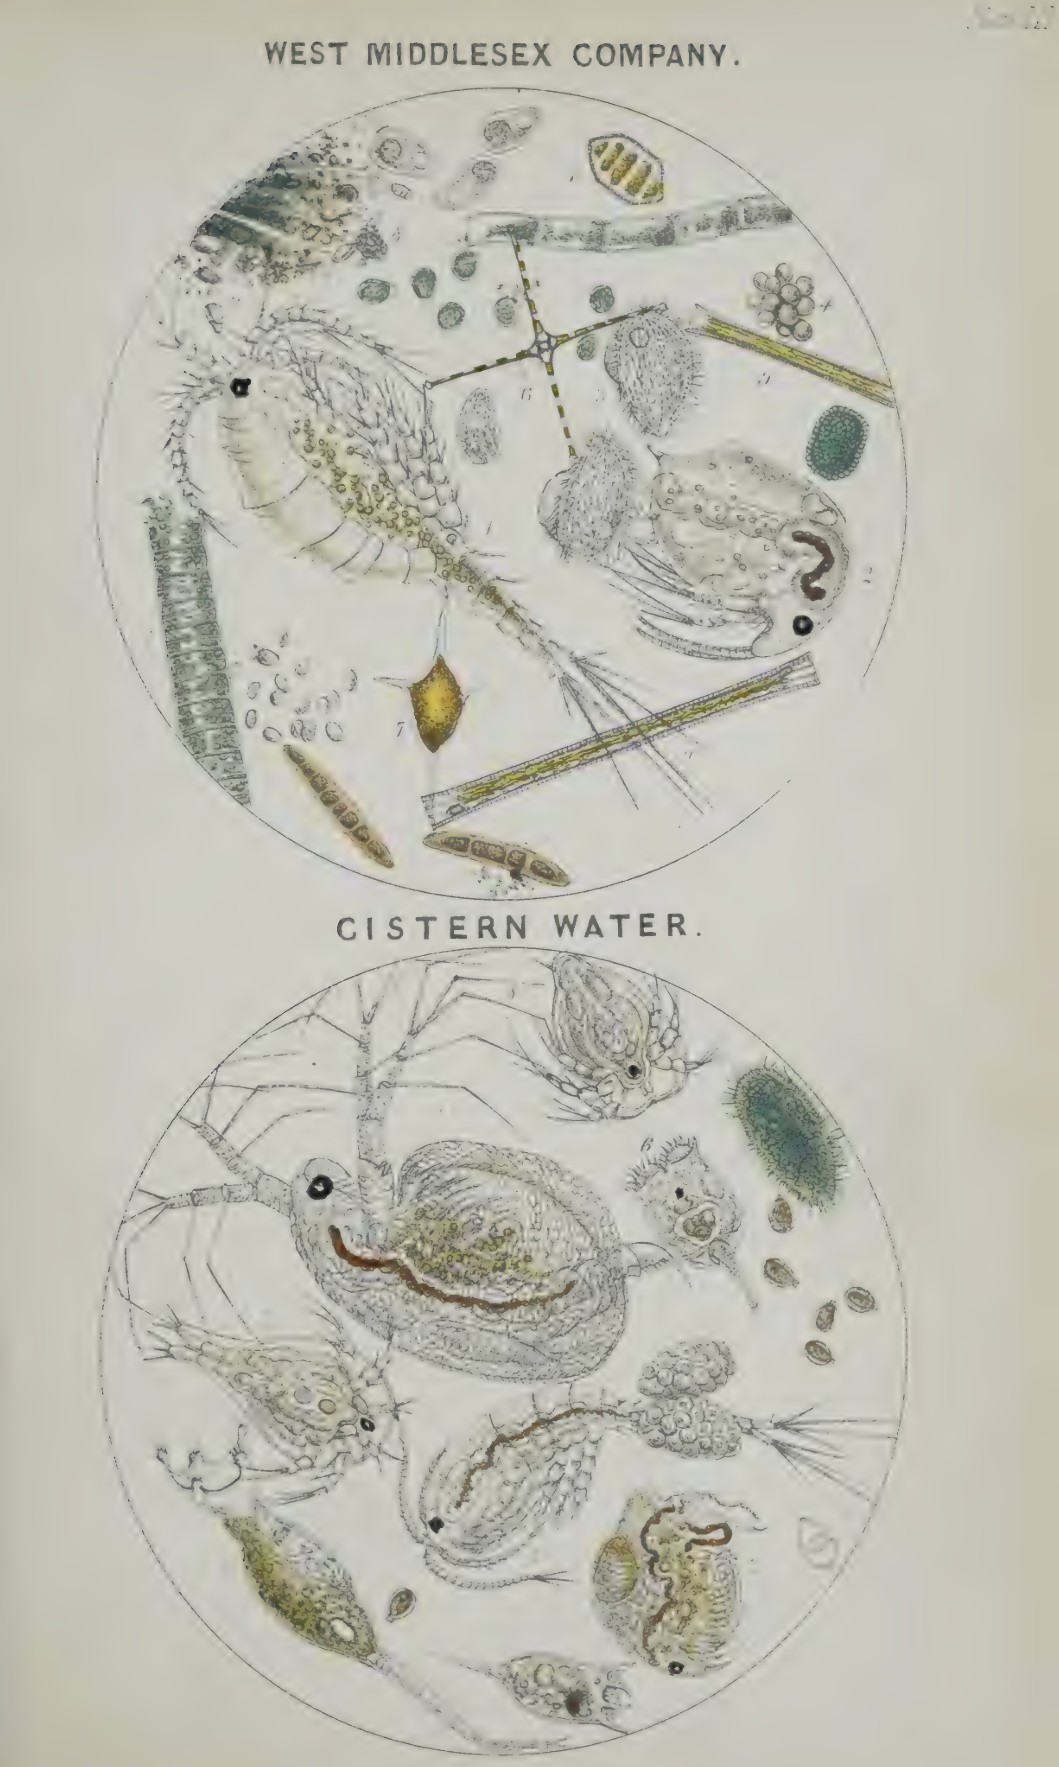
The lower image shows Cistern Water, and the text explains that this was water from a cistern supplied by the Hampstead Water Company.
Cisterns were tanks where water was temporarily stored as part of the overall distribution system, between the source / reservoir, and the end user.
Hassall found numerous problems with the quality of the water in cisterns across London, and he had the follow general comment about cistern water “It may be observed, in general. that these waters contain the same forms of organic life as those encountered in the waters of several companies, with this important difference, however, that their numbers, for equal quantities of fluid, are usually much greater in the former than in the later”.
He goes on to explain that the samples he took from cisterns contained much greater quantities of living organisms, than the source water, for example:
- The Chelsea Company is remarkable for its bunches of Ova cases
- That of the Lambeth Company for its immense numbers of Bursaria and Paramecia
- That of the Vauxhall Company for its hirsute worms or Annelida
Hassall makes the observation that the amount of life found in cisterns was dependent on the time of year (more growth when the weather was mild or warm) and also on whether the cisterns were frequently cleaned.
The Chelsea Company, who took their water from the Thames, near Battersea, and the Southwark Company, who took their water from the Thames near Vauxhall:

The water of the Southwark Company was described as being in the “worst condition in which it is conceivable any water to be, as regards its animalcular contents, in a worse state even than Thames water itself, as taken from the bed of the river”. Quite some achievement for the Southwark company to have their water described as being worse than the river water.
In the mid 19th century, the Southwark and Vauxhall Water Companies had combined. Most of the water companies had moved their supply sources to beyond the expanding city of London, looking for sources which did not have the same level of contamination as the Thames, along with methods of purification such as increased use of, and more complex design, of filtration beds, however the Southwark and Vauxhall Company still had their works in Battersea, as shown in the following map from 1894 (‘Reproduced with the permission of the National Library of Scotland“):
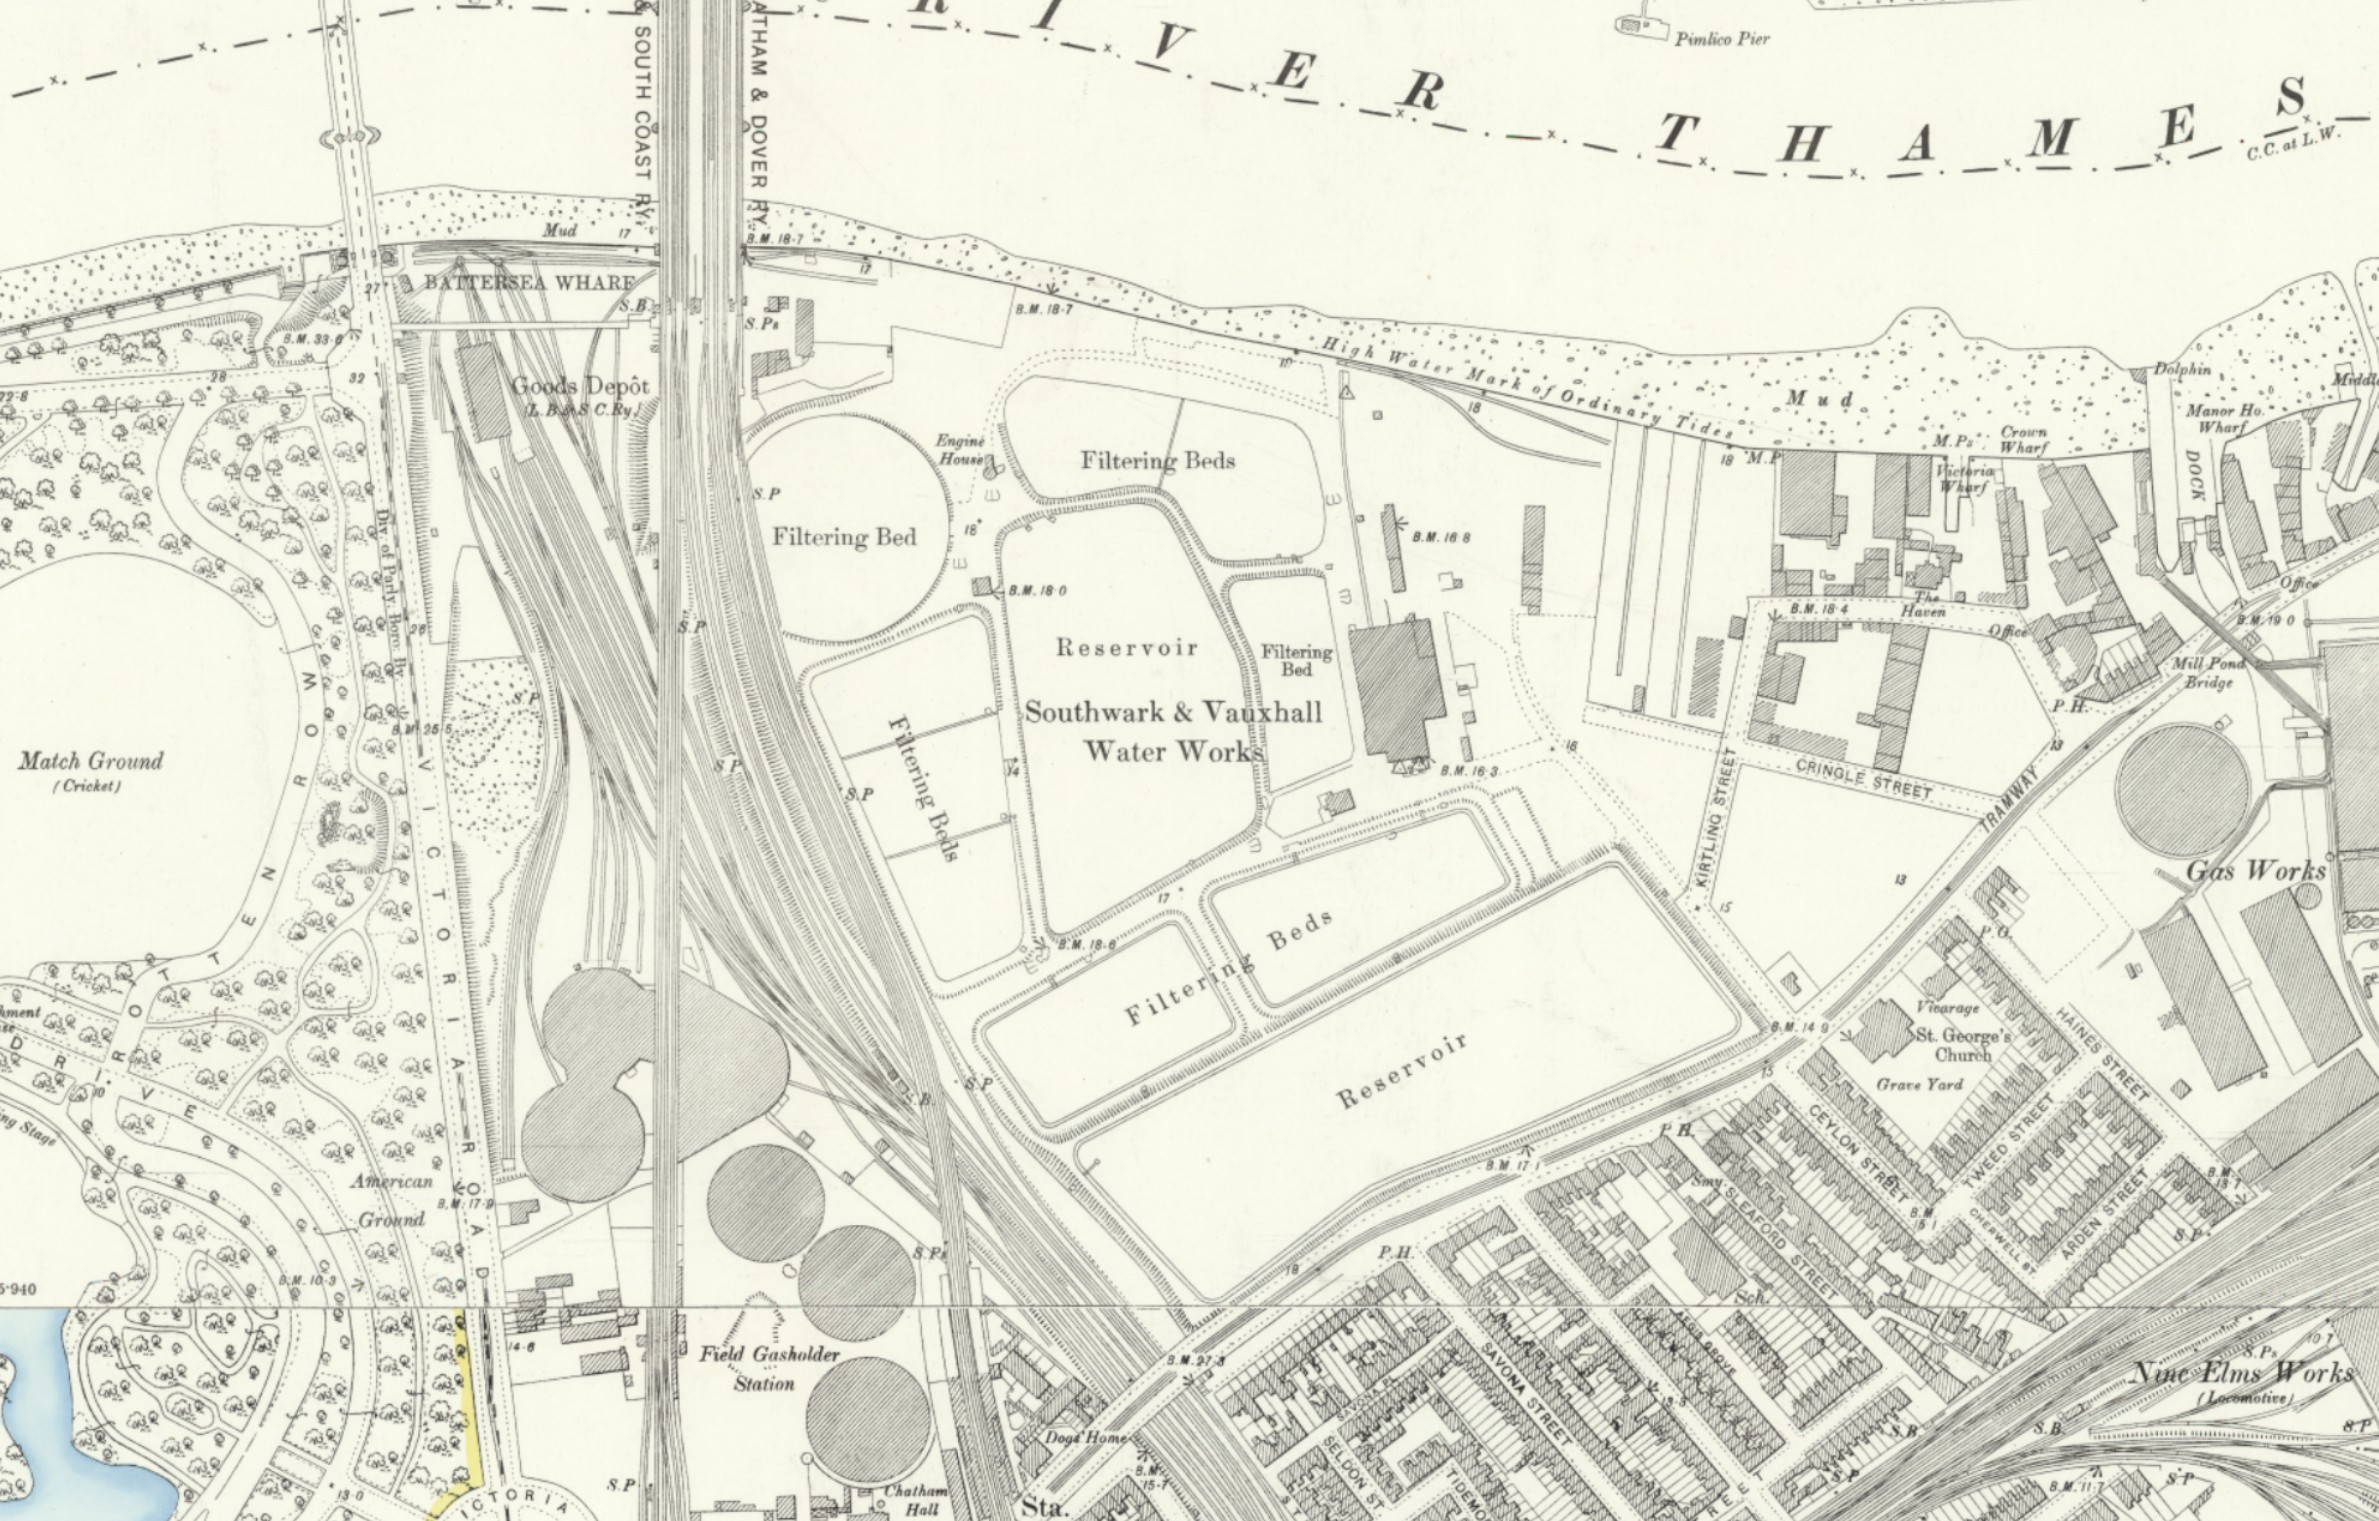
The site of the Southwark & Vauxhall Water Works would later become the site of Battersea Power Station, and if you walk through the power station building today, you are walking over the space once occupied by the central reservoir.
The Lambeth and New River Company’s water:
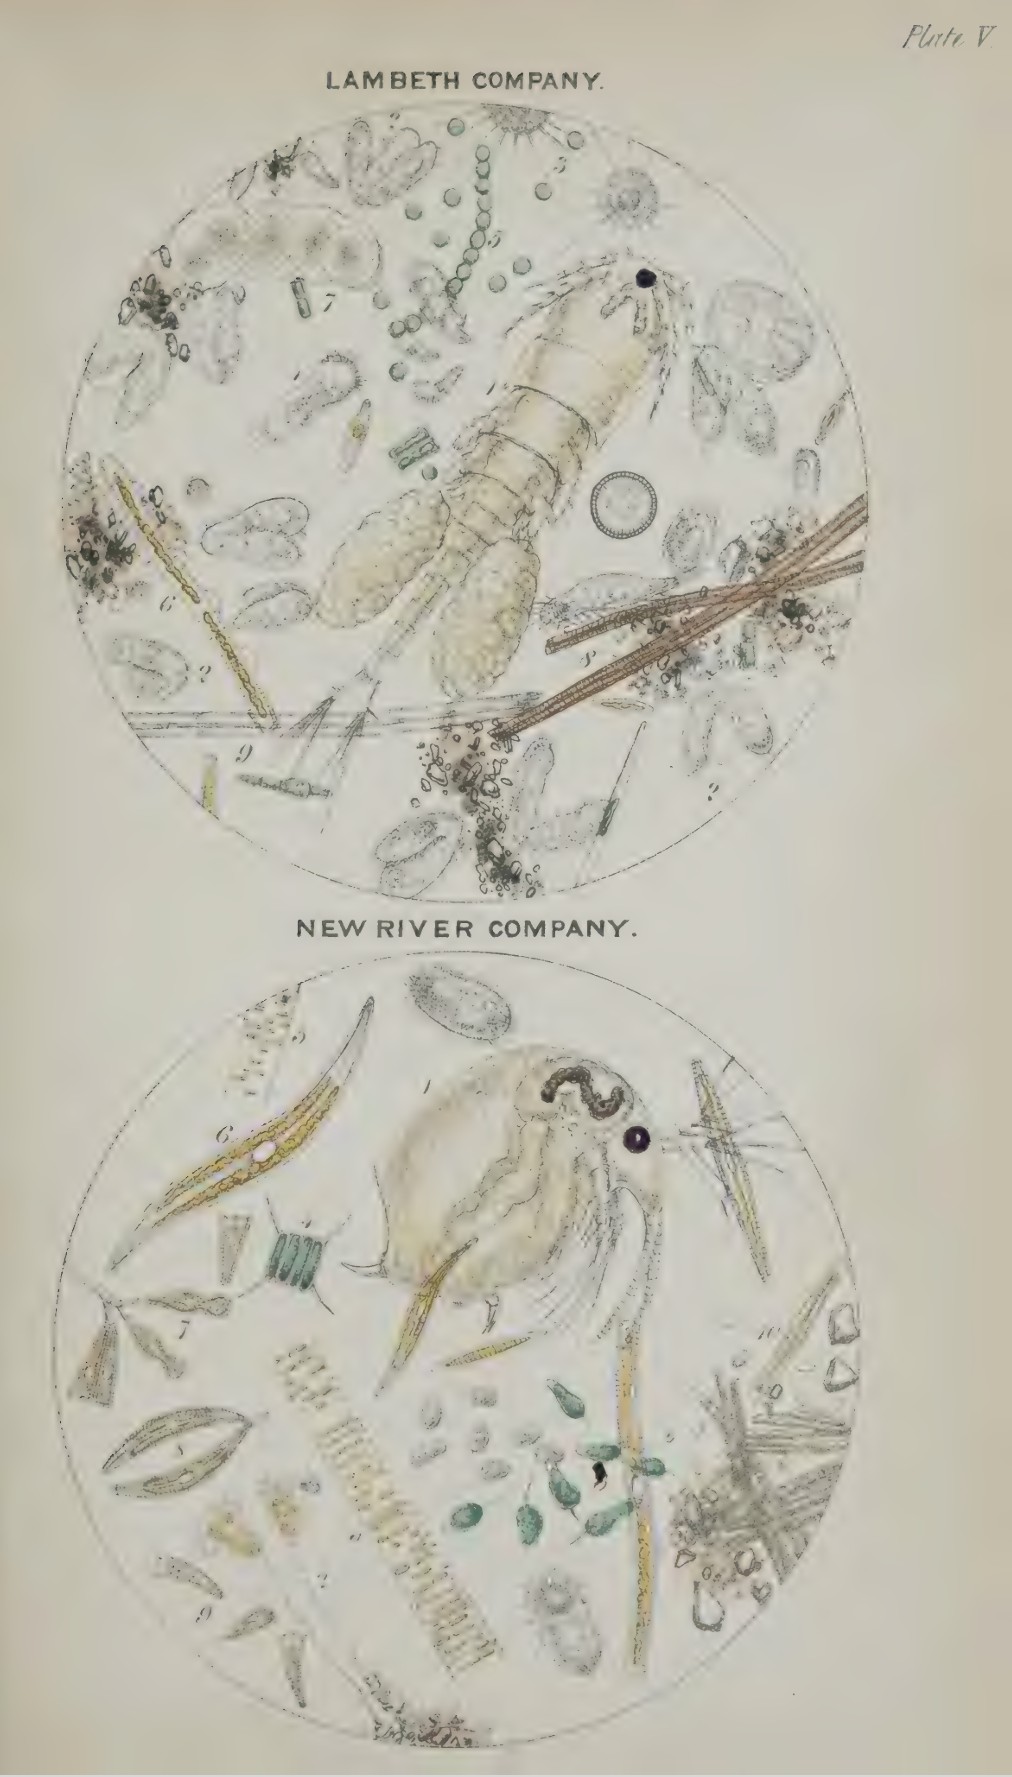
The Lambeth Company’s water “is procured from the river at Lambeth, and not far from a large sewer”.
In looking at the samples of water Hassall concluded that “the water of the Companies on the Surrey side of London, viz. the Southwark, Vauxhall, and Lambeth, is by far the worst of all those who take their supply from the Thames. They are demonstrably contaminated with more or less of the organic and decomposing matters, animal and vegetable, derived from sewer-water”.
In the above drawings, the lower is from the New River Company, who took water from the springs around the Hertfordshire town of Ware, along with the River Lea in Hertfordshire. This water was transported along a man-made river to the reservoir of the New River Company in northern Clerkenwell, from where it was distributed to consumers across the city.
See this post on New River Head and London’s Water Industry.
Hassall described that in the New River Company’s water, “living animalcules were not very numerous, but that it contained great numbers of Diatomaceous”, and that it also held abundant filaments of Fungi, dead organic matter, and much earthy matter, so even using a source well away from the polluted city did not mean that you had a clean supply to distribute to your consumers.
The water of the Hampstead Water Company was described as being generally bright and clear, but did contain numbers of Entomostraca and Infusoria.
The East London Company took their water supplies from the River Lea, and it was described as being similar to the water of the New River Company.
The Kent Company took their water from the Ravensbourne, and this water contained numerous species of the organic life that Hassall listed, along with much dead organic matter, and for good measure, quantities of grit.
Arthur Hassall was rather innovative in his thinking about sources of pollution in the Thames. He did not just look at the sources within central London, but considered the Thames as an overall system, comprising the core river, along with all the tributaries and the towns along the river and tributaries, as the inhabitants of all these towns were also putting all their rubbish, industrial waste and sewage indirectly into the Thames, and all this would eventually find its way to where the central London water companies were extracting their water.
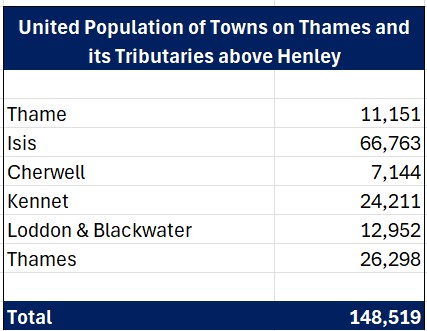
Hassall used the 1841 census to illustrate the problem, and in the following table, he had added up the population of the towns along the Thames and tributaries above the town of Henley (Hassall used the name Isis for the river for its length from source to where it joins the River Thame by the village of Dorchester in Oxfordshire):
The following table shows the population along the Thames from Henley to London, as well as the towns along the tributaries that join along this section of the Thames:
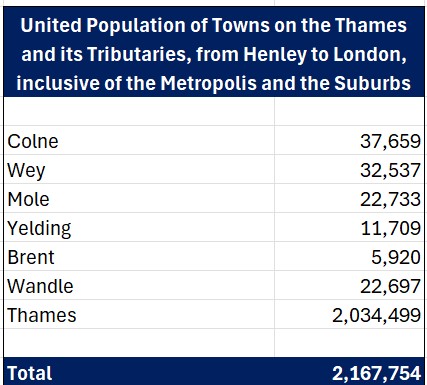
This gave a total population of 2,316,273 living within the system of the Thames and its tributaries up to and including the city of London, according to the 1841 census (although it was higher than this as Hassall admits that there were some small towns where he had not been able to find the population).
It was not just the population along the river, but also the rapid growth of industry in London, and major towns in the river and tributary area, also produced polluted water as an industrial by-product, and frequently dumped this into the river system.
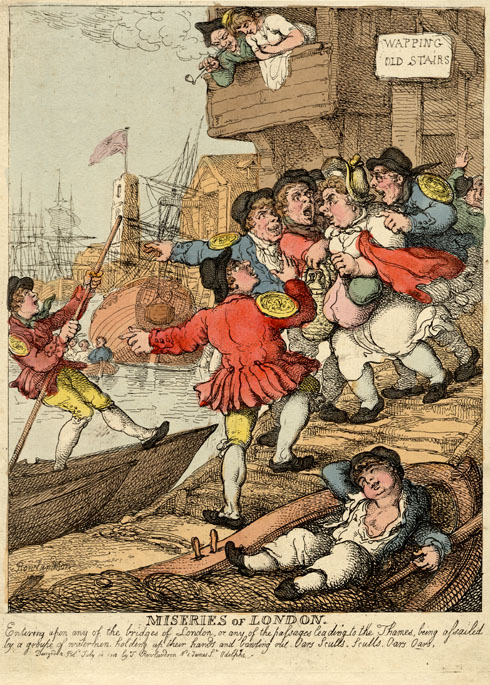
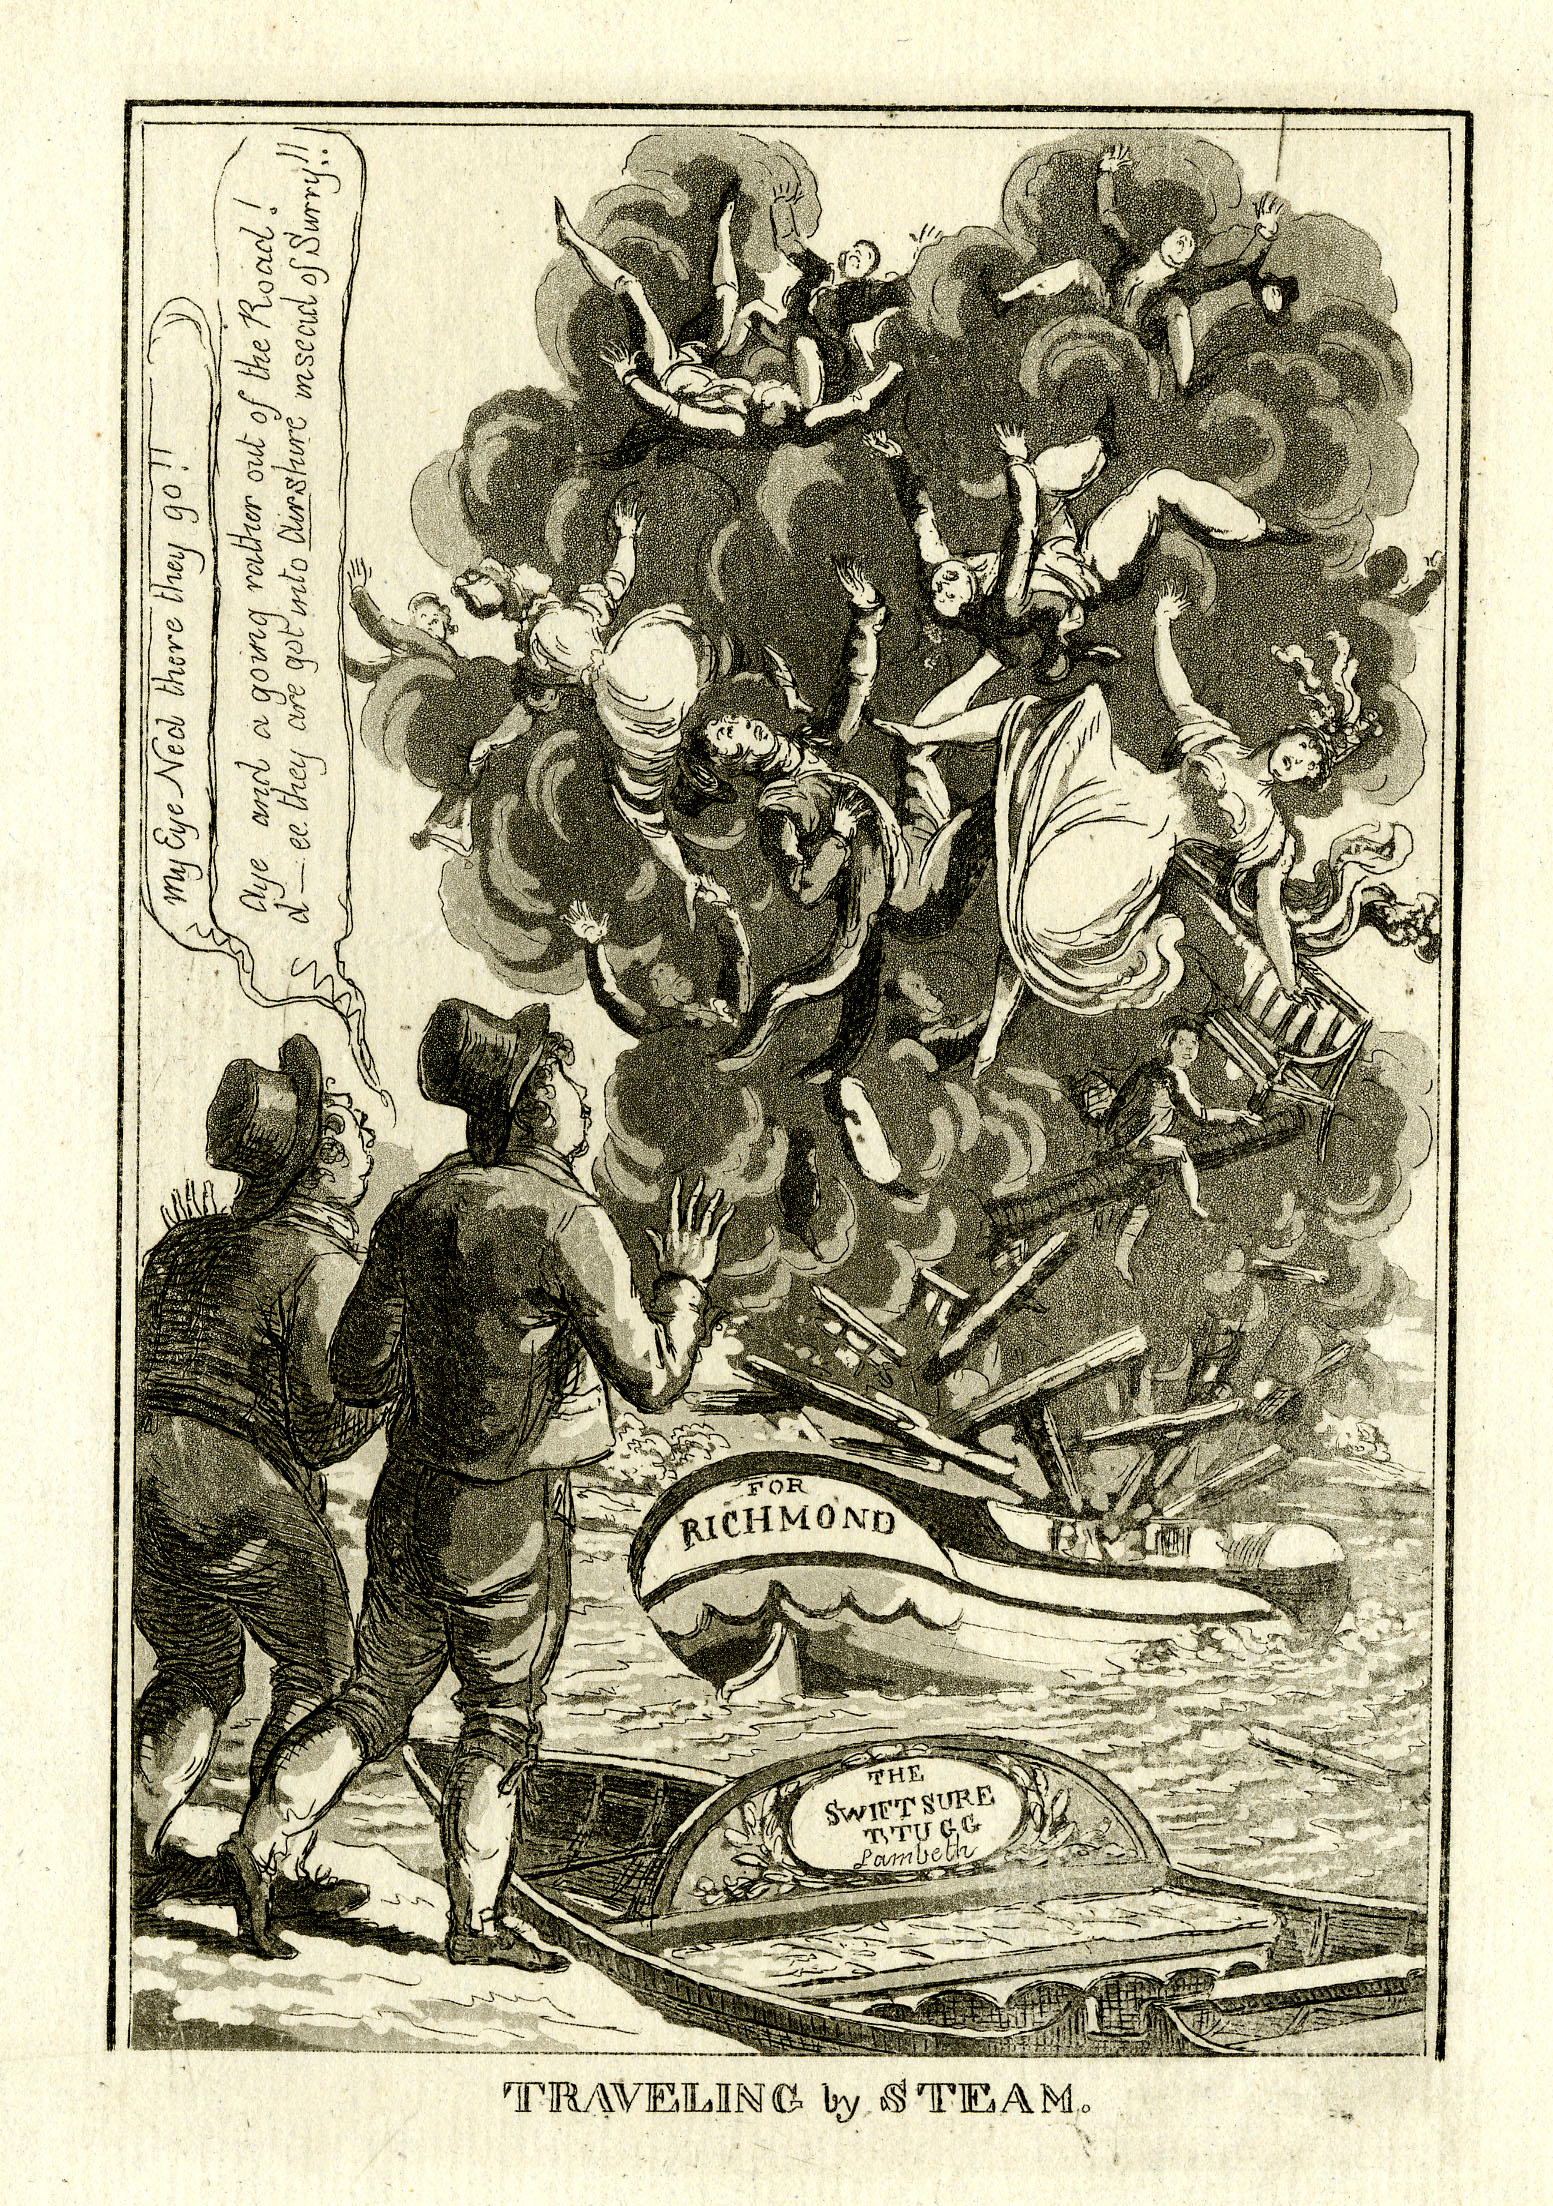
The state of the river was such that there were many cartoons emphasising the appalling state of the river, and the impact that it had on the health of the city’s residents, such as the following from Punch magazine in 1858:

Source and attribution: Punch Magazine, Public domain, via Wikimedia Commons
In the book, Hassall included a section on Remedial Considerations, where he offered suggestions for improving the quality of water supplied to Londoners.
In doing so, he does not consider cleaning up the river, rather by seeking cleaner supplies of source water. His reasons for assuming the state of the river will not change are:
“It has been shown, and the fact is established by incontrovertible evidence, that all those companies who take their water from the Thames draw it from a polluted source, and, as long as this river is employed as the outlet of all the sewage of so vast a city as London, so long must its water used by so many of the metropolitan companies be bad at its sources, it can scarcely be otherwise than impure when delivered to the public.”
The challenge was in finding new, clean sources of water. Hassall looked at the River Wandle, which had a source in springs near Croydon, along with a large pond, however he finds that the refuse of a gas-works, a tan yard. a slaughter house and the sewage of the town is poured into the pond, and hence the Wandle.
Similar issues are found with all the small rivers around the wider area, people, industry, and even cross contamination between streams and canals.
In the mid-19th century, it seems almost every possible source of water in the counties around London was polluted to a greater or lesser degree.
Artesian Wells were a possibility, as these draw water from deep below ground, however Hassall considers the “operation of boring deep into the bowels of the earth” as expensive, uncertain and unnecessary, and that we should really be using the abundant supplies of water that nature provides on the surface of the earth.
Hassall recommended that open reservoirs be covered up, that cisterns should be cleaned regularly, and that water in cisterns should be refreshed, being stored in a cistern for no longer than 24 hours. At the time, many of these cisterns were made of lead, which was not recognised as a problem in the mid 19th century.
Filtration was identified as a major way of cleaning water between source and distribution, and Hassall conducted a series of experiments to determine the best method of filtration, using different types of charcoal, patent filters, loam, mild and strong clays, to see which individual or combination of materials would provide the cleanest water, and he identified a combination of charcoal, and clay mixed with sand as the best approach, and that three consecutive filtering operations should be carried out.
His summary recommendations are that a proper water supply to a populous city such as London, requires:
- An unpolluted source
- An unlimited supply
- Perpetual renewal
- Filtration
- The abolition or modification of reservoirs and cisterns
- Moderate cost
It would take many decades for the changes to be implemented that were needed to provide London with a clean supply of water. Investment, engineering, technical improvements, new sources, storage methods, distribution networks etc. were all needed, and today, on the whole, we have a very clean supply of water.
The Thames is today, cleaner than it was in the mid 19th century, but there is no way that I would want to drink water straight from the river, and I find it worrying when I see children playing on the foreshore, who, being children, will put their fingers in their mouth.
The Tideway Tunnel will prevent many of the overflows into the river from the wider London area, however as Hassall described back in 1850, it is the whole catchment area of the river and tributaries that need to be clean, as these contribute to the waters that flow through central London.
Perhaps we need another Arthur Hassall to graphically describe the contents of the water that flows through the city.
He seems to have been widely respected for his knowledge of water contamination. In July 1850, the same year as the publication of his book on the water companies of London, he was speaking at the Botanical Society of London “On the colouration of the water of the Serpentine”, where he described the cause of the vivid green colouration of the Serpentine that had taken place that year.
In the same year he also published a report on the “Adulteration of Coffee”, which apparently was a problem at the time, as he reported that roasted wheat, beans and potatoes had all been used.
As well as the pictures shown earlier in the post, Arthur Hassall’s writing was always very descriptive, and I will leave you with this graphic sentence from his summary, back in 1850:
“It is thus beyond dispute that, according to the present system of London water supply, a portion of the inhabitants of the metropolis are made to consume, in some form or other, a portion of their own excrement, and, moreover, to pay for the privilege.”