Monthly Archives: April 2024

The London Data Store

London has always been a complicated place, and today is probably more complex than it has ever been, and it is really impossible to comprehend what London actually is (if that makes sense).

To understand aspects of London’s history, there are a range of different data sources, and I have used some of these in previous posts to show how we can understand the city.

In the post “Bills of Mortality – Death in early 18th Century London”, I used published Bills of Mortality, weekly and annual records of the numbers and causes of death in London, to understand what caused death in London, the diseases and accidents that could have killed you in 1721. This also included a look at a book by John Gaunt who studied these records and made 106 observations on births, deaths, sickness, disease, how information in the Bills of Mortality was used, London’s population, comparison between the City and Countryside etc. The book is a fascinating window on the late 17th century, and explains much of what we see in the 1721 Bills of Mortality.

In my post, “John Snow and the Soho Cholera Outbreak of 1854” I looked at the work of John Snow who used data on the location of cholera outbreaks to pinpoint the source of the infection in Soho.

And using 1881 census information, I took Bache’s Street, an ordinary city street to the north-east of Old Street, and looked at who was living in the street, where they were born, ages, family and household size, profession etc. to really understand what a typical London street would have been like, if we could have walked along the street in 1881.

So whilst these data sources can help us understand the city, in the past, there was only a limited amount of readily available data for us to interpret today.

That has now changed dramatically, and with the use of technology, a vast range of data is now available through an online resource, the London Data Store.

The London Data Store has been created by the Greater London Assembly, and has made available a very extensive range of raw data, and information, freely available, to view and download, and to use to understand different aspects of London today, how the city has, and continues to evolve.

There is data in the London Data Store on things you would expect (such as population growth) as well as unexpected data, such as a spreadsheet of every recording studio in the city.

So for today’s post, I have used a sample of the data available, to take a look at different aspects of London, data about life in the city, data which shows how the city is changing, and data about everyday services such as the London transport system.

All is available to download and interpret, and for today’s post I have taken a rather random look at some of the data available, to produce some different views of the changing city.

If you do not want to download data and make your own interpretations, the London Data Store holds a single document: “The State of London – A Review of London’s economy and society, January 2024”. This 144 page document provides an overview of many aspects of London.

I have taken the first two tables from “The State of London”. The first table provide a comprehensive overview of geography, demography and economy statistics for London:

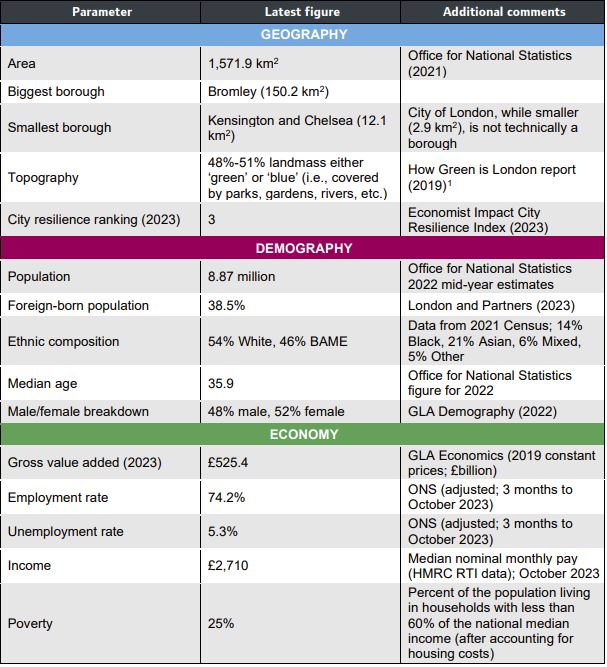
Some of these, such as the City Resilience Ranking require some interpretation. Resilience ranking is where a city is judged on a range of criteria such as good governance, environmental credentials and climate targets, and London ranks 3rd in the world behind New York and Tokyo. London score highly for its knowledge economy and tech ecosystem. The nearest European city is Paris at number 7.

The report also compares London with the top two ranked global cities, as well as Paris, the nearest European competitor (the resilience rankings are different to the above as the above are the latest 2024 figures):

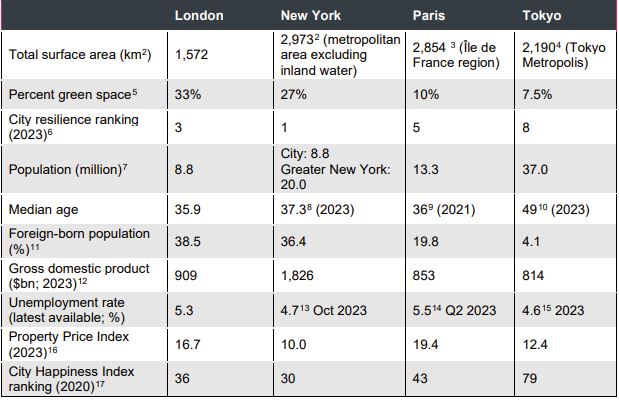
The above table shows that London is a very green city compared to some of its global competitors, and is geographically smaller and with a lower overall population.

The foreign born population percentages are very similar in London and New York, lower in Paris and very much lower in Tokyo. London is ranked at number 36 in the City Happiness Index, which just keeps it within the Gold ranking of happy cities.

Fly Tipping

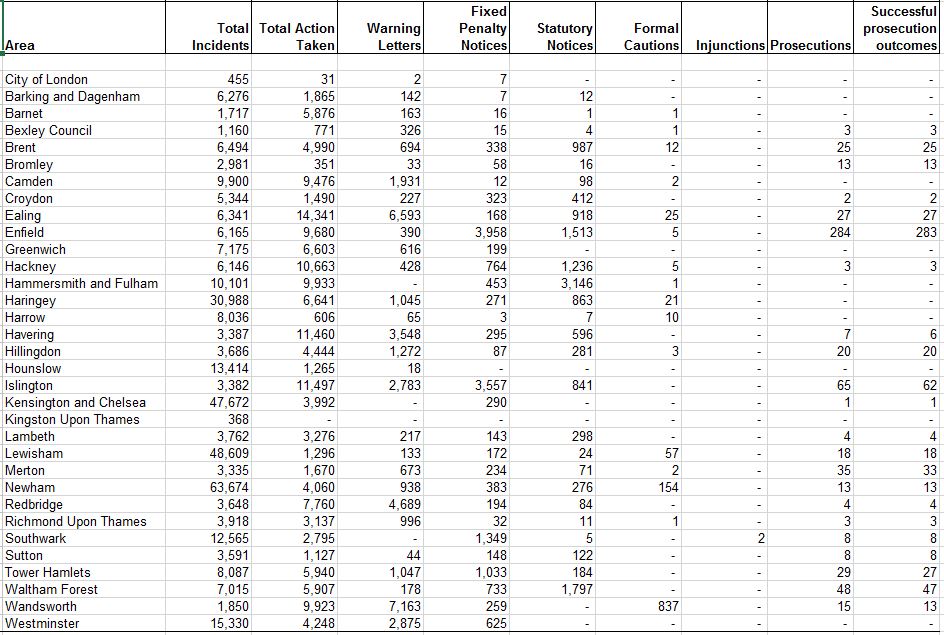
The above tables come from a very high level view of London, but the London Data Store also has plenty of very detailed statistics about specific aspects of the city, for example, the following table lists incidents of fly tipping in 2022 – 2023:

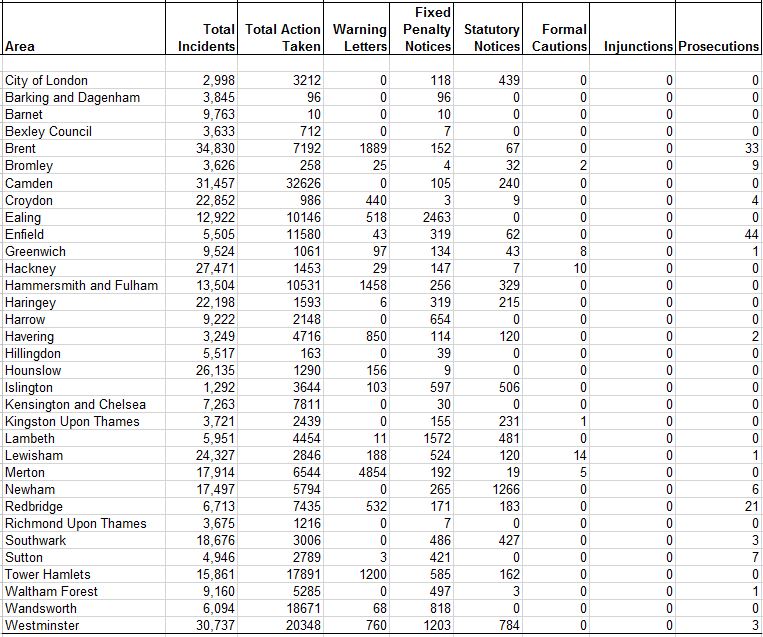
The above table shows that there were 422,078 incidents of fly tipping, and whilst there were high numbers of actions taken, warning letters and fixed penalty notices, by the time we get to prosecutions, there were only 135, so only 0.03% of fly tipping incidents resulted in a prosecution, which seems rather low.

What is interesting is that the prosecution rate does not reflect the number of incidents in each borough, so for example, Enfield had 5,505 incidents which resulted in the highest number of prosecutions across all London boroughs, with a total of 44, whilst Camden had 31,457 incidents which resulted in 0 cautions, injunctions or prosecutions.

There is obviously more behind this, such as the type of incident, how well the council is resourced etc. It also helps to understand how an anti-social aspect of life such as fly tipping has changed over time, and the following table is from the period 2009 – 2010, when there were 358,572 incidents:

Again, we need to be careful without knowing some of the detail behind the figures in the tables, however what is clear is that there were more prosecutions in 2009 – 2010, so it could be assumed that the drop in council funding over the last 15 years may have resulted in councils having insufficient resources to prosecute an anti-social crime such as fly tipping.

The benefit of data in spreadsheets is that you can manipulate the data to show different views. I use a mapping application on the blog which allows a spreadsheet to be imported and the data within the spreadsheet to be viewed on a map.

The following two interactive maps may not show in the emailed version of the post. If not, go to the post on the blog here to fully view the maps.

London Museums and Public Galleries

There is a whole section in the London Data Store on the city’s Cultural Infrastructure in 2023, and the first example I have used is Museums and Public Galleries. I imported the spreadsheet into the mapping application to produce the following map (click on each marker for the name of the institution):

London Music Recording Studios

There are spreadsheets covering all manner of Cultural sites and instructions, for example, if you wanted a list of all the music recording studios across London, then there is a spreadsheet for that, which I have imported to produce another map:

London Pubs

There is also a spreadsheet of London’s pubs and bars in 2023, however with over 4,000 entries I did not want to overload the site on which the blog is hosted by importing and creating a map, so I will use a graph on the number of London pubs between 2001 and 2022:

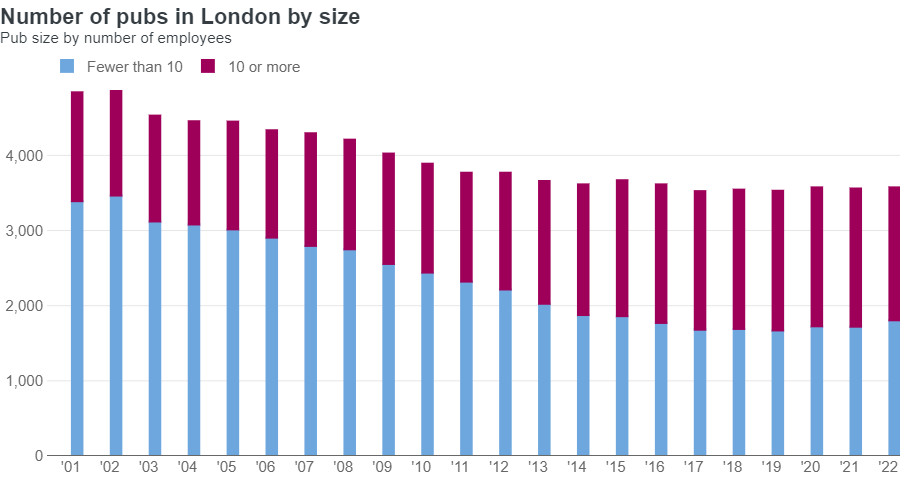
What is interesting about the graph is that whilst there has been a general decline in the overall number of pubs, this has mainly been a result of the closing of small pubs, those employing fewer than ten staff, whilst larger pubs employing more that ten have increased in number.

This can be seen on the streets, with the dramatic decline in the small corner or terrace London pub, and the increased number of pubs such as Wetherspoon’s which are generally much larger and employ more people.

As could be expected, there is a large amount of detailed information about London’s transport system in the London Data Store, and the following example show what is avalable:

Temperatures on the London Underground

Coming out of winter and with the rather chilly spring, the experience of being on some of London’s underground lines on a hot summer day may be a memory at the moment, however the London Data Store has a spreadsheet recording the temperature on the underground lines over the year, and I took the column showing the maximum recorded temperature for each month to create the following graph:

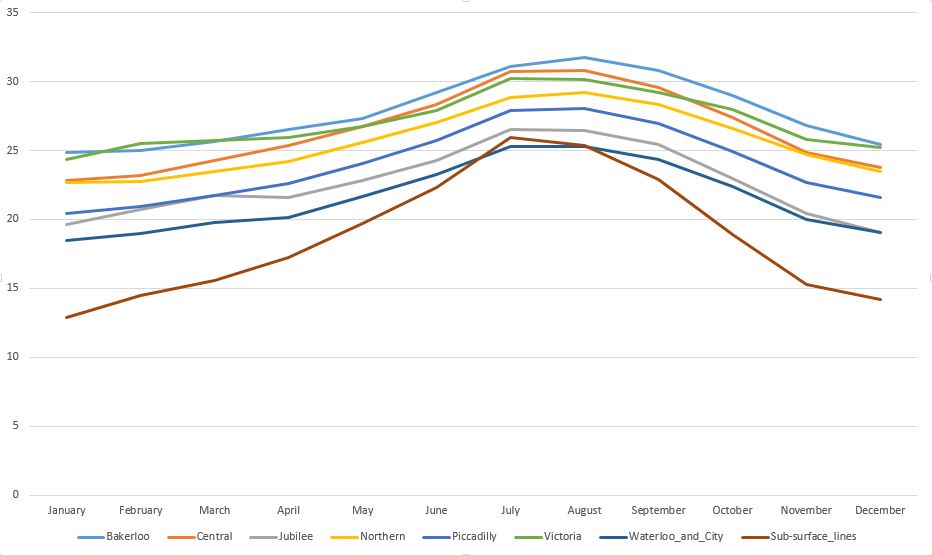
The graph shows that the Bakerloo Line reached the highest temperature of the whole system in July / August, closely followed by the Central Line.

As could be expected, the sub-surface lines (Circle, District etc.) have the lowest maximum temperatures. apart from a short peak in July where they exceed the Waterloo and City, which is probably because lines such as the Circle and District respond quickly to external temperatures, whereas deeper lines probably take more time to absorb the heat from above.

Numbers of Journeys

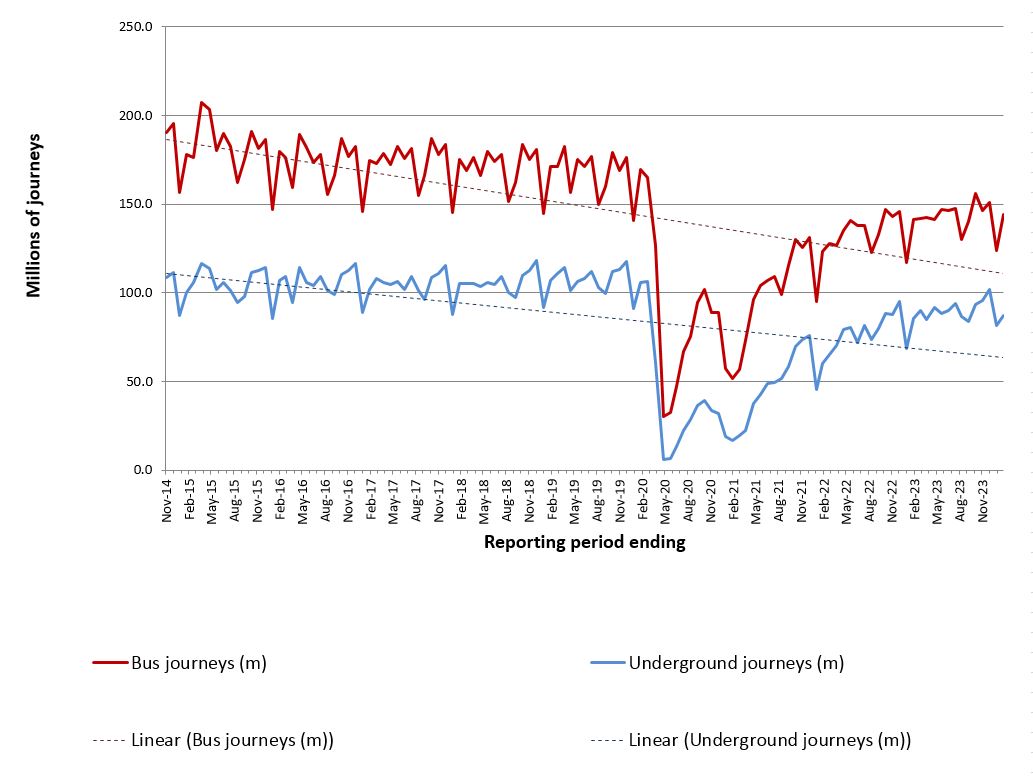
These graphs show that by the end of 2023, the numbers of journeys taken had still not returned to their pre-Covid numbers, and that although an initial post-Covid rapid increase had taken place, this seems now to have slowed down.

The first graph shows journeys on London’s buses and the underground:

And the second graph shows journeys on the DLR, Trams, Overground and the Cable Car across the river on the Greenwich Peninsula:

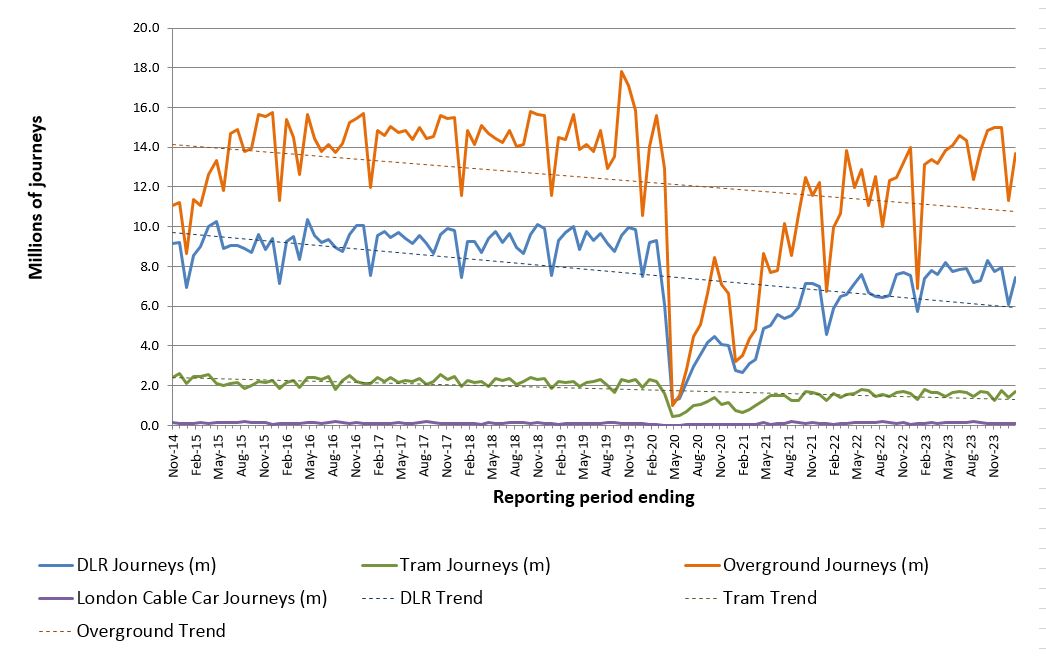
Again, journeys across these methods of transport have not returned to their pre-Covid peaks, although the Overground rail network is almost there.

London Buses

As well as reducing passenger numbers on London buses, there has been a decline in the number of buses travelling the streets of the city.

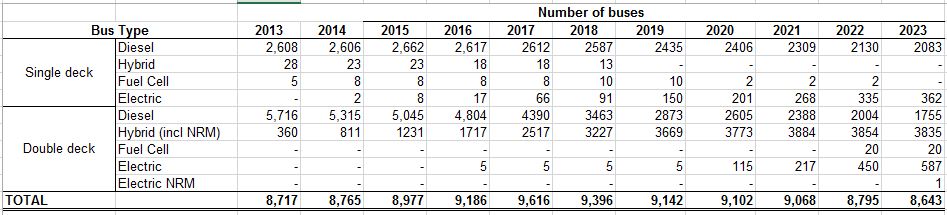
The following table shows the number of buses by type, between 2013 and 2023 and shows a decrease in the number of diesel powered buses, and an increase in the number of electric. There has also been a decline in the total number of buses from 8,717 in 2013 to 8,643, and whilst this is a very small decline, it masks a much larger drop from a peak of 9,616 in 2017:

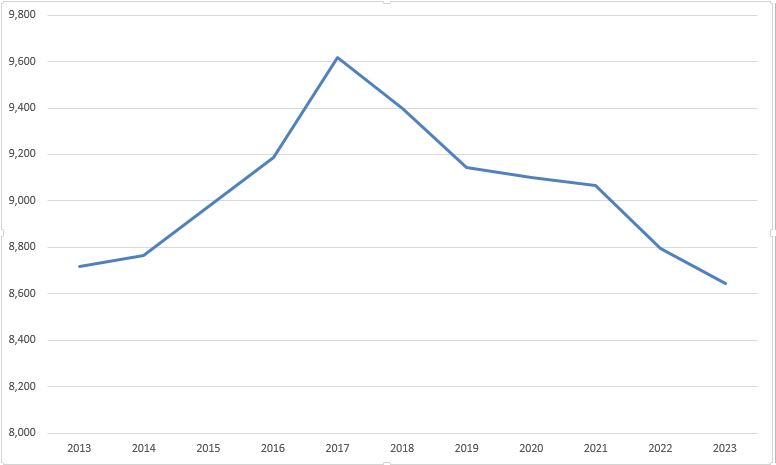
By putting this data in a graph, the decline in bus numbers from their 2017 peak is rather dramatic:

Annual Bike Hires

There is also a spreadsheet of the number of hires of bikes within the Santander Cycle Hire Scheme:

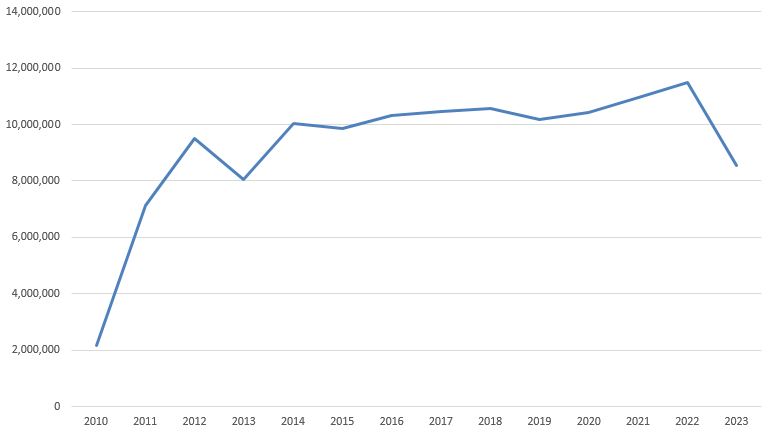
Whilst this shows an increase since the early days of the scheme, starting in 2022 there has been a significant drop off. This may be due to the significant number of other bike hire companies now operating across London, as there now seems to be so many different bikes cluttering the streets of the city.

Numbers and Types of Police Officers

Crime has long been an issue in London, and features in the campaigns for the upcoming London mayoral elections.

The London Data Store has a variety of spreadsheets with details on the type, frequency, locations etc. of crime across the city, as well as details about policing in London, and the following graph is taken from a spreadsheet of police numbers in London:

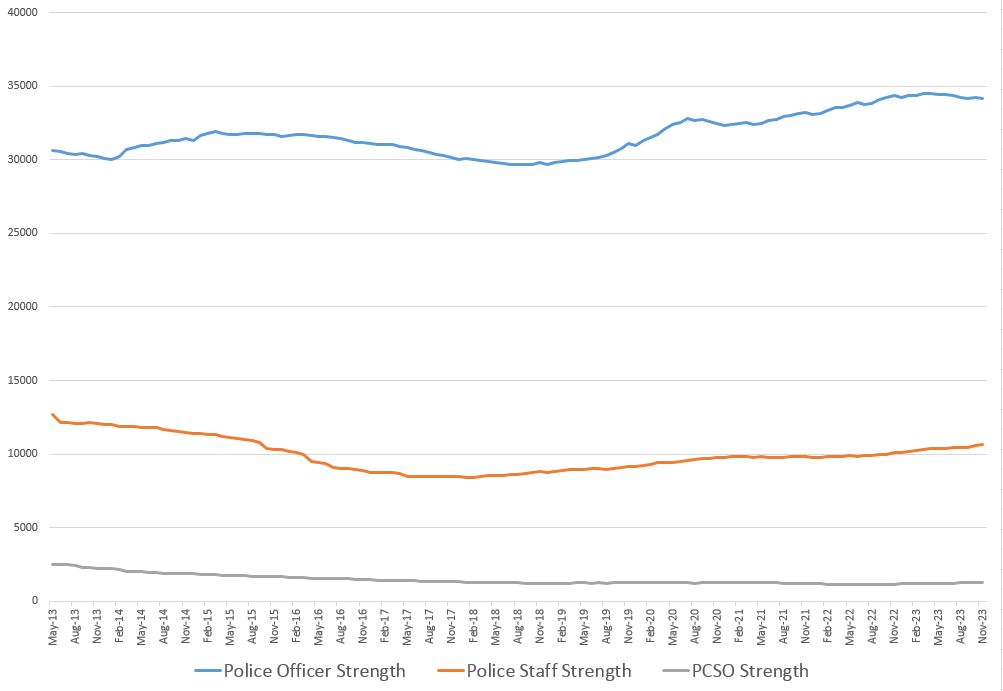
The graph does show that there has been an increase in the numbers of Police Officers in the ten years between 2013 and 2023, but there has also been a reduction in the numbers of Police Staff (those who support the front line Police Officers) and also a reduction in the number of Police Community Support Officers (PCSO).

So in 2013 there were a total of 45,835 officers, staff and PCSOs and 46,140 in 2023. A small increase, but whilst there has been an increase in Police Officers, is their effectiveness reduced by a smaller number of supporting police staff, and a reduced number of PCSO’s?

There are also other factors involved, such as:

The Growth in London’s Population

There is a range of demographic data covering London in the London Data Store. The first example I will look at is the change in the city’s population, along with comparisons with the rest of the country:

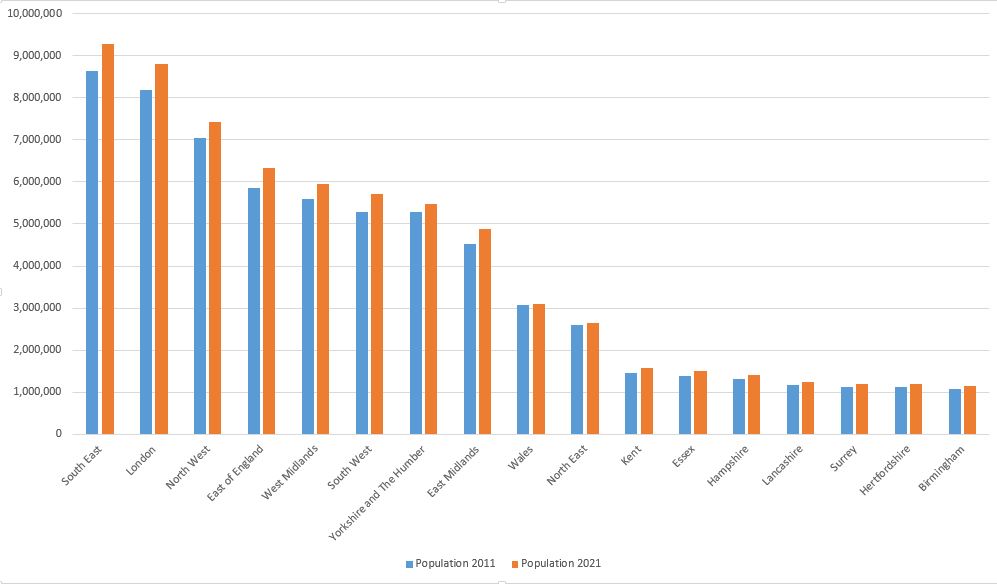
The above graph shows population changes between 2011 and 2021 in a number of regions and counties across the country.

London is the second pair of columns on the left, and in 2011, London had a population of 8,173,941, and the population ten years later based on the 2021 census was 8,796,628.

So between 2022 and 2021, there has been a 7.6% increased in London’s population. Although not exactly the same years, going back to Police numbers, we can see that between 2013 and 2023 there had been an overall rise of 0.66%.

Again, the years being measured are not exactly the same, but the data shows that there has been roughly a 7.6% increase in population and a 0.66% increase in Police staff, so assuming there is roughly a linear relationship between the two, Police numbers have not kept pace with population growth over the last 10 to 12 years.

The London Data Store contains many different views on London’s population. One data set lists the annual births in the city, and the following graph shows these numbers between 1992 and 2024:

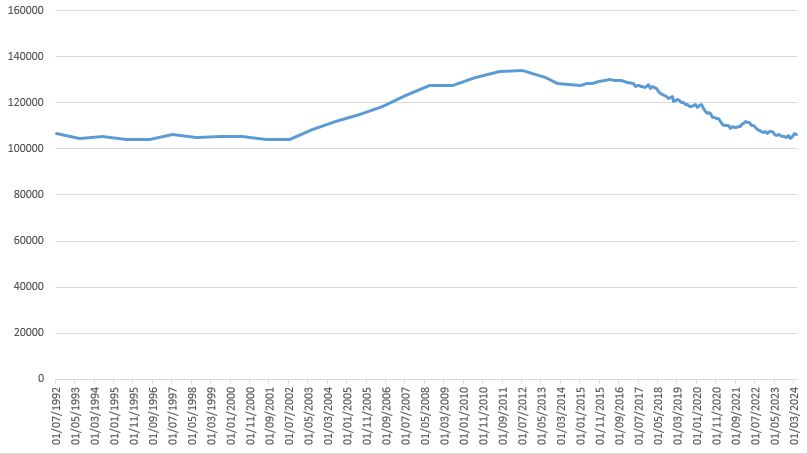
The number of births was stable between 1992 and 2002, but then had a rapid increase until 2015, when the numbers being born in the city start to decrease towards the 1992 – 2002 average.

The London Data Store also records the number of live births by mother’s place of birth, which mirrors the increase then reduction in numbers shown in the above growth, but here we can see the impact of immigration into the city:

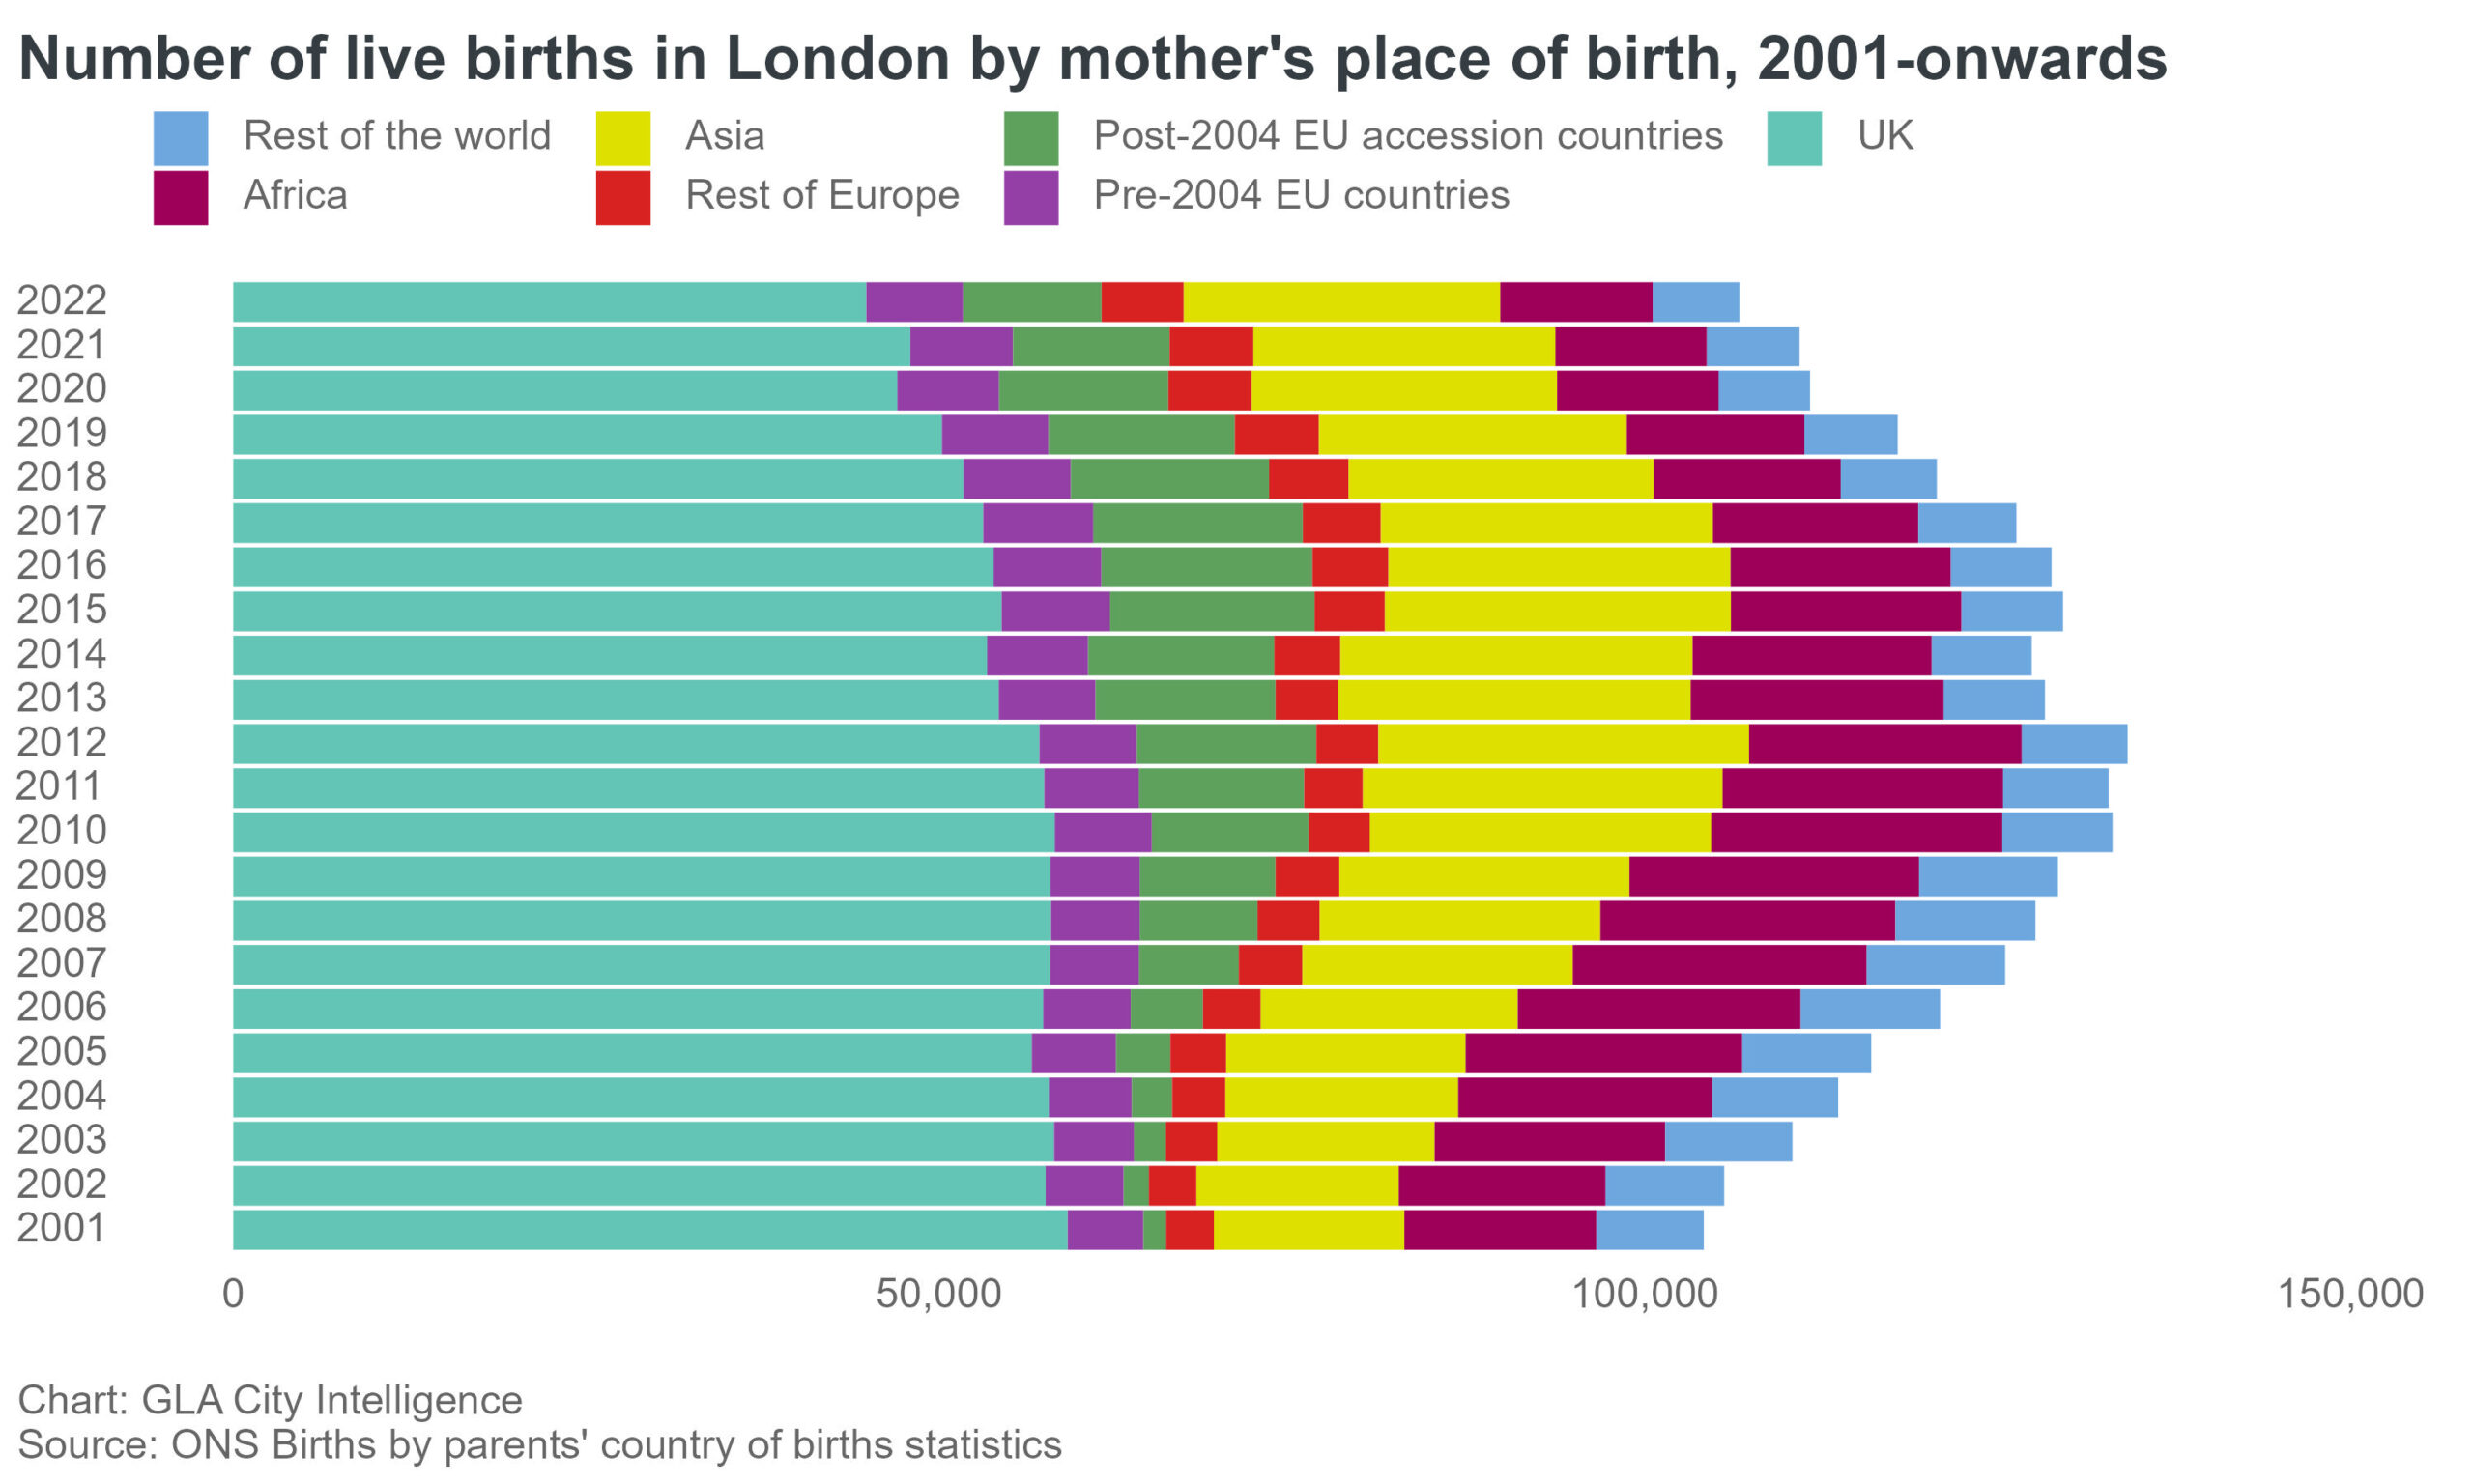
The impact of events in London and the country can be seen in the above graph. For example, look at the dark green bars which record the number of births to women from “Post-2004 EU accession countries” (Poland Czech Republic, Hungry etc.).

Births to mothers from these countries increase rapidly from 2004, then start to decrease from 2016, the year of the Brexit vote.

We can also compare London with the rest of the country:

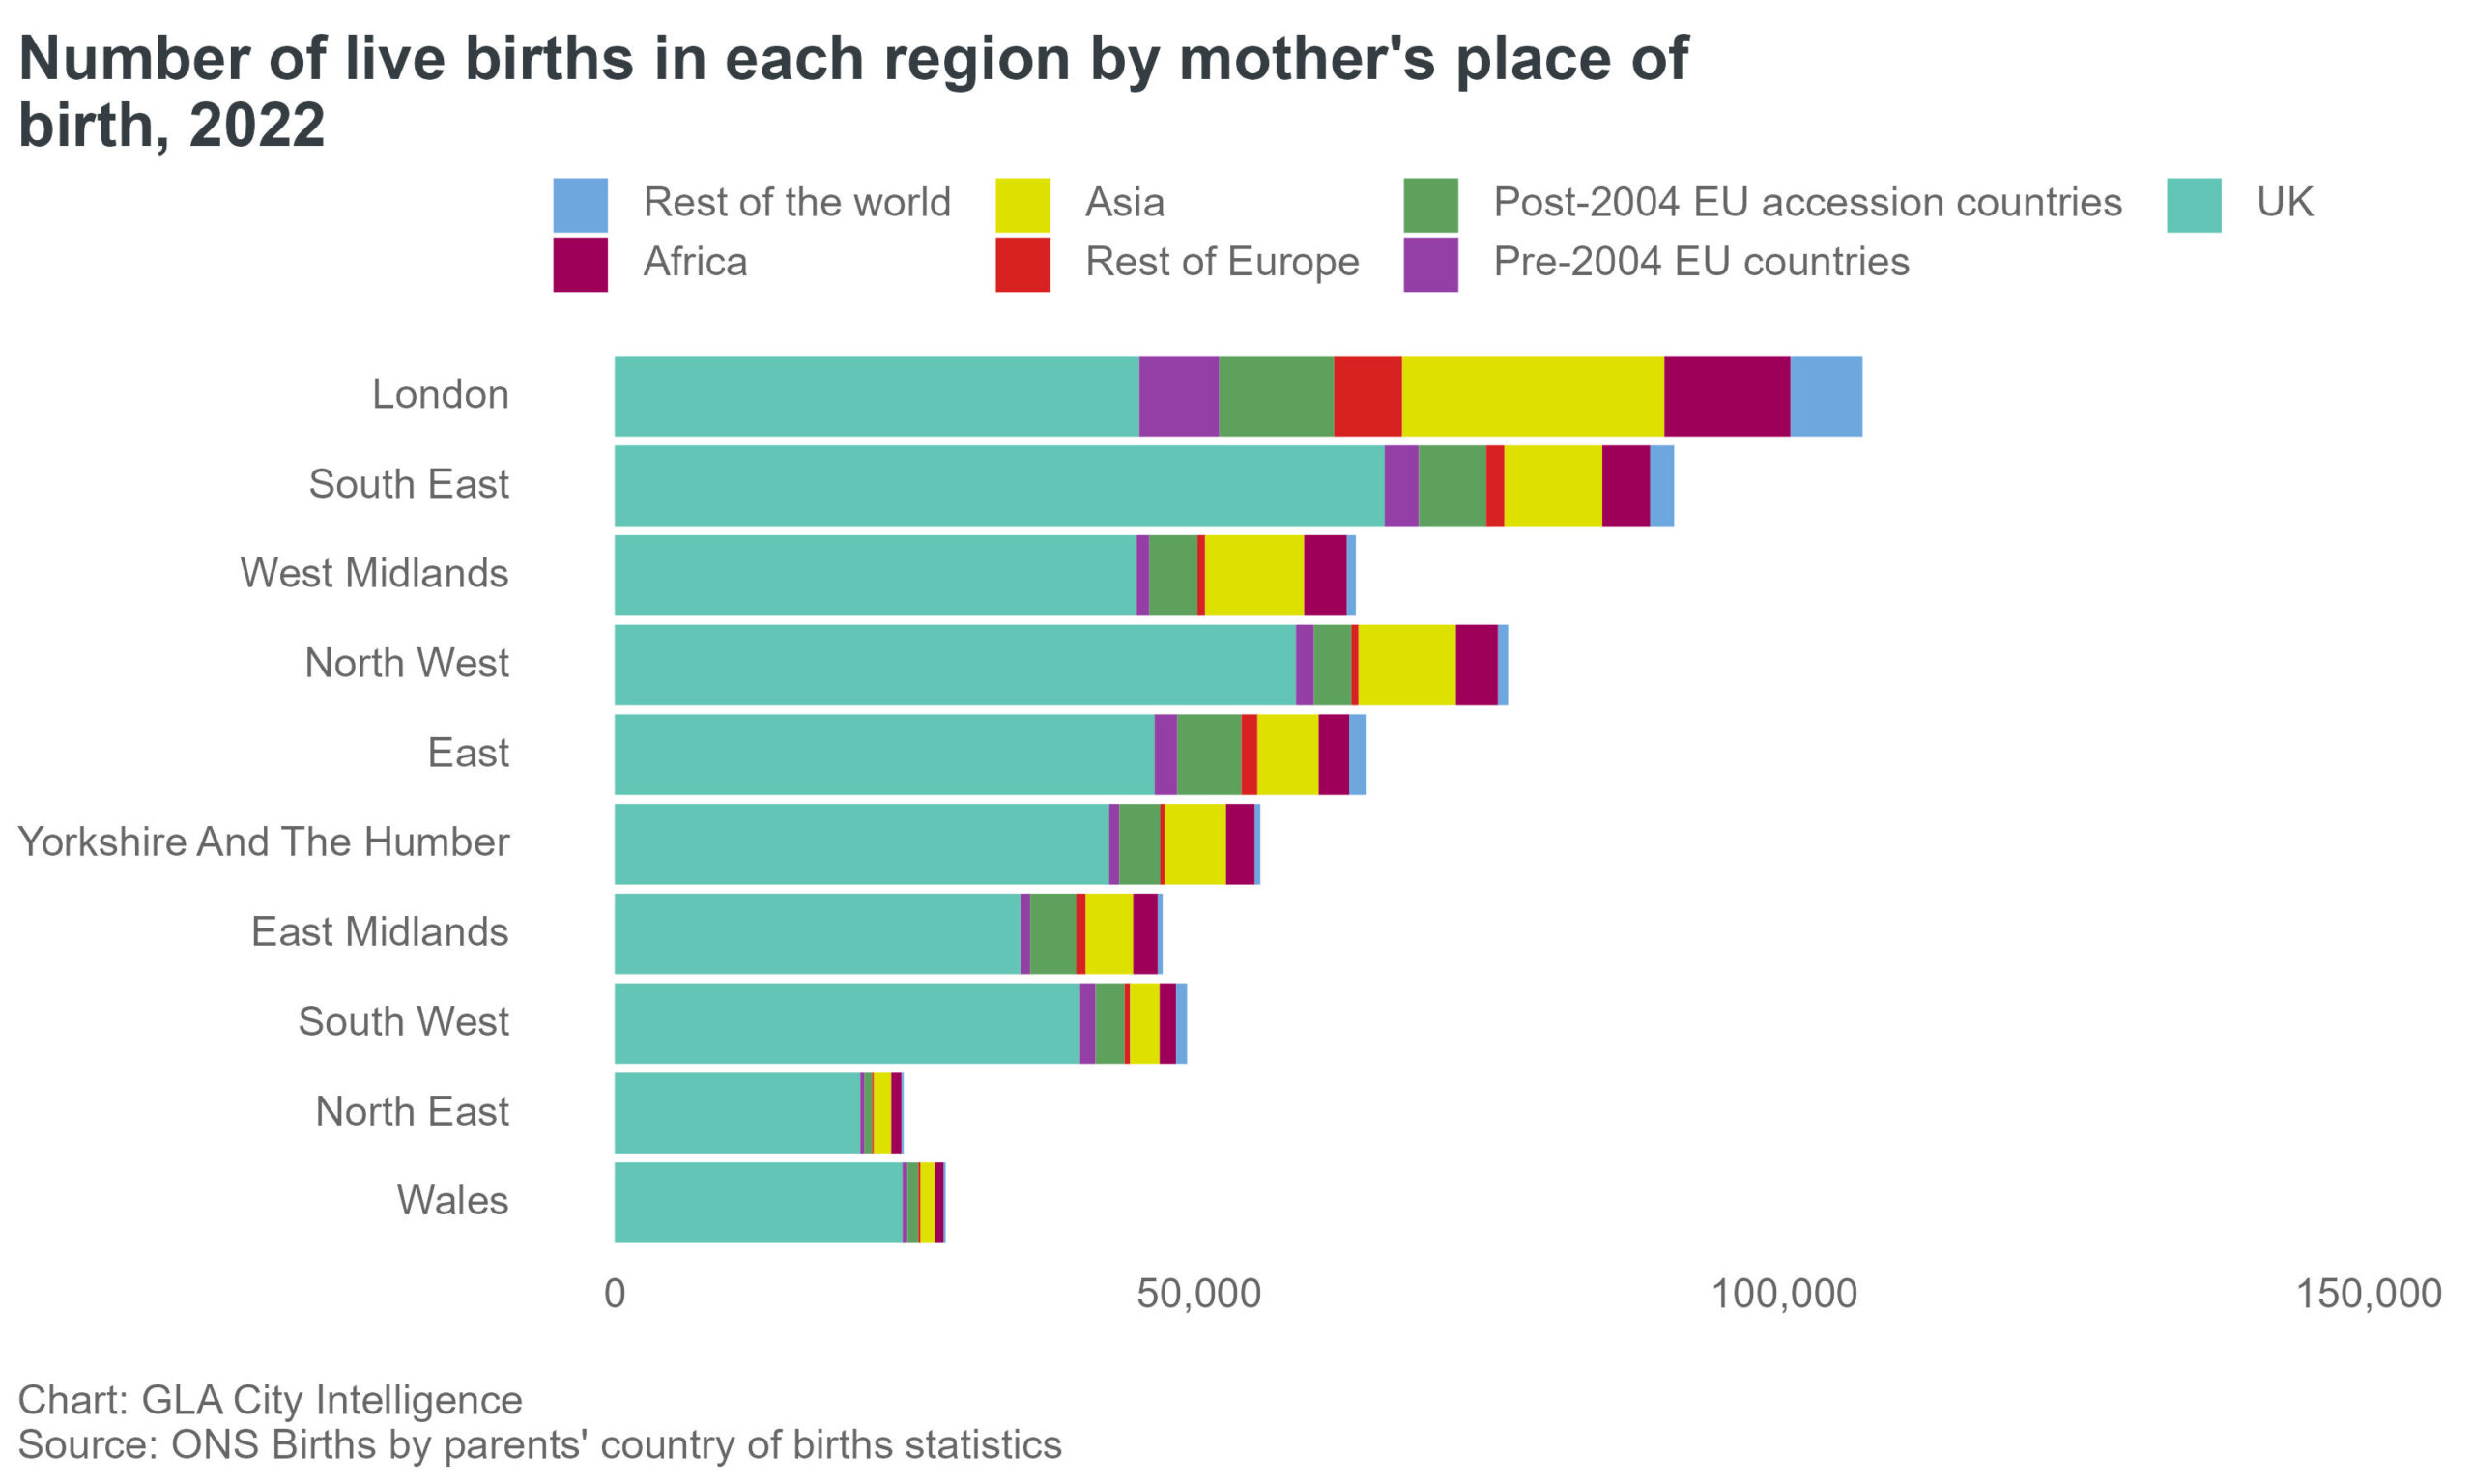
Which shows that London has by far the highest number of births, whether viewed as an absolute number or a percentage, to mothers born outside of the UK than any other region of the country.

We can also look at how London’s population has changed over a longer time period, and the following bar chart shows how the numbers have changed across inner, outer and greater London between 1939 and 2011:

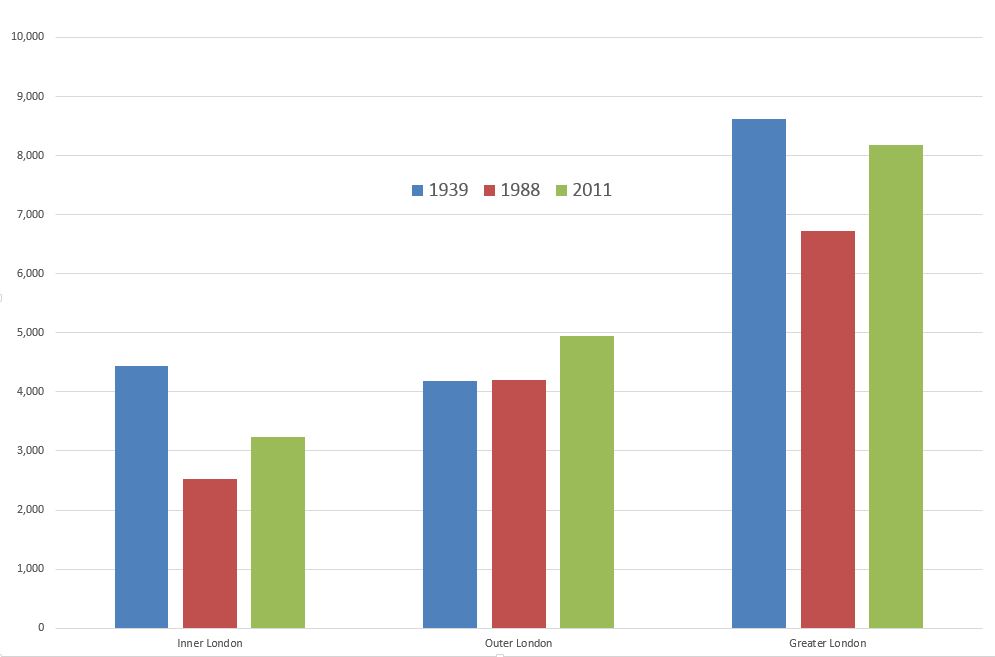
The chart shows that Inner London’s population is still well below the numbers of 1939, which demonstrates that before the last war, inner London was a really densely populated place.

The loss of the docks, industry etc. resulted in the post war population decline, that reached a low in the late 1979s and early 1980s before starting to increase.

Outer London was stable between 1939 and 1988, but has increased since, and Greater London’s overall population was still smaller in 2011 than it had been in 1939, all down to the significant reduction in Inner London’s population.

London’s recent growing population all need somewhere to live, so we can look at:

Living Costs

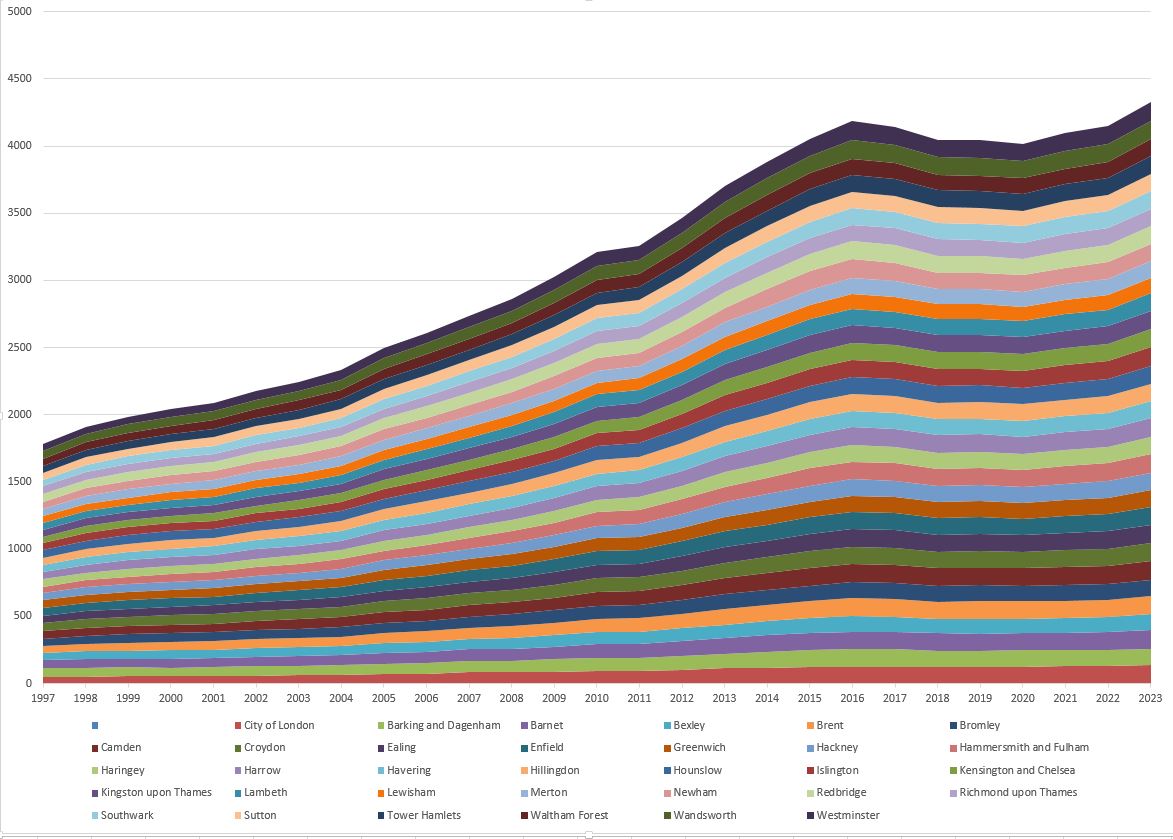
This graph shows the increase in weekly rent charged by social landlords or private registered providers across all London boroughs:

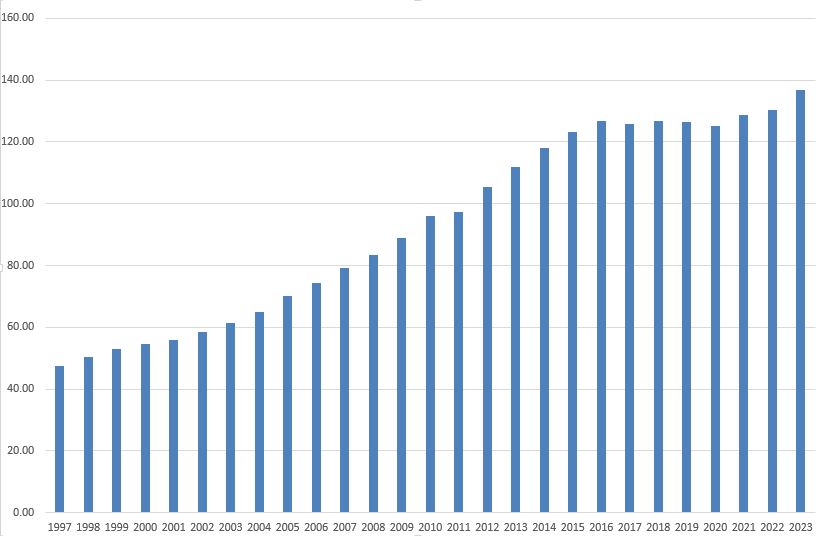
The above graph shows that weekly social rents have increased at a near uniform rate for all boroughs, we can also look at individual boroughs, and the following graph shows the increase in weekly rent in the Borough of Kensington and Chelsea between 1997 and 2023 (the vertical axis on the left is the cost in Pounds):

As well as somewhere to live, jobs are needed, and the following graph shows the number of jobs, by job type between 2004 and 2022:

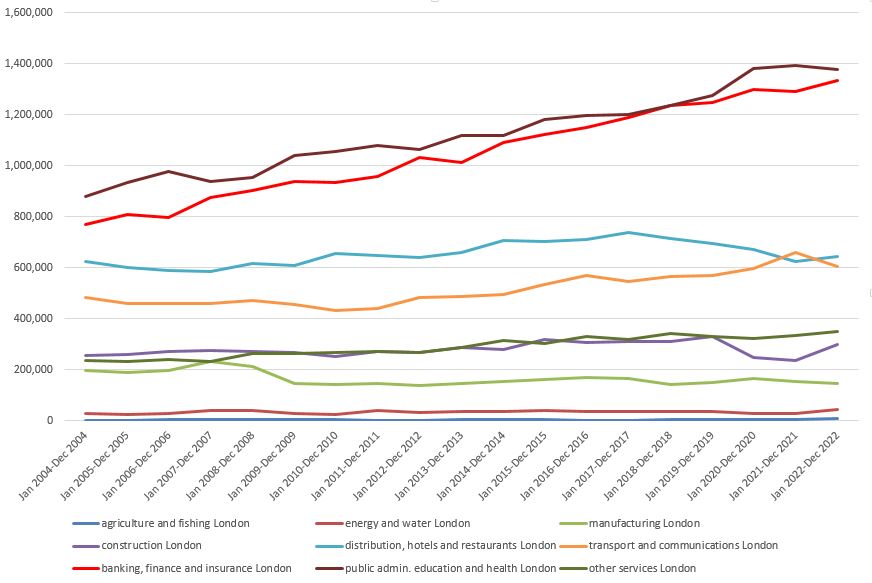
Whilst job types such as construction, energy and water, distribution, hotels and restaurants have shown relatively small changes over time and have not shown long term, significant increase or decrease, the two job types of public admin, education and health (dark brown line) and banking, finance and insurance (red line) have shown a continuous increase in the numbers employed.

All these jobs result in people being paid, and we can look at the mean income of tax payers, by borough:

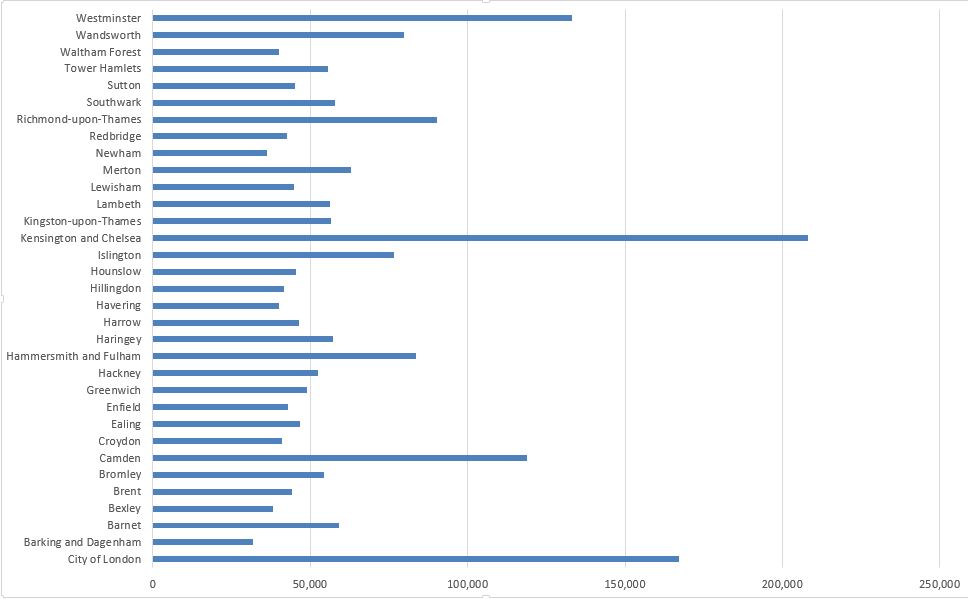
No surprise that Kensington and Chelsea, the City of London and Westminster make the top three, but what could be a surprise is Camden being in fourth position.

The London Data Store is a wonderful resource and I have only just scratched the surface of the data and information available, and the range of subjects covered is remarkable.

For example, there is a spreadsheet covering “Shut in lifts incidents attended by the London Fire Brigade”, and there are a surprising number of these. Between 1st of January 2024 and the 31st of March 2024, there were 1,409 shut in lift incidents, which I found really surprising.

The spreadsheet includes the address and building where the lift in each incident was located, so if you need to know which lifts are best to avoid, you can sort the spreadsheet based on the frequency of each address.

I covered the data on the bus types and numbers earlier in the post, and for the London Fire Brigade there are similar spreadsheets covering the number and types of fire appliances across London.

There is another spreadsheet covering 13 years of stolen animals across London. Not surprisingly, dogs are the most common, but also within those 13 years, two Arachnids, 161 Fish, 1 Rabbit, 15 Insects and 327 Birds have been stolen.

Looking back over the 13 years of stolen animal records, by far the majority are marked as not recovered.

Much of the detailed information in the London Data Store does not go back that far, with the majority covering the last ten to fifteen years, with higher level data going back a bit longer, around the last 25 years.

One of the benefits of this type of data being available is not just for the snapshot it provides of London, but also for long term trends, and if the London Data Store continues for many years to come, it will be an invaluable resource for future historians.

The London Data Store can be found here, and if you are so inclined, it is easy to waste a few evenings searching through, and playing with the wealth of data available.

alondoninheritance.com

Post Office Tower and Tower Tavern

If you would like to explore the history of Puddle Dock, Thames Street and the area between Queen Victoria Street and the Thames, one place has just become free on my walk this coming Thursday, the 25th click here for details and booking, and one place on Sunday the 28th, click here for details and booking.

In February, BT announced the sale of the BT Tower to MCR Hotels for a sum of £275m, and that MCR Hotels plan to “preserve BT Tower as an iconic hotel, securing its place as a London landmark for the future”.

The BT Tower has been a significant London landmark since completion in 1964, and opening for operations the following year, however in the intervening 60 years, the original technical requirements for the tower’s design and construction have become redundant, and as I will explore in today’s post, the tower has now outlived its original purpose, and it will be interesting to see how it transforms over the coming years.

In this post, I am going to call the building the Post Office Tower rather than the BT Tower, simply because that was the original name of both the tower, and the organisation responsible for building the tower, and I must admit (probably age), but I still think of the building as the Post Office Tower.

Located just to the west of Tottenham Court Road, and south of Euston Road, the Post Office Tower is a major landmark within the surrounding streets:

Post Office Tower

The above photo is from April 2024, and towards the upper part of the tower, there is an open section which looks almost as if the tower is still being built, however it is this open section of the tower which was the reason why the tower was built.

I took the following photo in 1980 of the Champion pub, at the junction of Eastcastle Street and Wells Street, with the Post Office Tower in the background, and at time of the photo, there were some strangely shaped objects fitted to this open section:

Post Office Tower

The following photo of the top section of the tower shows the upper part where the kitchen, cocktail bar, revolving restaurant and public observation floors were originally located. Below these floors is the open section with the round, concrete core of the building at the centre:

Post Office Tower

View from close to the base of the Post Office Tower:

Post Office Tower

I have one of the wonderful large (A0 I think) posters produced by the General Post Office (GPO), after the opening of the building. The GPO was the combination of what is now BT, the Post Office and Royal Mail, and was then a state run organisation before being broken up and privatised.

The poster shows in detail the functions of the Post Office Tower:

Post Office Tower

The poster records that “the Tower is 620 feet high, and weighs 13,000 tons. It is constructed of concrete reinforced with high tensile and mild steel and has no less than 50,000 square feet of glass on its outside covering. It will withstand high winds with the minimum of deflection – so as not to upset the alignment of the radio beams. Gusts of 90 mph are estimated to induce a deflection of only 15 inches at the very top of the Tower!”.

It was built between 1961 and 1965 and was designed by the Ministry of Public Building and Works Architect’s Department with Eric Bedford as the Chief Architect and G.R. Yeats as the Senior Architect in Charge.

The core of the tower is a reinforced concrete cylinder with a height of 582 feet. Not that obvious when looking at the Post Office Tower, however this concrete cylinder does taper, starting at 35 feet in diameter with two foot thick walls at the base, tapering to 22 feet in diameter and one foot thick walls at the top of the tower. This taper means that the lower floors are smaller than the upper floors.

This tapering of the central core is not that visible from outside the tower, but look at the poster above and the difference in the size of the core is very obvious between the lower and upper parts.

Reinforced concrete floors surround the concrete cylinder, with seventeen floors of equipment rooms and offices below the level where the radio antennas were mounted.

Working down from the top of the Tower, there was a storm warning radar mounted at the very top of the Tower, below which there was a circular room where lift and ventilating equipment was housed, along with water tanks. Below this was the kitchen, cocktail bar, revolving restaurant and public observation floors:

Post Office Tower Restaurant

The restaurant was appropriately named as the “Top of the Tower” and was opened on the 19th of May 1966 by the Postmaster General, Anthony Wedgwood Benn, and Sir Billy Butlin, as the Butlin Organisation were the operators of the restaurant.

It was Britain’s first revolving restaurant, with the arrows in the above image showing the direction of travel, with one revolution taking 25 minutes.

The restaurant and viewing area were a huge success with over one million visitors in the first year of operation. The intention of the GPO was that entry fees to the Tower would help cover some of the costs of the building.

Public access came to an end after a bomb exploded in the men’s toilets in the restaurant on the 31st October of 1971. There was limited public access until 1981, but after that, the floors at the top of the Tower were used for invited meetings, presentations, charity events etc.

We then come to the section of the tower which is the reason for the Post Office Tower’s existence, height and shape. This is where the radio antennas were mounted:

Microwave Radio Network

In the post war period, the amount of telephone use was growing rapidly, and this was joined by the growth of television, services which both required a method of transmitting telephone calls and television signals across the country.

This had traditionally been achieved by copper cables running the length of the country, and connecting key cities from where further networks of cables ran out eventually reaching individual homes and telephones.

TV signals were distributed between outside events, studios and transmitter sites.

The copper cable network was not a cost effective or technical means of supporting this rapid growth through the 1960s and 1970s, so a new network was designed whereby both telephone calls and TV transmissions would be carried across the country using microwave radio signals – linking up key locations where signals would then be converted back from microwave radio signal to electrical signal for local transmission via copper cable.

The key problem with microwave radio is that the signal is line of sight. The sending antenna needs to see the receiving antenna, so to send a signal between geographically spread locations, antennas had to be mounted on high towers, capable of seeing their adjoining towers without any obstructions in-between – hence the height of the Post Office Tower.

This diagram from the above poster shows graphically how this worked:

Microwave Radio Network

For the Post Office Tower, the height of the antenna platforms was dictated by the height needed to “see” a surrounding network of towers, and the space where they were mounted was circular to give maximum flexibility for moving and pointing antennas in any direction, as well as the space to add additional antennas, as and when needed.

This circular shape was then mirrored across the whole of the tower, and it was a shape that also resulted in minimum wind resistance. The tower needed to be stable, as a small change could mean that the microwave radio beam between the Post Office Tower and an adjacent tower would become out of alignment.

To support this new, cross country communications system, a network of towers sprang up across the country.

But the towers had another, more secretive purpose.

I have a copy of The Sunday Times Magazine published on the 28th of January 1973, and in the issue there is an article titled “The National Guard”, by Peter Laurie and developed from his book “Beneath the City Streets”.

The article explored what else the towers supported, in addition to telephone and television signals.

At the time of the Post Office Tower’s construction, the Cold War was in full flow between the West and Russia. The risk of a nuclear war was all to real, and the Cuban Missile Crisis took place in October 1962, whilst the tower was being built.

There were a number of radio networks across the country, as well as telephone and television, the Gas and Electricity boards had a network to control their nations grids, there was a network for Civil Air Traffic Control, and a separate network for the United States Air force for their fighter and bomber control.

Peter Laurie’s article explained that the towers also included a network to “safeguard vital national communications in the interests of defence” – which seemed to include both air defence warning and control systems against an attack by Russian nuclear bombers, and to provide Government communications to dispersed underground national and regional seats of Government across the country.

The Sunday Time Magazine article included a collection of photos of towers across the country, of which the Post office Tower was part:

Microwave Radio Network

You can still see how the network works today. If you go to the Sky Garden at 20 Fenchurch Street on a clear day, and look to the east, on the far horizon who can see the ghostly outline of a tower.

This is the tower at Kelvedon Hatch in Essex, and in the above matrix of photos, it is the tower in the top row, second from the left.

My photo shows the tower, just visible on the horizon to the right:

Microwave Radio Network

As can be seen in the above photo, being up a high point in London, enables a line of site to another, distant high point, over which a microwave radio signal could be transmitted.

Other towers surrounding London include a tower near High Wycombe, which is next to the M40 and very visible if you drive along this motorway, along with another tower at Bagshot in Surrey. These are both in the matrix of photos above.

The network extended across the whole country, with each tower serving as a local connection into the network, as well as the relay point to surrounding towers.

In the matrix of photos above, the caption to the Kelvedon Hatch tower states that it was “near a regional seat of government, north of Brentwood”.

This was the underground bunker at Kelvedon Hatch which would have formed a regional seat of Government in the event of nuclear war. I worked in the bunker a couple of times as a Post Office Apprentice in the late 1970s, and wrote about the bunker in this post.

The microwave radio network was a vast improvement in the volume of data that could be transmitted across the country over the previous copper network, however technology does not stand still and during the 1980s and 1990s, a network of fibre optic cables was being laid across the country.

Fibre optic cables were relatively cheap, and small bundles of cables could carry very large volumes of data, considerably more than a microwave radio network, and with the coming of the Internet, data volumes started to increase exponentially, therefore the new fibre optic network started to take over from the microwave radio network.

The last elements of the radio network were switched off between 2006 and 2007, and the radio dishes and horn antennas were removed in 2011 due to concerns regarding their condition and the safety of the surrounding area.

Permission for removal was needed because the tower is Grade II listed, and planning approval was granted by Camden Council. There was a proposal to install dummy dishes to replicate the appearance, however BT rejected this on the grounds of cost.

This is why this section of the tower looks almost as if it is an unfinished part of building works.

Postcard from the 1960s soon after completion of the Post Office Tower showing the horn and dish antennas mounted on the tower, and at the base is the Museum telephone exchange, with the small tower providing some of the local radio links:

Post Office Tower

The Post Office Tower was opened in October 1965, and the following news report is typical of the reporting of the opening of the tower:

“FROM BIG BEN TO BENN’S BIG TOWER – The Post Office Tower symbolises 20th century Britain in much the same way as Big Ben symbolised 19th century Britain, said Postmaster General, Mr. Anthony Wedgwood Benn, today.

Both speak eloquently for the age in which they were built.

He added: Big Ben represents the fussy grandeur of the Gothic revival that epitomised Victorian imperial influence, built on the foundation of the first industrial revolution.

The Post Office Tower, lean, practical and futuristic, symbolises the technical and architectural skill of this new age.

Mr. Wedgewood Benn was speaking at the ceremony at which the Prime Minister, Mr. Harold Wilson, inaugurated the operational working of the Tower.

Mr. Wilson talked over a microwave telephone link from the Tower to the Lord Mayor of Birmingham; and audiences in each city watched the ceremony by means of a closed circuit television link via the Tower.

Mr. Wedgwood Benn continued: This new, bigger Big Ben captures the sprit of our time, and visitors to London will remember it as the dominating feature of our capital city. Significantly, it is a great communications centre, that will allow the vast expansion in telephony, telegraphy, data transmission and the distribution of sound and television programmes, linked to the world satellite system.

He added that there was a great growth in telephone traffic. Trunk calls were increasing at a rate of about 17 per cent a year.”

Birmingham also had its own microwave tower, connected into the national network, and which was 500 feet tall, and cost £3 million to build.

We can now continue down the Post Office Tower, and the poster shows the apparatus rooms on each of the floors, which contained apparatus for telephone and television systems, and any other systems that would have used the microwave radio network:

Post Office Tower

These rooms continued down through all the floors wrapped around the central concrete column:

Post Office Tower

Since its’ completion, the Post Office Tower has been a significant feature on London’s skyline. Apart from Centre Point (which was built over the same period as the Post Office Tower), there are no other tall buildings in the immediate vicinity.

In 1980, I took the following photo from the viewing gallery of the Shell Centre building on the South Bank, showing the Post Office Tower:

Post Office Tower

This photo was from a few years ago, taken from St. Paul’s Cathedral:

Post Office Tower

And this is from the viewing galleries of the Shard, where unusually, you are looking down on the Post Office Tower:

Post Office Tower

One question about the tower I have not answered is why it is located where it is in London?

The answer comes from London’s historic distribution of telephone exchanges, as the site of the tower was the site of the Museum Telephone Exchange.

Prior to the all number system of telephone numbers we use today, London’s telephone system used a combination of three letters and four numbers. This was called the Director system and used due to the large number of telephone exchanges in London, with three letters identifying each exchange, so if you had a telephone connected to the Museum Exchange, your number would be of the format MUS 1234 (this was when telephone dials had letters as well as numbers around the edge of the dial).

The Museum Telephone Exchange was already a hub for London’s telecommunications network, including audio and video circuits, and the Museum exchange included a link to the BBC’s Broadcasting House, so it was the logical site for a tower that would network and connect London with the rest of the country.

Before the Post Office Tower, the Museum Telephone Exchange already had small mast on the roof, and a name used in the early days of planning for the Post Office Tower was the Museum Exchange Tower.

After construction had been completed, Peter Lind, the company responsible for construction, had large adverts in many newspapers advertising that they had constructed “Britain’s Tallest Building” and although calling it the G.P.O. Tower in the headline, in the text under a photo of the tower it was called the “Museum Telephone Exchange and Radio Tower”.

The tower is still surrounded at its base by a number of BT buildings which have long been used for telecommunications equipment. Whether any or all of these are included in the sale of the Post Office Tower is not clear.

Whilst the tower is listed, the surrounding buildings at the base are not, so it will be interesting to see what happens to these in the coming years:

Post Office Tower

The above photo shows the view along Cleveland Street with BT buildings on the right, and in the following photo are more BT buildings at the junction of Cleveland Street and Maple Street:

Post Office Tower

Whilst we can see the majority of the Post Office Tower from the surrounding streets, there is one really interesting part of the structure that can only be seen from one side street

Walk down Cleveland Mews, and this is the view:

Post Office Tower

As mentioned earlier, the tower needs to be as stable as possible so the microwave radio beams could maintain their alignment with distant masts. To help provide this stability, towards the base of the tower there was a “collar” which extended from the ground level buildings around the central concrete column. As well as providing stability, the collar also provided access to the tower:

Post Office Tower

The collar can be seen in this extract from the poster, where it is described as a connecting bridge and brace for the tower:

Post Office Tower

in the above image, we can also see the concrete conical pyramid on which the tower was built, and which helped spread the load over the concrete foundations below.

The foundations of the tower below the conical pyramid consisted of a large layer of reinforced concrete, below this was a layer of oil which formed an anti-friction gasket, below which was a thin layer of concrete, and then natural ground.

Looking up at the Post Office Tower from Cleveland Mews, and we can see the central concrete column at its widest diameter, then the collar / brace, and then the tower rising above London.

Post Office Tower

The Post Office Tower is a remarkable bit of engineering and construction, all to raise a set of antennas to a sufficient height so that they could communicate with a network of relay towers in the counties surrounding London.

The Post Office Tower seen from Fitzroy Square:

Post Office Tower

Many historic landmarks have a local pub named after them, and the Post Office Tower is no different as at the junction of Cleveland Street and Clipstone Street, is:

The Tower Tavern

Tower Tavern

The Tower Tavern is not exactly the most attractive pub in London, and the style of the building probably comes from the period when it was built, as the pub dates from around 1970:

Tower Tavern

It was built following the demolition of an adjacent pub (the subject of a future post about the area), and was a pub frequented by Post Office / BT workers as well as those who lived and worked in the area, and despite its outward appearance was a perfectly decent pub.

Soon after opening, the Tower Tavern was regularly advertising in the papers that you should “Make a date to meet at The Tower – a fine Bass Charrington House”, and in 1971 it claimed to have a model of an original telephone box in the pub.

In 1993 the Tower Tavern was advertising that you could buy:

  • Carling Black Label 80p per pint
  • Tennents Pilsner 80p per pint
  • Tennents Extra 95p per pint
  • Bitters £1.20 per pint
  • Double Spirits £1.50
  • Indian curries and rice £3.00

The Tower Tavern closed in 2021, possibly due to the impact of COVID / rent increases etc. The pub is owned by the University of Westminster who also have the buildings that surround the pub.

The pub has a lovely sign, with a rather dramatic painting of the Post Office Tower with its full compliment of microwave radio dishes and horns across the upper levels:

Tower Tavern

The Tower Tavern pub sign with the real Post Office Tower behind:

Tower Tavern

I do not know what plans the University of Westminster has for the old Tower Tavern, but I would be surprised if it opens again as a pub. I hope the pub sign is saved though, and put on public display as a reminder of the Post Office Tower’s history.

The Post Office Tower in Film

As you would expect, the Post Office Tower features in numerous films, TV reports etc. Below are a selection that provide an overview of the tower’s design, construction, purpose and use, visiting the tower, the restaurant, and how the tower often appeared in popular culture.

If you receive this post via email, and the embedded videos do not appear, click here to view the post on the website to see the films.

The Post Office Tower of London

This 19 minute film has some wonderful aerial shots of London, covers the purpose, design and construction of the tower, with some good technical detail, along with visiting the tower and the restaurant:

Top Of The Tower

This 2 minute video again has some wonderful views of London from above, and within the Post Office Tower, the film focuses on the restaurant at the top of the tower:

Look At Life – Eating High

This film includes an overview of other restaurants at the top of tall structures as well as a detailed look at the Post Office Tower restaurant.

The film also includes the mechanism that rotated the restaurant, and shows how remarkably simple this was:

GPO Tower Construction

This silent film shows views from the tower, as well as construction of the tower. If you work in construction health & safety, then best not to watch:

The Goodies

And finally, the Post Office Tower frequently appeared in popular culture, one example was when it was demolished by a giant kitten in an episode of the Goodies:

The Post Office Tower is an iconic London landmark and when you look at the tower, you are looking at something built to serve the explosion of telephone calls, television distribution, and data from the late 1950s and through the 1960s.

You are also looking at something where the design, height and shape was dictated by the leading edge telecommunications technology of the early 1960s.

You are looking at a building in a specific location that was dictated by how the telephone network had developed across London, and where a key telephone exchange was located, and it was part of a network of towers that spanned the country, and linked to Europe via a microwave radio link across the Channel, and the rest of the World via the Goonhilly satellite station in Cornwall.

And it also had a resturant.

Whatever happens to the tower in the future, I hope that some of this heritage survives.

alondoninheritance.com

The Prospect of Whitby and Pelican Stairs

For today’s post, I have another of my father’s photos, taken on a boat trip along the River Thames in August 1948, this time looking across to Wapping, the Prospect of Whitby and Pelican Stairs:

Prospect of Whitby

The same view in 2024, some 76 years later:

Prospect of Whitby

The 1948 photo shows an area just three years after the end of the war, and the bombing that badly damaged the whole area of the docks. It was a dirty, industrial place, still important in supporting the trade of London and the country, with imports and exports through the docks.

Only a few buildings have survived the intervening 76 years. The Prospect of Whitby pub, today a brightly painted white building along the river. The brick building behind, the steeple of the church of St. Paul’s, Shadwell, and on the left edge of both photos is a warehouse (1948) now converted to flats.

The following extract from the 1949 edition of the OS map shows the area along the Thames featured in the photo, as well as the area behind  (‘Reproduced with the permission of the National Library of Scotland“):

Pelican Stairs

The Prospect of Whitby can be seen roughly in the middle of the map, and to the left of the pub is Pelican Stairs and Pelican Wharf. Just to the left of the P in Pelican is a square which marks the position of the chimney seen in the photo.

An extract from the photo provides a closer look at the Prospect of Whitby and surrounding buildings:

Pelican Stairs

On the left is Pelican Wharf, then the Prospect of Whitby, with Pelican Stairs descending immediately to the left of the pub, then in the background, the large brick building of the London Hydraulic Power Company.

The same view today:

Pelican Stairs

A new apartment building has been built over Pelican Wharf. The first mention I can find of Pelican Wharf dates from December 1866, when the wharf was mentioned in an article about a collision in the river opposite the wharf.

Many of the apartment buildings in my 2024 photo were part of the late 1980s development of the area, and there is an article in the Brentwood Gazette from the 22nd of April, 1988 which mentions Pelican Wharf, and provides a reminder of the transformation of the 1980s:

“Six months after Black Monday the Docklands property market is experiencing a ‘new realism’, says Stephen Miles-Brown of estate agents Knight Frank & Rutley.

The Essex bookmakers and the South London car dealers – the ‘Top Gun’ speculators of yesteryear – have all but disappeared, says Mr. Miles-Brown. In their place has come the traditional buyer with a mortgage, a career and even a few children.

Docklands developers are in the middle of the strongest buyer’s market for years. They have responded quickly and imaginatively. Immediately post Black Monday, there were incentive schemes, buy-backs, chain breaking and mortgage discounts, now the latest and perhaps best news of all is the return to good old fashioned ‘value for money’, a code word for keen prices, more space and upgraded specifications.

These developments with a large degree of space and higher specifications are far removed from some of the earlier ‘little boxes’ and are to be found throughout Docklands in such places as Timber Wharf on the Isle f Dogs, Greenland Passage in the Surrey Docks, Lime Kiln Wharf and Duke Shore Wharf in Limehouse, Pelican Wharf and Eagle Wharf in Wapping and Millers Wharf by St. Katherine Docks.

April marks the start of the 1988 ‘Docklands Season’ with no less than 10 major residential developments coming forward over the next few weeks.

They offer the choice of over 500 new homes, from first-time buyer studios at under £100,000 to – only for the seriously rich – 3,000 sq. ft. penthouses at £1.5 million !”

The later half of the 1980s and into the 1990s really was a development rush along the banks of the Thames, and although the article described the situation as a buyers market, prices for river facing properties in the 1980s were expensive. A first time buyer’s studio for under £100,000 may seem really cheap today, but in 1988 this was expensive.

In the above 1948 and 2024 photos showing the Prospect of Whitby, a set of stairs can be seen running down to the foreshore to the left of the pub. These are Pelican Stairs.

Pelcian Stairs are listed in the Port of London Authority listing of access points to the Thames as being in use in 1708, and they are certainly old stairs. Their location next to a pub is typical of many of the stairs in Wapping, as many users of the stairs, whether arriving back, or waiting to leave via the stairs, would have headed to the pub, and the combination of stairs and pubs were centres of local activity.

The Prospect of Whitby was originally called The Pelican, but it is not clear where the name was used first, either the stairs or the pub.

The PLA listing (published around 1995) recorded that the stairs then had “Steps missing dangerous, derelict”.

As can be seen today, the stairs are now very much in use:

Pelican Stairs

The first written reference to Pelican Stairs I could find was from the 30th of August, 1746, when the Kentish Messenger reported that “On Tuesday Evening, a Fire broke out in the House of Mr. Pelham, near Pelican Stairs in Wapping, occasioned by a quantity of Okum taking Fire; which burnt with such Violence, that the same, and the House of Mr. Beane, a Distiller and Grocer, were consumed, with their Stocks in Trade, which amounted to several hundred Pounds; two other Houses, both inhabited, and other small tenements were much damaged.”

It is remarkable the number of fires that occurred, but perhaps not surprising when you consider that there were many houses, warehouses and factories where highly inflammable goods were stored, and where both building and working practices lacked the approaches needed to prevent the start and spread of fires.

The entrance alley to Pelican Stairs alongside the Prospect of Whitby:

Pelican Stairs

The large brick building behind the Prospect of Whitby can be seen in both 1948 and 2024 photos. This was the Wapping pumping station of the London Hydraulic Power Company.

The London Hydraulic Power Company (LHPC) was formed in 1884 by Act of Parliament, although the provision of hydraulic power by the company had started in the previous years with a station at Bankside, as the Wharves & Warehouses Steam Power & Hydraulic Pressure Company.

The aim of the company was to provide hydraulic power (water under pressure), across London, and the docks were a major consumers of this form as power, as there were numerous cranes, lifts, swing bridges, dock gates, windlass etc. which needed a reliable source of power to operate.

The LHPC established a network of pipes across London, interconnecting their pumping stations and their consumers – much like the electricity network of today – and as well as the London Docks, the company provided power to the numerous, power hungry industries and businesses across London, even extending to the raising and lowering of theatre safety curtains in the West End.

The Wapping pumping station was built between 1889 and 1892.

The station was equipped with up to six steam engines which used coal delivered via the adjacent Shadwell Basin, and took water from boreholes below the station and from the water in Shadwell Basin.

The large brick building we can see in the photos was were the accumulator tanks were located. These held water at pressure, so the hydraulic pressure across the distribution system could be delivered at a constant pressure, and the London system was at a pressure of 750 psi (pounds per square inch).

The Wapping station transitioned to electric pumping rather than steam and coal due to the Clean Air Act which had been brought into force due to the smog’s of the 1950s.

Remarkably, the Wapping station did not close until 1977, as hydraulic power was still being used, however by the 1970s, the reduction in the use of the London docks, and the transition to electric power for remaining uses of hydraulic power resulted in the closure of the station, and the network used to deliver the hydraulic power delivered by these stations.

With the 1980s liberalisation of telecommunications, and the forming of Mercury Communication as a competitor to BT, Mercury purchased the pipe network of the London Hydraulic Company to use as a ready made distribution network for their cables.

Although Mercury as a brand name disappeared in 1997, the pipes continued to be used by Cable & Wireless, and they still carry fibre optic cables today, so rather than distributing hydraulic power, the pipes are distributing voice and data across London.

The Wapping pumping station has had a number of temporary uses since closure, including activities such as an art gallery and café / restaurant, and there have been proposals for long term use, but as far as I know at the moment, there are no firm plans for the building.

Looking at another part of my father’s photo, and there was a bit of a mystery, but which shows how features remain hidden and then are revealed.

The following photo shows the area to the right of the Prospect of Whitby in my father’s 1948 photo:

Shadwell Basin

And this is the same view today:

Shadwell Basin

The 1949 OS map shows this section of the photo, as shown in the extract above, and the black cars parked in a line (possibly awaiting loading on a ship for export), are parked where the words “Mooring Posts” can be seen  (‘Reproduced with the permission of the National Library of Scotland“):

Shadwell Basin

The map also shows the low warehouse behind the cars and what also likes rather like a domestic house to the left of the photo.

The mystery is that in 1949 photo and map, at the side of the river there is a continuous and straight line of wooden posts forming the edge of the land, however if you look at my 2024 photo, today the wall along the foreshore is curved, and to the right there is a solid, curved, concrete wall.

If we go back to the 1897 OS map, we can see a very different place  (‘Reproduced with the permission of the National Library of Scotland“):

Shadwell Basin

We can still see the main entrance between the Thames and Shadwell Basin at the upper part of the map, but in 1897, below the main entrance, was “Shadwell Old Entrance”.

The London Docks were a continuous building site, and in Shadwell, the “Shadwell Old Basin” and the “Shadwell Old Entrance” were the first part of the docks to be built in Shadwell.

The success of these docks was such, that they were soon expanded and the much larger Shadwell Basin was built, just north of the Old Basin, which was included within the overall Shadwell Basin.

The old entrance would then be closed off, with the single main entrance shown in the 1949 map remaining as the eastern entrance to Shadwell and the London Docks complex.

I assume that the the original entrance was built over, probably not completely removing and filling in the entrance, rather building over it to complete the view we see in the 1948 photo and 1949 map.

When the area was redeveloped in the 1980s and 90s, this structure was then removed, and the curved concrete wall built across what remained of the Shadwell Old Basin entrance.

It is fascinating how across London, the evidence of former land use, industries etc. have survived and can still be seen today.

To see the street side of the Prospect of Whitby and the lifting bridge over the Shadwell Basin entrance, see this post from 2016, where I explored my father’s photo taken in Glamis Road.

alondoninheritance.com

Iron Gate Stairs

Underneath the northern tower of Tower Bridge, there is a late 19th century version of one of the old Thames Stairs, which has a name that refers to one of the gates that controlled access into the Tower of London. This is Iron Gate Stairs.

The stairs are shown before Tower Bridge was built in this extract from Langley and Belch’s, 1812 New Map of London (underlined in red):

Iron Gate Stairs

Today, Iron Gate Stairs are reached via a tunnel which runs through the northern tower of the bridge, and comes out to a well maintained set of stone stairs:

Iron Gate Stairs

As far as I can confirm, by checking and aligning a number of maps, the stairs today appear to be in the same location as the stairs shown in the 1812 map.

It shows the importance of these access points to the river, that they were included in the design of Tower Bridge, and it must have cost more, and been more complex, to route the access to the stairs through the tower, rather than relocate them to one of the sides of the northern tower of the bridge.

The Port of London book “Access to the River Thames, a Port of London Guide”. includes these stairs in the listing of all points of access to the river along the tidal Thames, and the PLA record for Iron Gate Stairs reads:

  • Stairs and Causeway
  • Constructed of Stone
  • A landing place in 1708 and 1977 and in use at the time of the book (around 1995)
  • Structure is listed
  • The stairs are gated
  • Bathing from these stairs is extremely dangerous

I cannot find a separate listing for the stairs on the Historic England website, so I assume that the stairs are included within the overall Grade I listing of Tower Bridge, as the access to the stairs is part of the structure of the bridge.

The name of the stairs is interesting, and it appears to refer to a gate that once controlled access to the south east corner of the area between the walls of the tower and the river.

In this 1852 plan of the Tower of London, there are a cluster of buildings in the lower south east corner, with a black line, indicating some form of gate, controlling access (red arrow):

Tower of London

 © The Trustees of the British Museum Creative Commons Attribution-NonCommercial-ShareAlike 4.0 International (CC BY-NC-SA 4.0)

Although not named, the stairs can be seen running down to the river, next to the gate.

After the construction of Tower Bridge, the name Iron Gate is retained, and although the stairs do not appear to be named (perhaps because they are under the bridge), iron Gate is used next to the tunnel underneath the approach to Tower Bridge, where today you can walk from the St Katherine Dock area, to the area between the Tower of London and the river.

In the following extract from the 1897 OS map, Iron Gate is shown just to the east of the bridge  (‘Reproduced with the permission of the National Library of Scotland“):

Iron Gate Stairs

And in the 1951 revision, the name is still in use, but on the western side of the bridge (not also the name Irongate Wharf in use in both maps)  (‘Reproduced with the permission of the National Library of Scotland“):

Iron Gate Stairs

So Iron Gate in the OS maps seems to continue to refer to a gate across this access through the wall created by the approach road to Tower Bridge.

As with all Thames stairs, there are references to the stairs in multiple newspaper reports over the centuries. For example, the following is from the Public Ledger and Daily Advert on the 9th of October, 1826, and unfortunately it does not record what Samuel Pearce did, which required such a public apology:

“CAUTION TO WATERMEN – I Samuel Pearce, Waterman, plying at Iron Gate Stairs, near the Tower, beg publicly to acknowledge and express my grateful feeling to John Morrison, Esq. for foregoing a prosecution against me, which I well merited, in consequence of an unprovoked and unwarrantable outrage committed on him on Friday evening; for which I cheerfully make this public apology, which he accepts, in consequence of the distressed state of my wife and infant family.”

Iron Gate Stairs were also the boarding point if you wanted to travel to “Harwich, Yarmouth and Places Adjacent”, as the 80 horse-power Steam Packet Swift sailed from the stairs on Sundays and Thursdays in the 1820s.

Indeed, Iron Gate Stairs feature in papers across the 18th and 19th centuries with all the usual stories of activities that happened at these places which formed a key access point between the land and the river.

As with other stairs, Iron Gate Stairs was a place where bodies recovered from the river were brought up to land.

The Historic England Monument Record for the Iron Gate refers to it being a gate tower constructed during the reign of Edward III (who reigned between 1327 and 1377), and that it was built to strengthen the defences of the Tower on the southern side of the complex, and that it commanded a “walled causeway through to the Develin Tower at the south east corner of the outer wall.

Stow in the early 17th century refers to the Iron Gate as being great and strong but not often opened”.

The Iron Gate was demolished in 1680 following a review of the Tower’s defences, and whilst looking for space to expand accommodation.

So whilst the gate tower was demolished, as shown in the 1852 map, a gate seems to have remained in place, although rather than the gate tower, just a standard gate.

After demolition, there also appears to have been a cluster of buildings around the location of the gate which seem to have been used for accommodation, storage and small industrial activity.

Construction of Tower Bridge cleared these buildings, and today we can see the area where the Iron Gate was located when looking towards the bridge, from the west:

Tower of London

And with some lovely historical continuity, the area of the Iron Gate is still gated, with a gatehouse and barrier across the road:

Tower of London

And looking through the walkway under the approach road to Tower Bridge, we can see gates part open across the walkway, as well as much larger and stronger gates set against the sides of the walkway:

Tower of London

In the following photo, the entrance to the walkway tunnel under the approach road is on the right, and the arch on the left provides access to the entrance to Iron Gate Stairs:

Iron Gate Stairs

Which, as the PLA description of the stairs records, is gated:

Iron Gate Stairs

Through the gate, and we can see the railings around the top of the stairs. The surrounding walls are covered in the white tiles that are common to the majority of the places where you can walk under the bridge:

Iron Gate Stairs

View of how the tunnel exits the base of the northern tower of Tower Bridge, and the steps leading down:

Iron Gate Stairs

As the PLA document records, a causeway is part of Iron Gate Stairs, and for the stairs this is one of the largest causeways to be seen. It covers a large space at the base of the stairs, both in terms of width and length into the river:

Iron Gate Stairs

The stairs are part of the construction of Tower Bridge, and I assume that the causeway may well date from the same time (assuming it has been continuously repaired). I doubt whether the stairs would have had a causeway of such size prior to the bridge being built.

The need for a bridge at or around the location of Tower Bridge had been a pressing issue for many years prior to the construction of the bridge. In the later half of the 19th century, there was so much cross river traffic that an urgent solution was needed.

In 1884, the Southwark recorder and Bermondsey and Rotherhithe Advertiser was reporting that “The Corporation also propose to establish a steam ferry across the river, from Iron Gate Stairs, Little Tower Hill, to Horselydown Old Stairs, near Horselydown Lane. Another scheme for crossing the Thames is proposed by the Tower (Duplex) Bridge Bill. The structure would cross the river from Hartley’s Wharf, Horselydown, to Little Tower Hill, having in the centre of the river two loop bridges.”

The following year, the Eastern Argus and Borough of Hackney Times, was reporting about the construction of the new bridge, and that “the work will be done by the City Corporation which has set down five years as the period for completing it. It is to be formed from a point westwards of and near the Iron Gate Stairs to Hartley’s Wharf. The cost will be £750,000, and the structure will be of such a character as to admit of the passage at all times of the tide of vessels navigating the river. The bridge will be a great convenience to East London”.

The above report does call into question whether the current stairs were built on the site of the original Iron Gate Stairs, as the article states that the new bridge is to be built “westwards of and near the Iron Gate Stairs”.

A later article in June 1886 does though seem to confirm that the northern tower, and the stairs we see today are on the site of the original stairs, as when describing the works for the new bridge, the article states “On the north side, as already stated, it touches the shore at Irongate Stairs, from which a road will lead directly up to the Minories”.

In 1889, Watermen were complaining about the disruption to their trade “THE TOWER BRIDGE AND THE LONDON WATERMEN – The Select Committee of the House of Lords appointed to considered the Tower Bridge Bill proceeded to-day to hear the evidence of numerous watermen who claim compensation for disturbance of their occupation between Irongate and Horselydown Stairs in consequence of the construction of the works,. George William Shand was the first claimant”.

I would have thought that the watermen would have been far more concerned about the forthcoming loss of their trade between the two stairs once the new bridge had been opened.

Based on the majority of newspaper reports, aligning maps, and the Port of London Authority listing of Thames Stairs, I am as certain as I can be that the stairs we see today are in the same place as the original Iron Gate Stairs.

The railing by the side of the view over the stairs seem to have acquired evidence of many of the tourist visits to the site:

Tower Bridge

I had a good look around, however I could not find any signs that name iron Gate Stairs.

They are though yet another example of historical continuity, with the stairs being in roughly the same place after the construction of Tower Bridge, and being named after a gate dating back to the 14th century, located where there are still a barrier and gates in position, to close of the south eastern entry to the space between the Tower of London and the River Thames.

alondoninheritance.com