I have two new walk dates available. Click on the links for details and booking:
- The South Bank – Marsh, Industry, Culture and the Festival of Britain on Saturday the 20th of July
- The Lost Streets of the Barbican on Sunday the 21st of July
If you have been reading the blog for a while, you will know that I am fascinated by London maps, and make use of a number of maps in many of my posts.
They can help us understand the development of London in many different ways. They are a snapshot of the city at the time they were made, showing the limits of development at a specific time. They record change, and they show features of the city, man-made and natural, that have long since disappeared under the built city we see today.
They can show different interpretations of the city, they can show how people at the time the map was made interpreted the city, what was important to them.
There are some brilliant online mapping sites, such as the National Library of Scotland and Layers of London, however nothing beats the feel of a paper map in your hands.
Many of these maps can be found in books. Large, fold out maps, or even better, a pocket at the end of the book stuffed with a number of maps. You do not find this with the majority of books published today, probably down to cost, however it was once a more common feature, and for today’s post, I have a small sample.
At the start of the 20th century, Sir Walter Besant published a series of books on the history of London, and a number of these included maps.
(You should be able to click on the maps to open a larger image)
In “London In The Time Of The Tudors” (1904) there is:
A Reproduction of the Map by Ralph Agas, Circa 1560
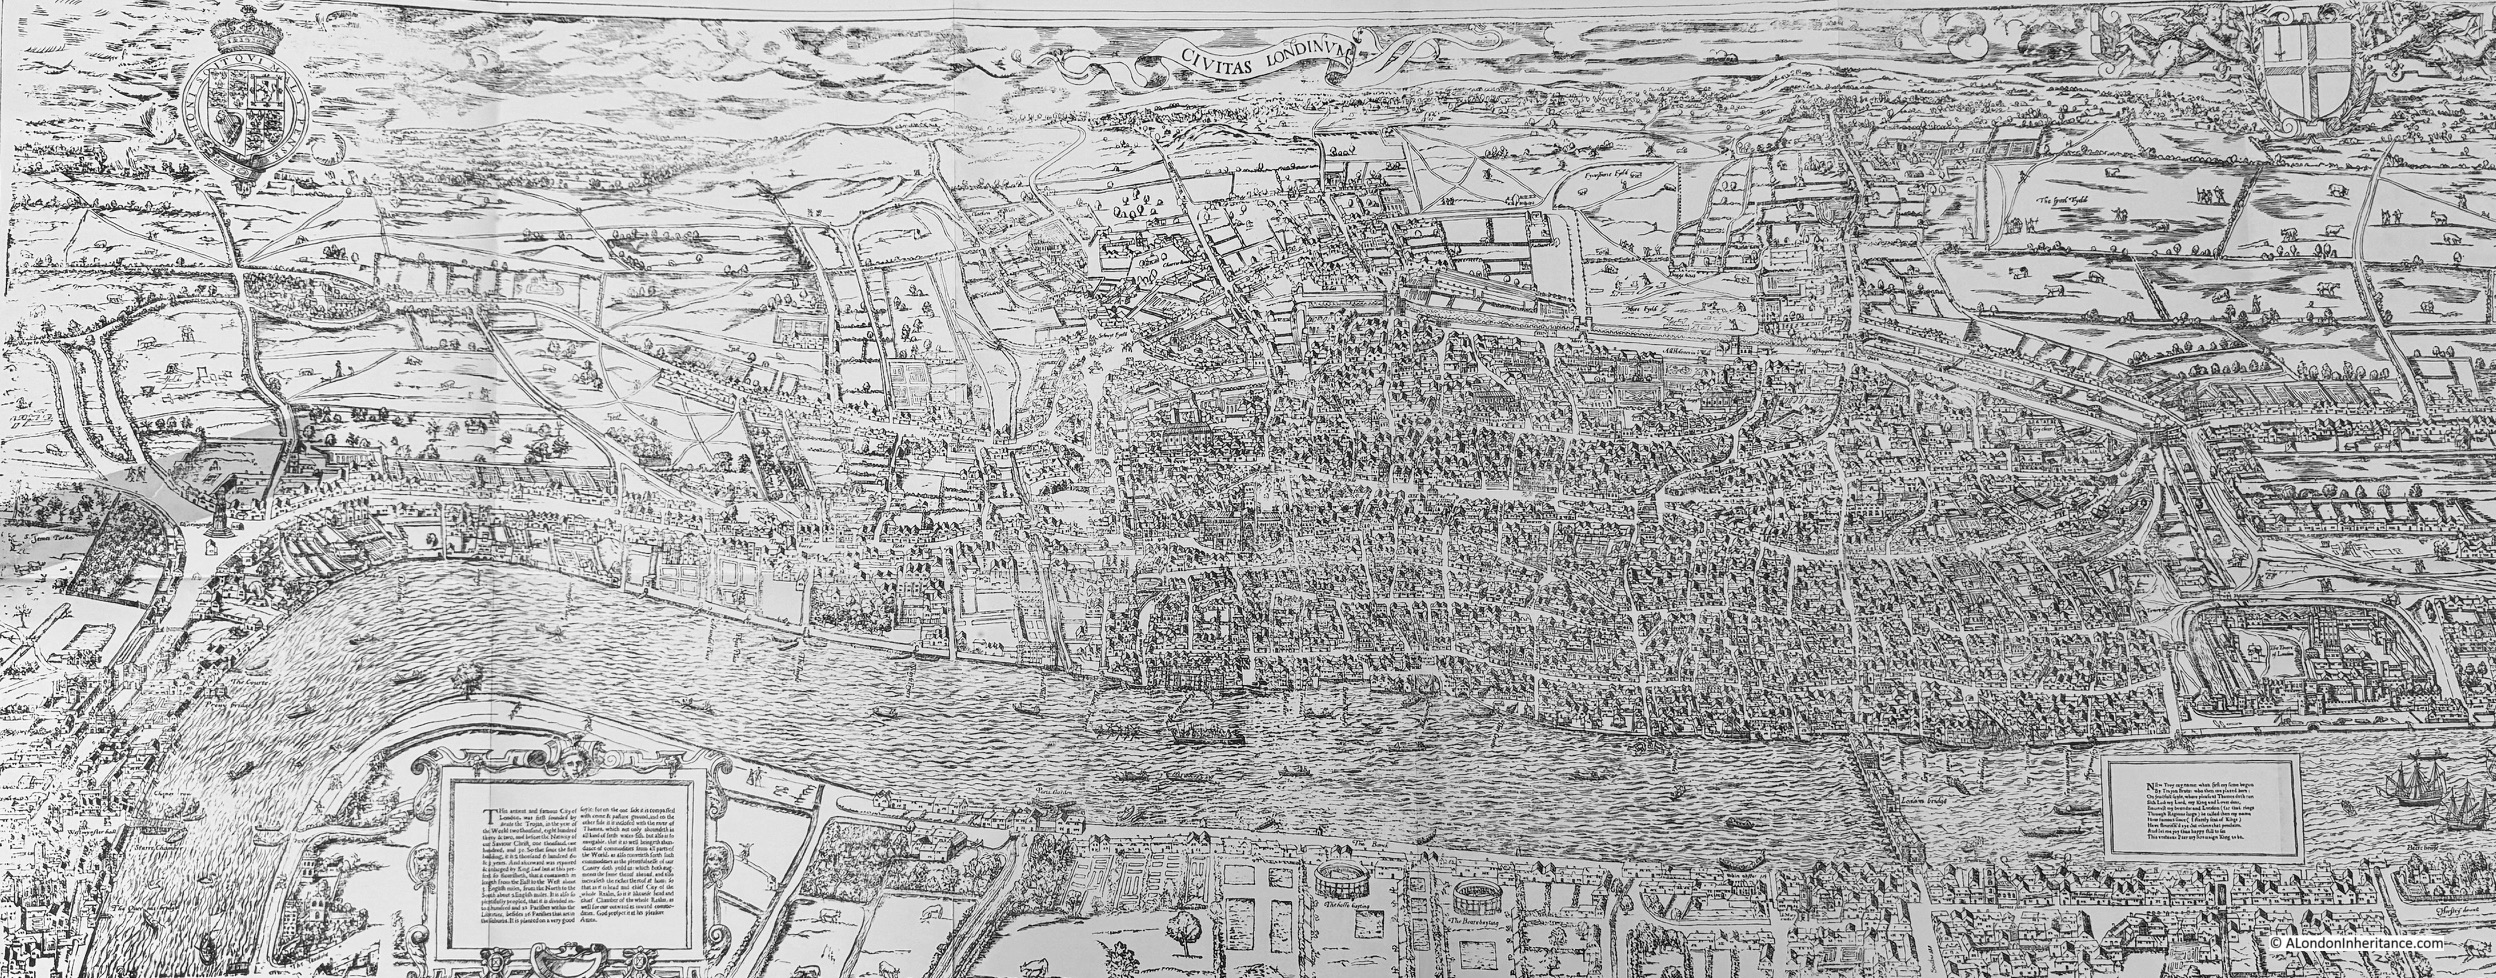
Although the map is known as the Agas map, it appears to be an incorrect attribution. Ralph Agas was a surveyor who lived between 1540 and 1621, however there is no firm evidence that he was the creator of the map, and the coat of arms at the top left of the map is not from the Tudor period, but is the Stuart coat of arms, and the version of the map that survives is believed to date from around 1633.
At the time the map was made, the population of the city was around 350,000, and was still mainly contained within the old City walls, although there were small areas of building outside the walls, for example the route from the City to Westminster can be seen with buildings either side of what is now Fleet Street and the Strand, and the Eleanor Cross can be seen at Charing Cross.
The following extract shows the City of London:

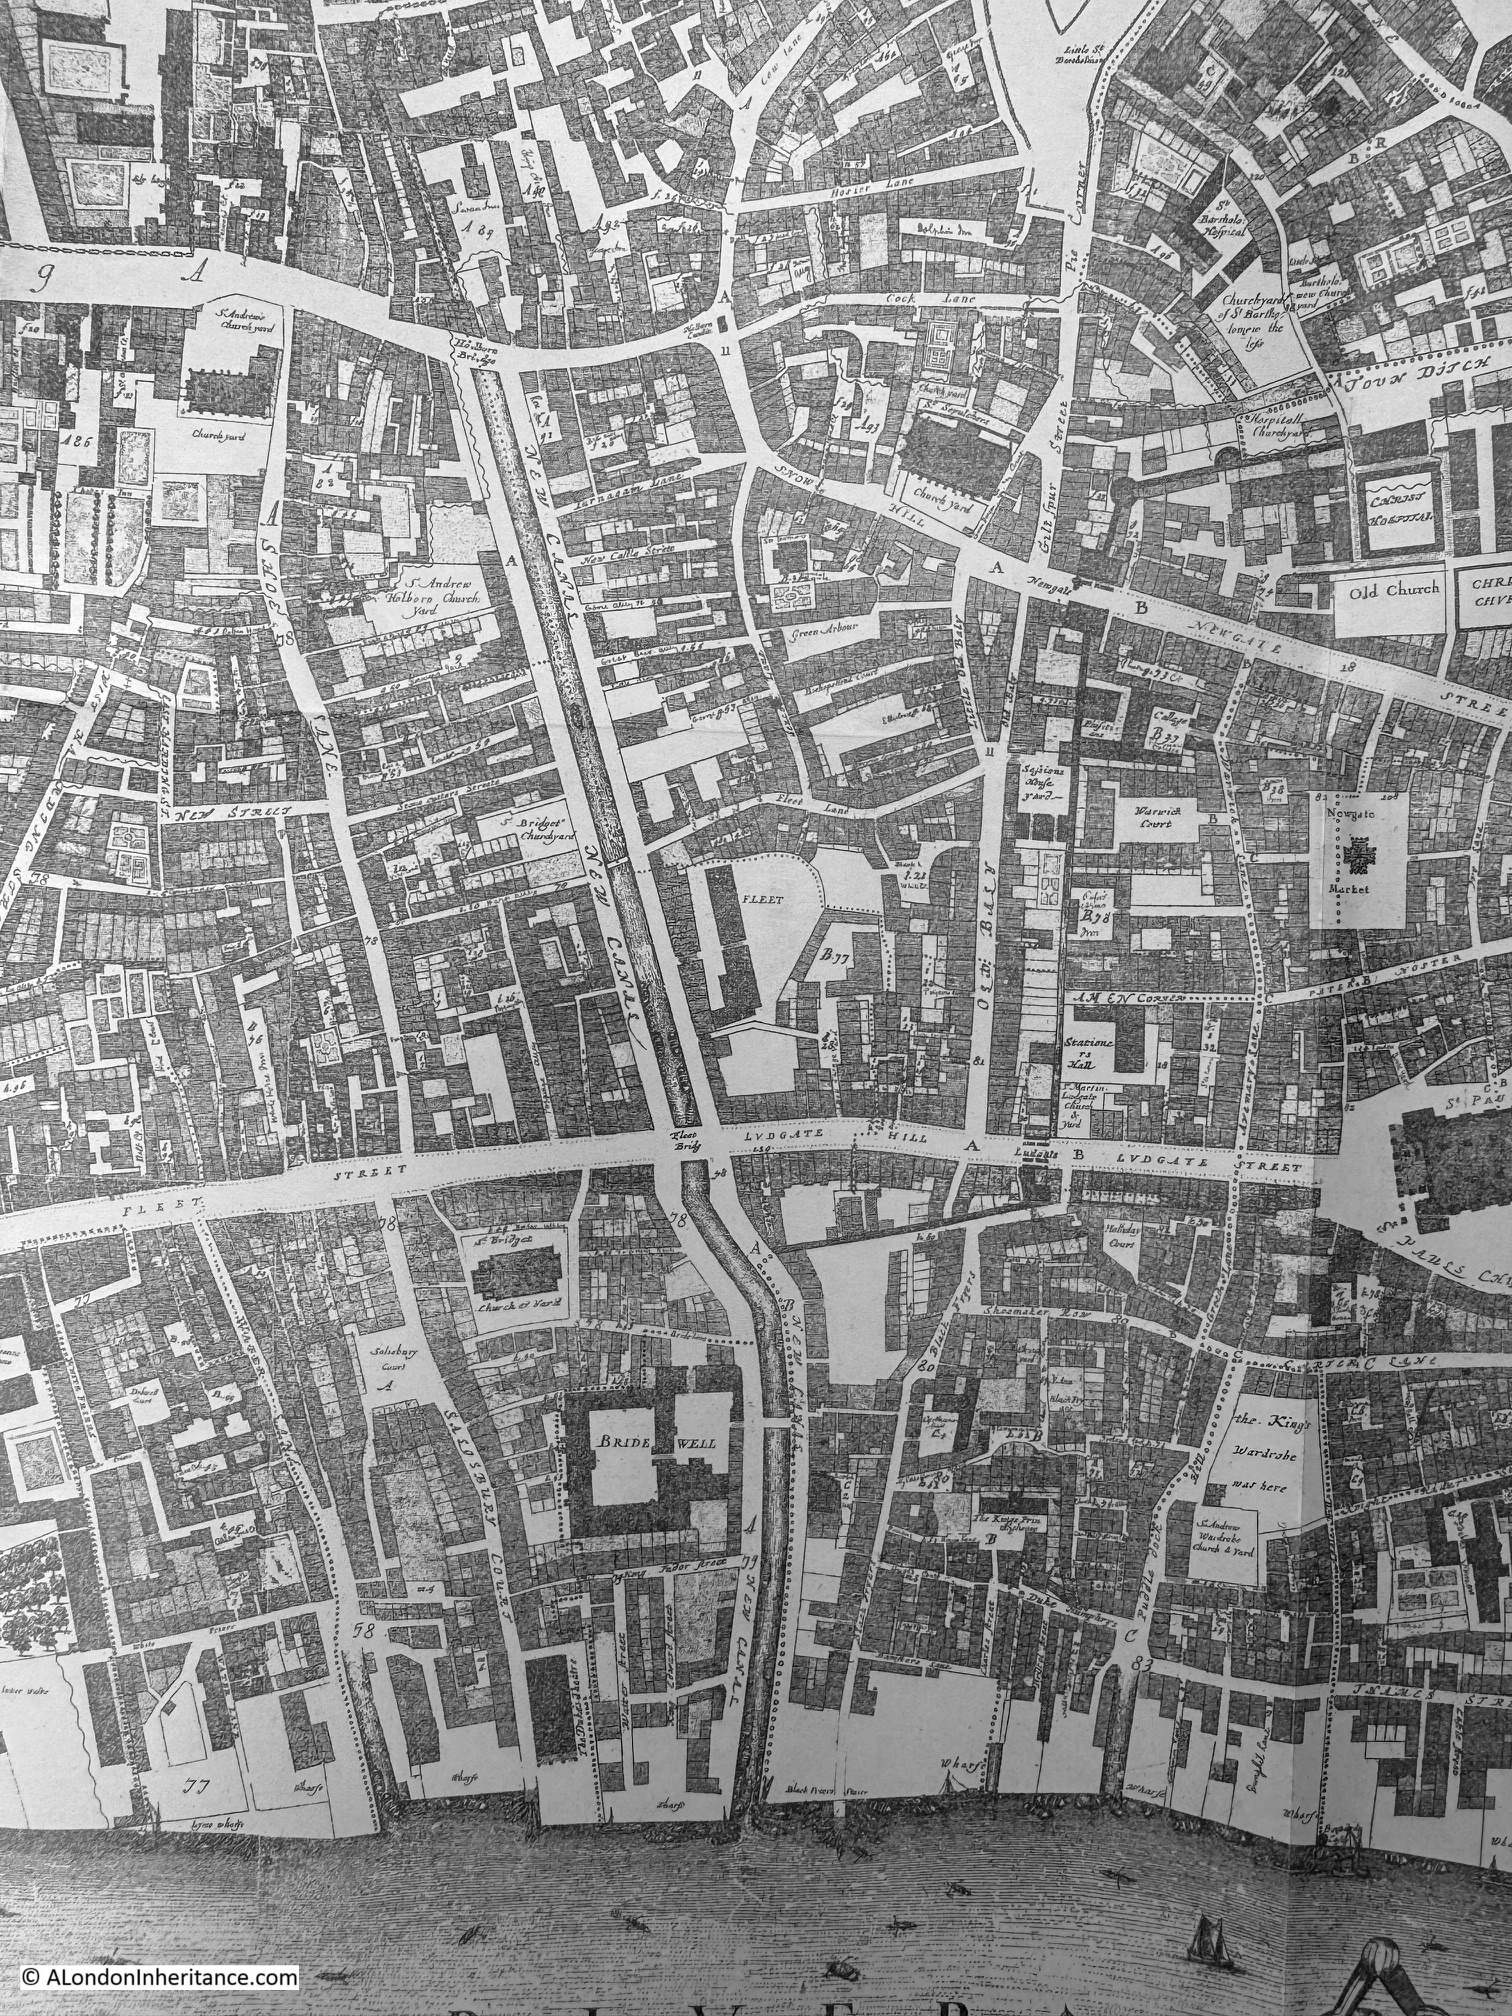
In the following extract, the River Fleet can be seen from the point where it enters the Thames, then heading north where the two crossing points at what is now Ludgate Circus and Holborn Viaduct can be seen, before the river starts wandering to the north:

In the next book in Besant’s series, “London In The Time Of The Stuarts”, we then have:
A Large And Accurate Map Of The City Of London (John Ogilby, 1670s)
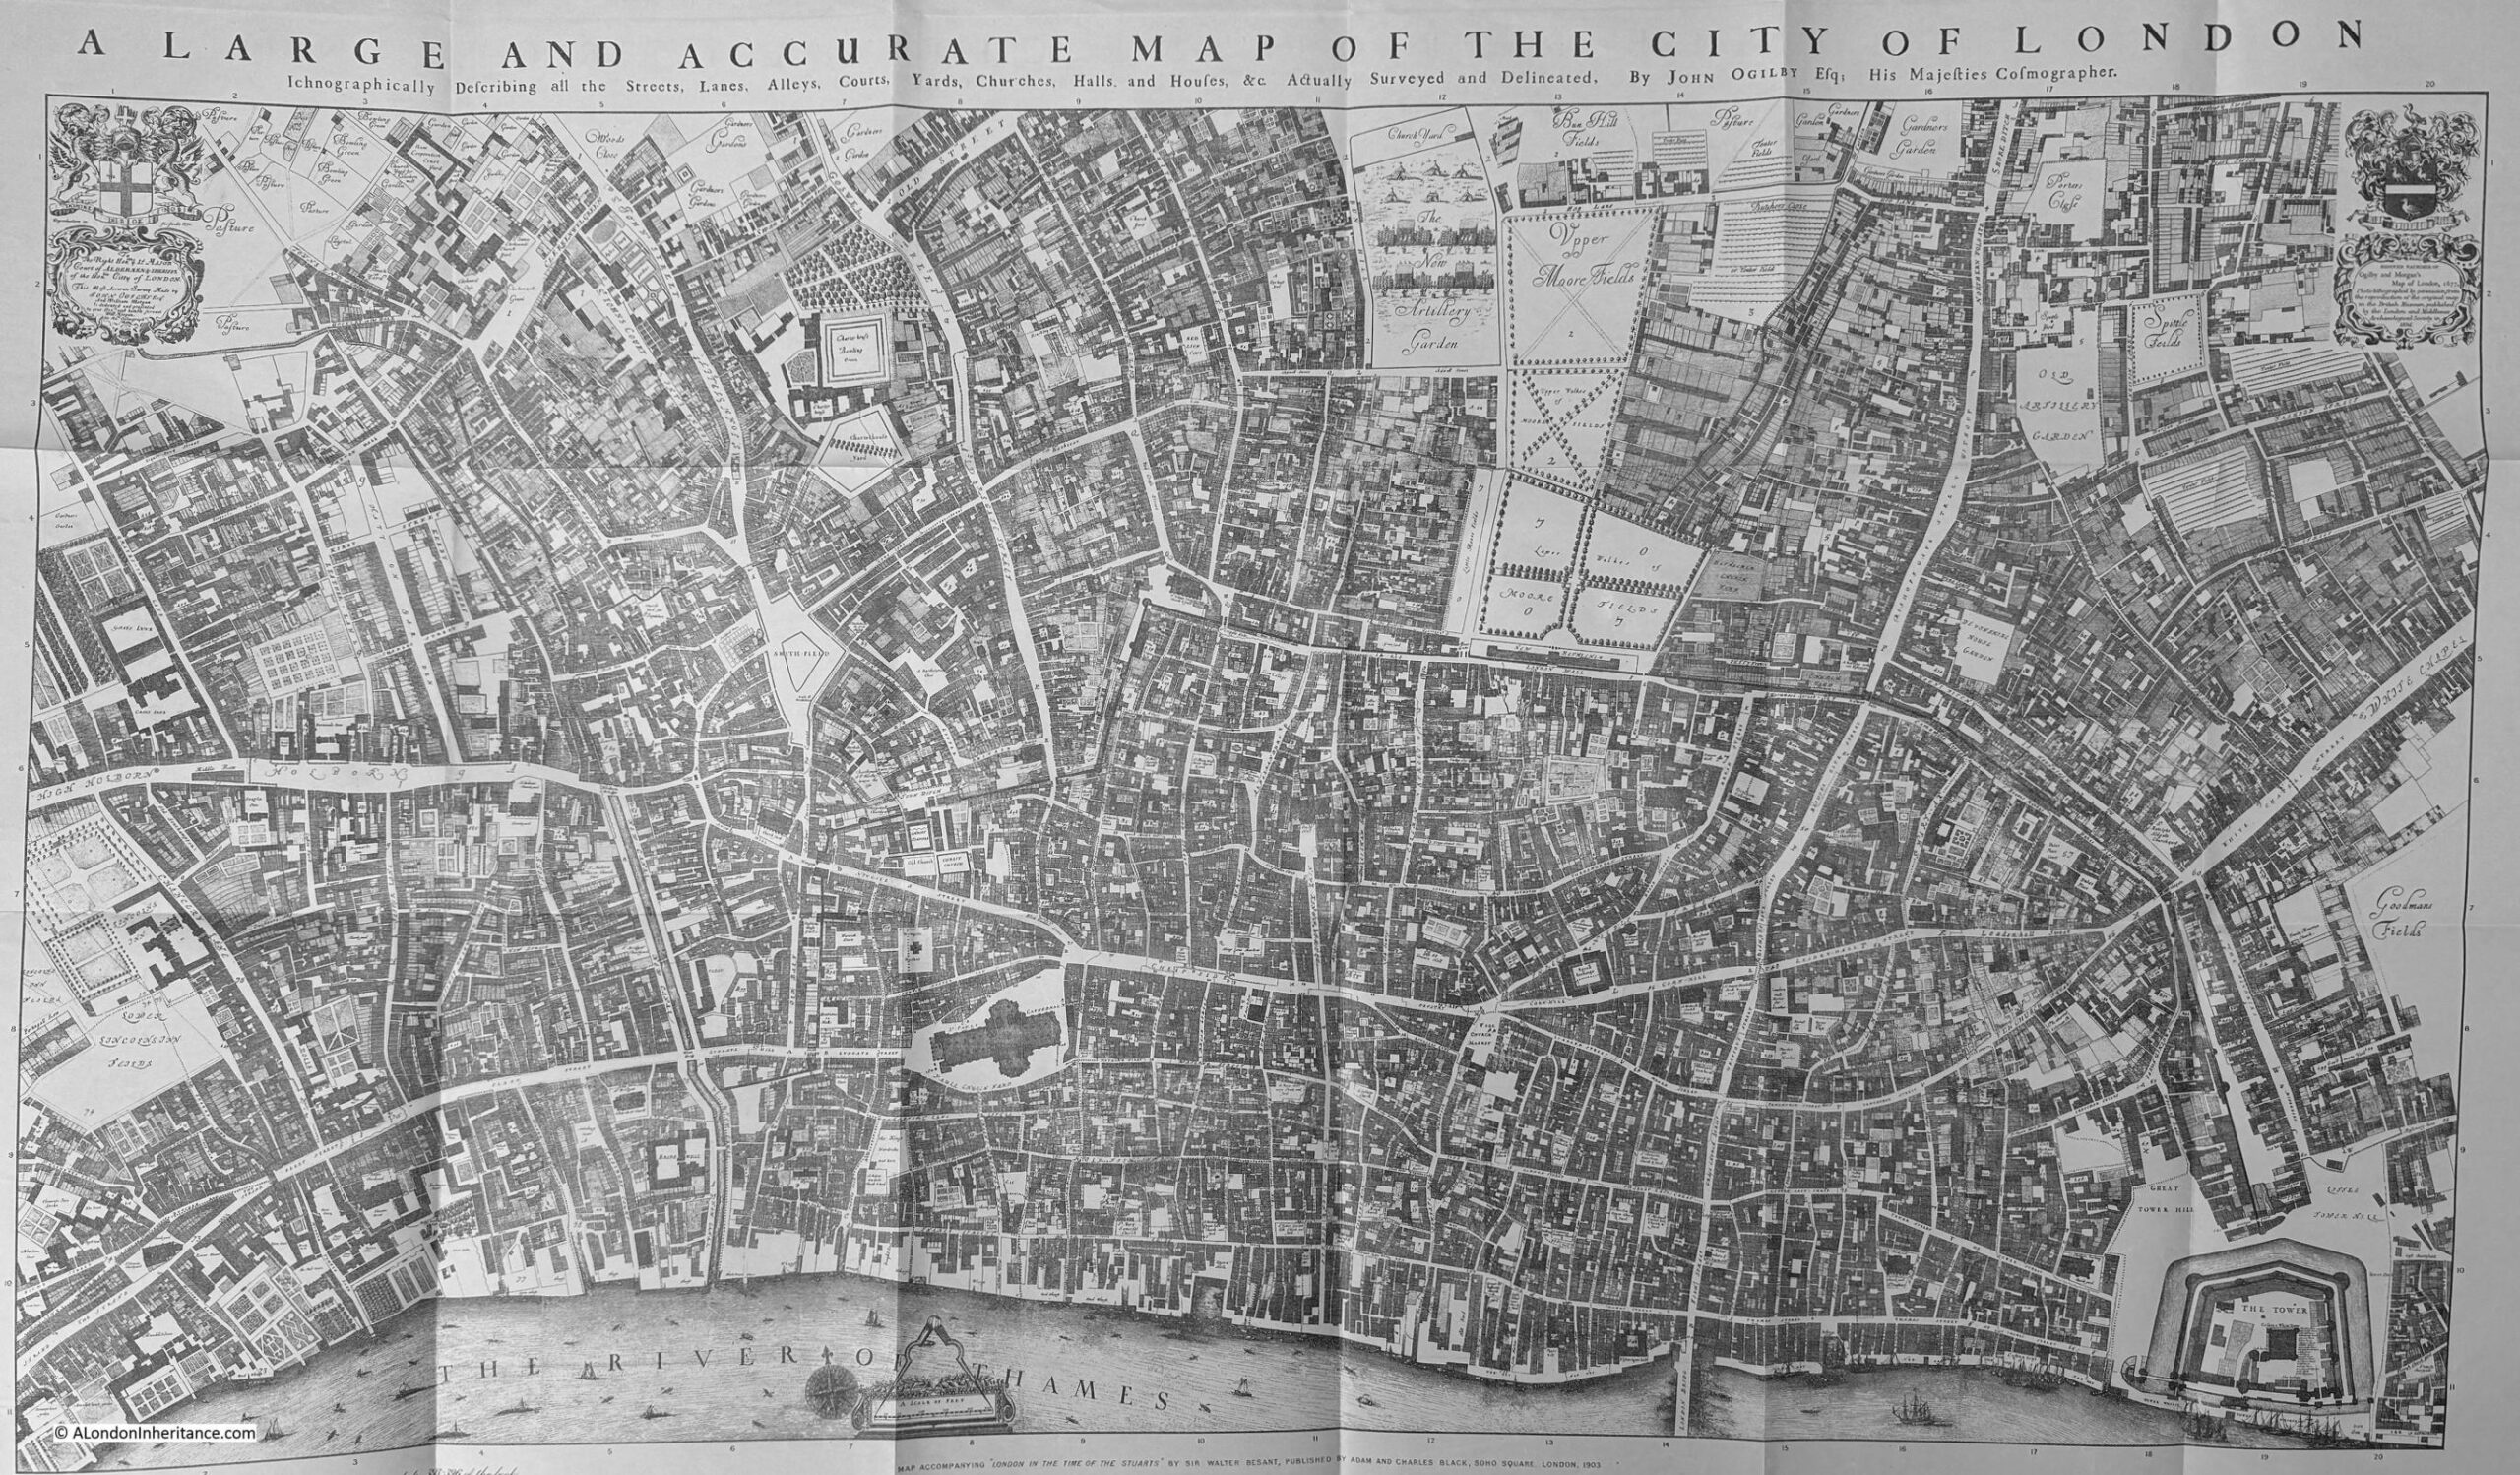
John Ogilby was a printer and publisher, translator, Master of the Revels in Ireland, he had served in the Army, and in the period after the Great Fire of London, he created a detailed and carefully surveyed map of the City of London.
There are some significant changes to the City we see today, however there is much that is basically the same (although the buildings will be very different).
In the following extract, the Wool Church Market is where Mansion House is today, and to the right is Cornhill, with the Royal Exchange and the churches of St. Michael Cornhill and St. Peter Cornhill, and there are the same alleys between Cornhill and Lombard Street that we can walk today, although between 19th and 20th century buildings, rather than those Ogilby would have known:

The map still shows the River Fleet in the 1670s, as a channel running up from the Thames, with what looks to be walkways along both sides of the river, between the Thames and Holborn:
After publishing his map of the City of London, Ogilby published perhaps his best known work, “Britannia”, which was a map of the routes between the principal towns and cities of the country.
For Britannia, Ogilby used the innovative method of a strip map, where the route was shown running along a series of strips, with the main geographic features, towns and villages, houses, side roads etc. that could be found along the route.
The following map is the strip map for the route from the Standard in Cornhill (a water pump at the eastern end of Cornhill, and one of the places in London used as the base for measuring distances) to Portsmouth in Hampshire:

In the text in the box at the top, the distance is given as 73 miles and 2 furlongs, and John Ogilby is given the rather grand title of His Majesties Cosmographer, a title given to Ogilby by King Charles II.
We then come to the book “London in the Eighteenth Century”, and:
London in 1741-5 by John Rocque

Rocque’s map is one of the maps I use regularly in blog posts, as it provides a comprehensive view of the city, including the wider, as yet undeveloped part of the city.
The River Fleet can still be seen, but it is now starting to be built over, and where the Fleet runs into the Thames is now Blackfriars Bridge:

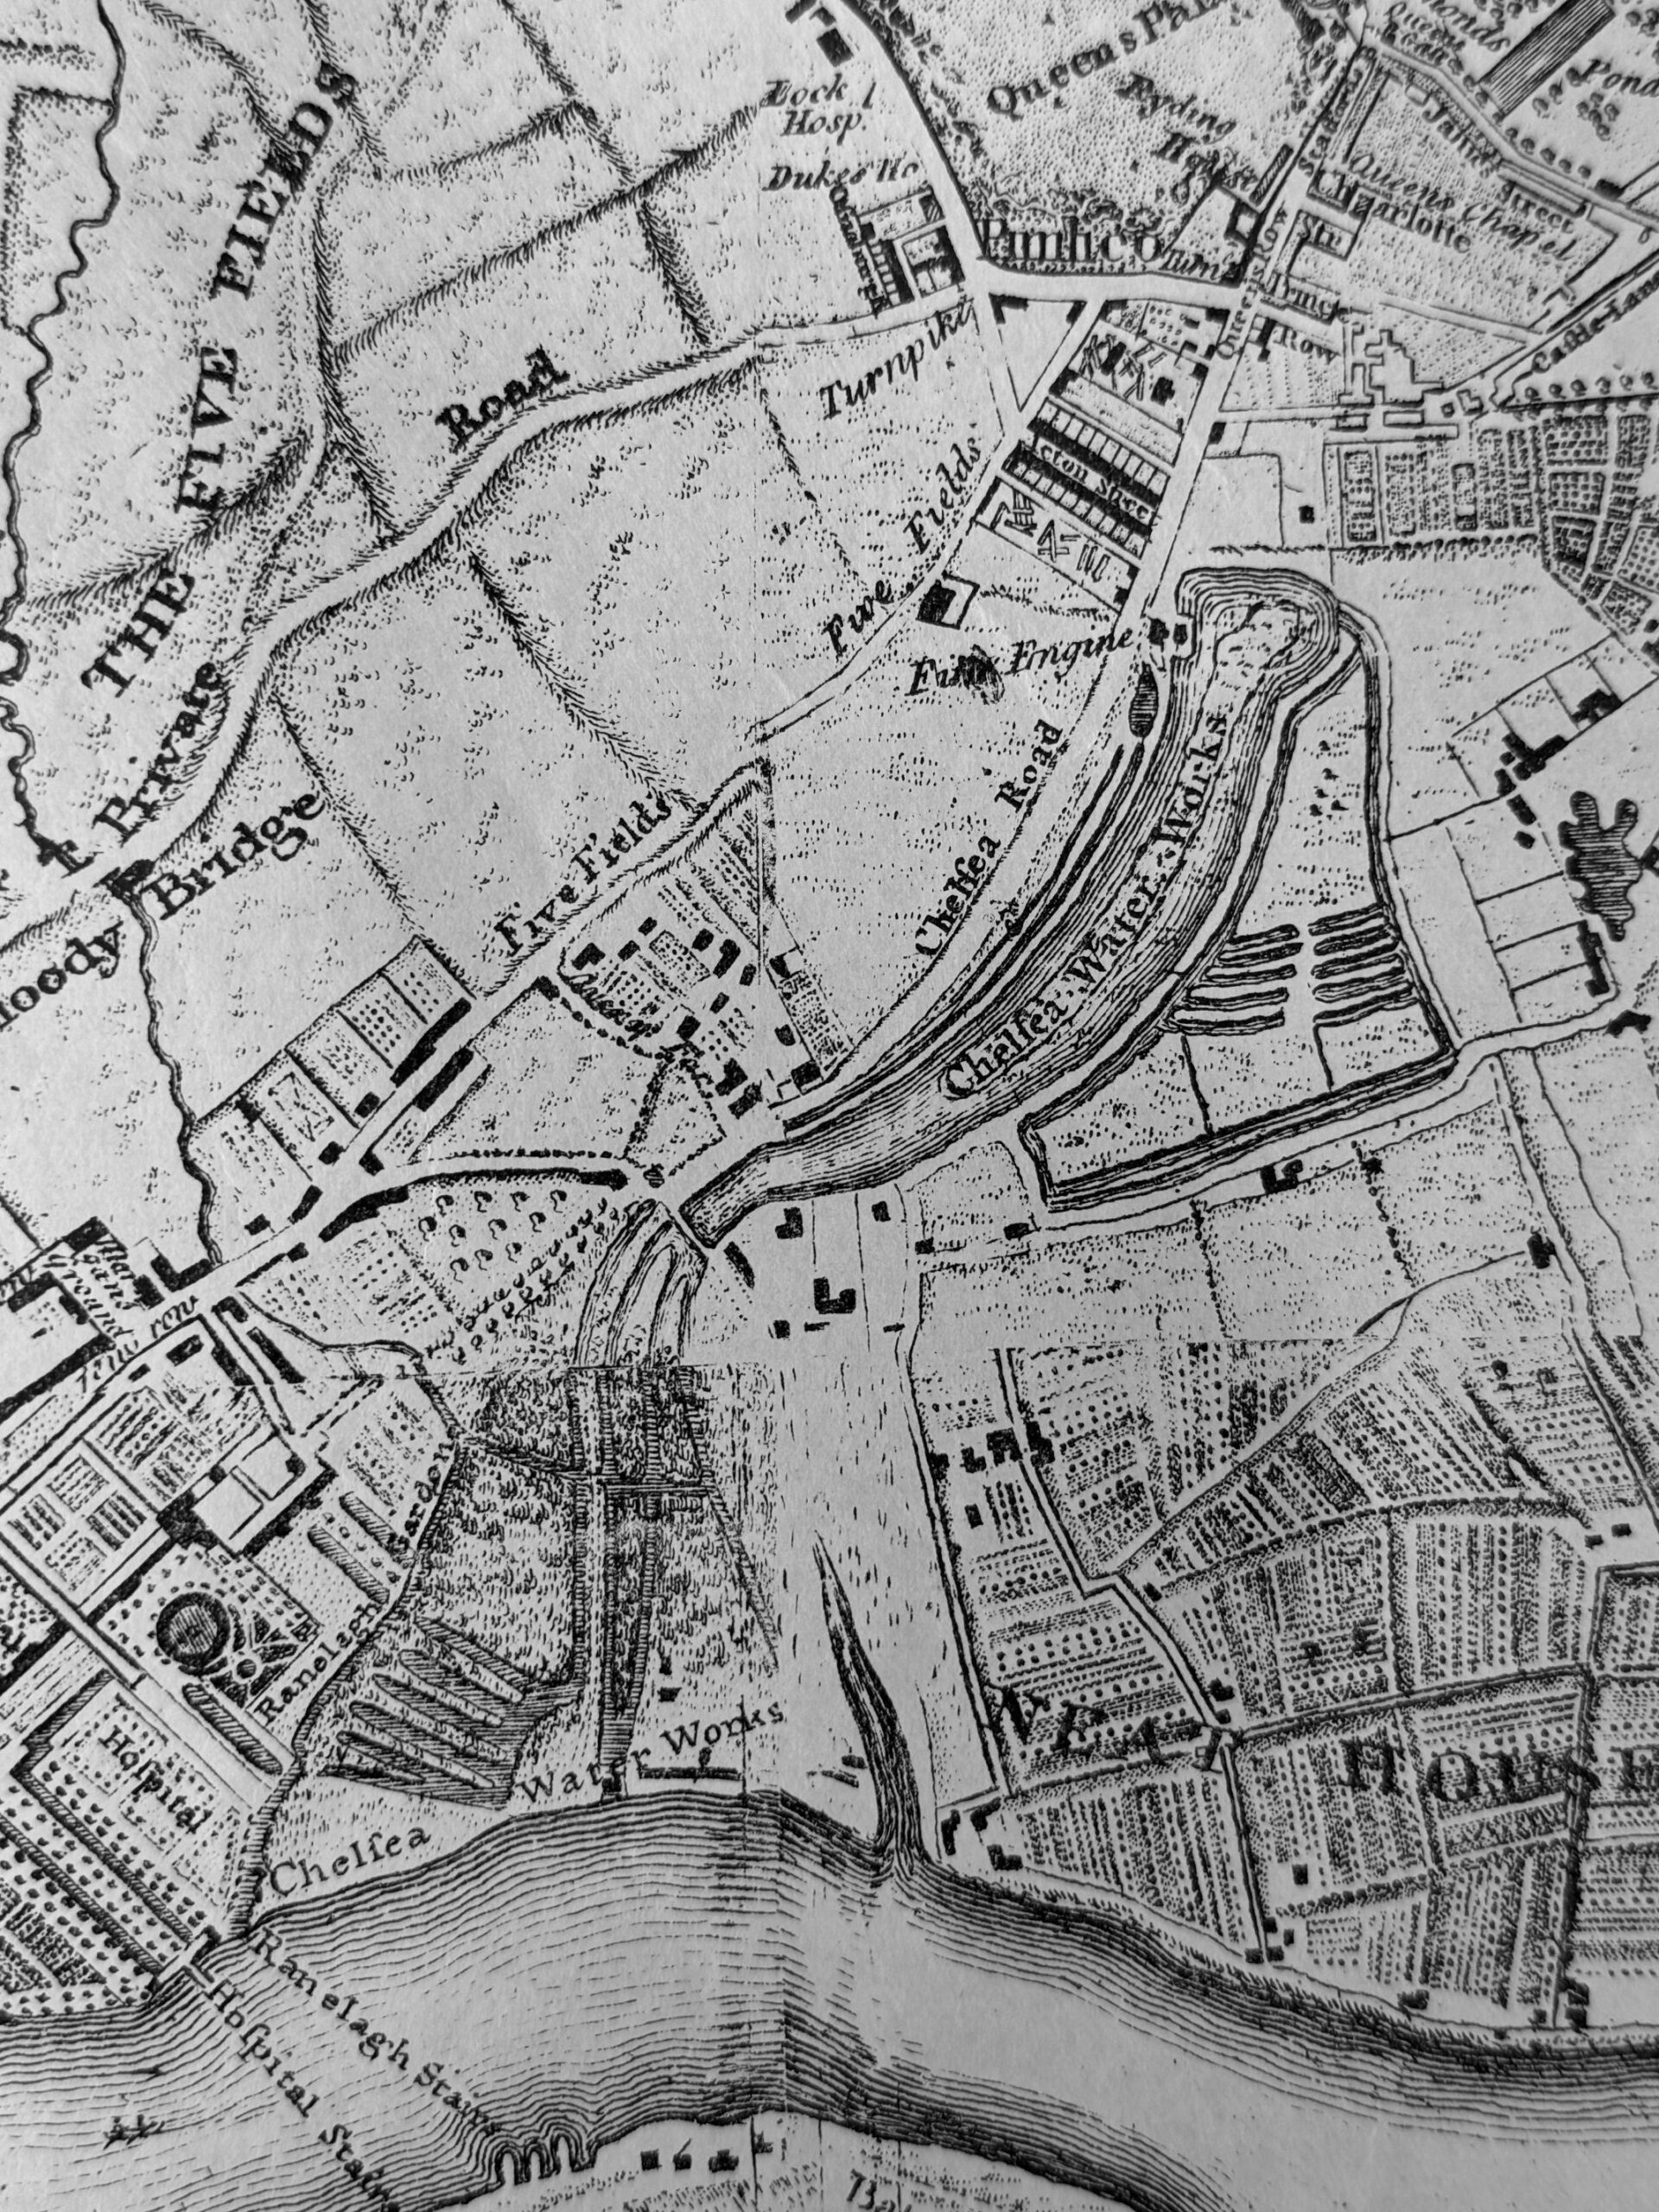
Looking to the west of Rocque’s map, and we can see Chelsea Water Works (roughly where Victoria Station, and the tracks leading out of the station are today). About 70 years after Rocque’s map, Chelsea Water Works would be closed and the space backfilled with the soil excavated for the new St. Katherine Docks.
We now come to “London in the Nineteenth Century”, and the city is expanding rapidly. The time when the city was enclosed within the old city wall as shown in the Agas map is long gone. This is:
Cruchley’s New Plan of London improved to 1835
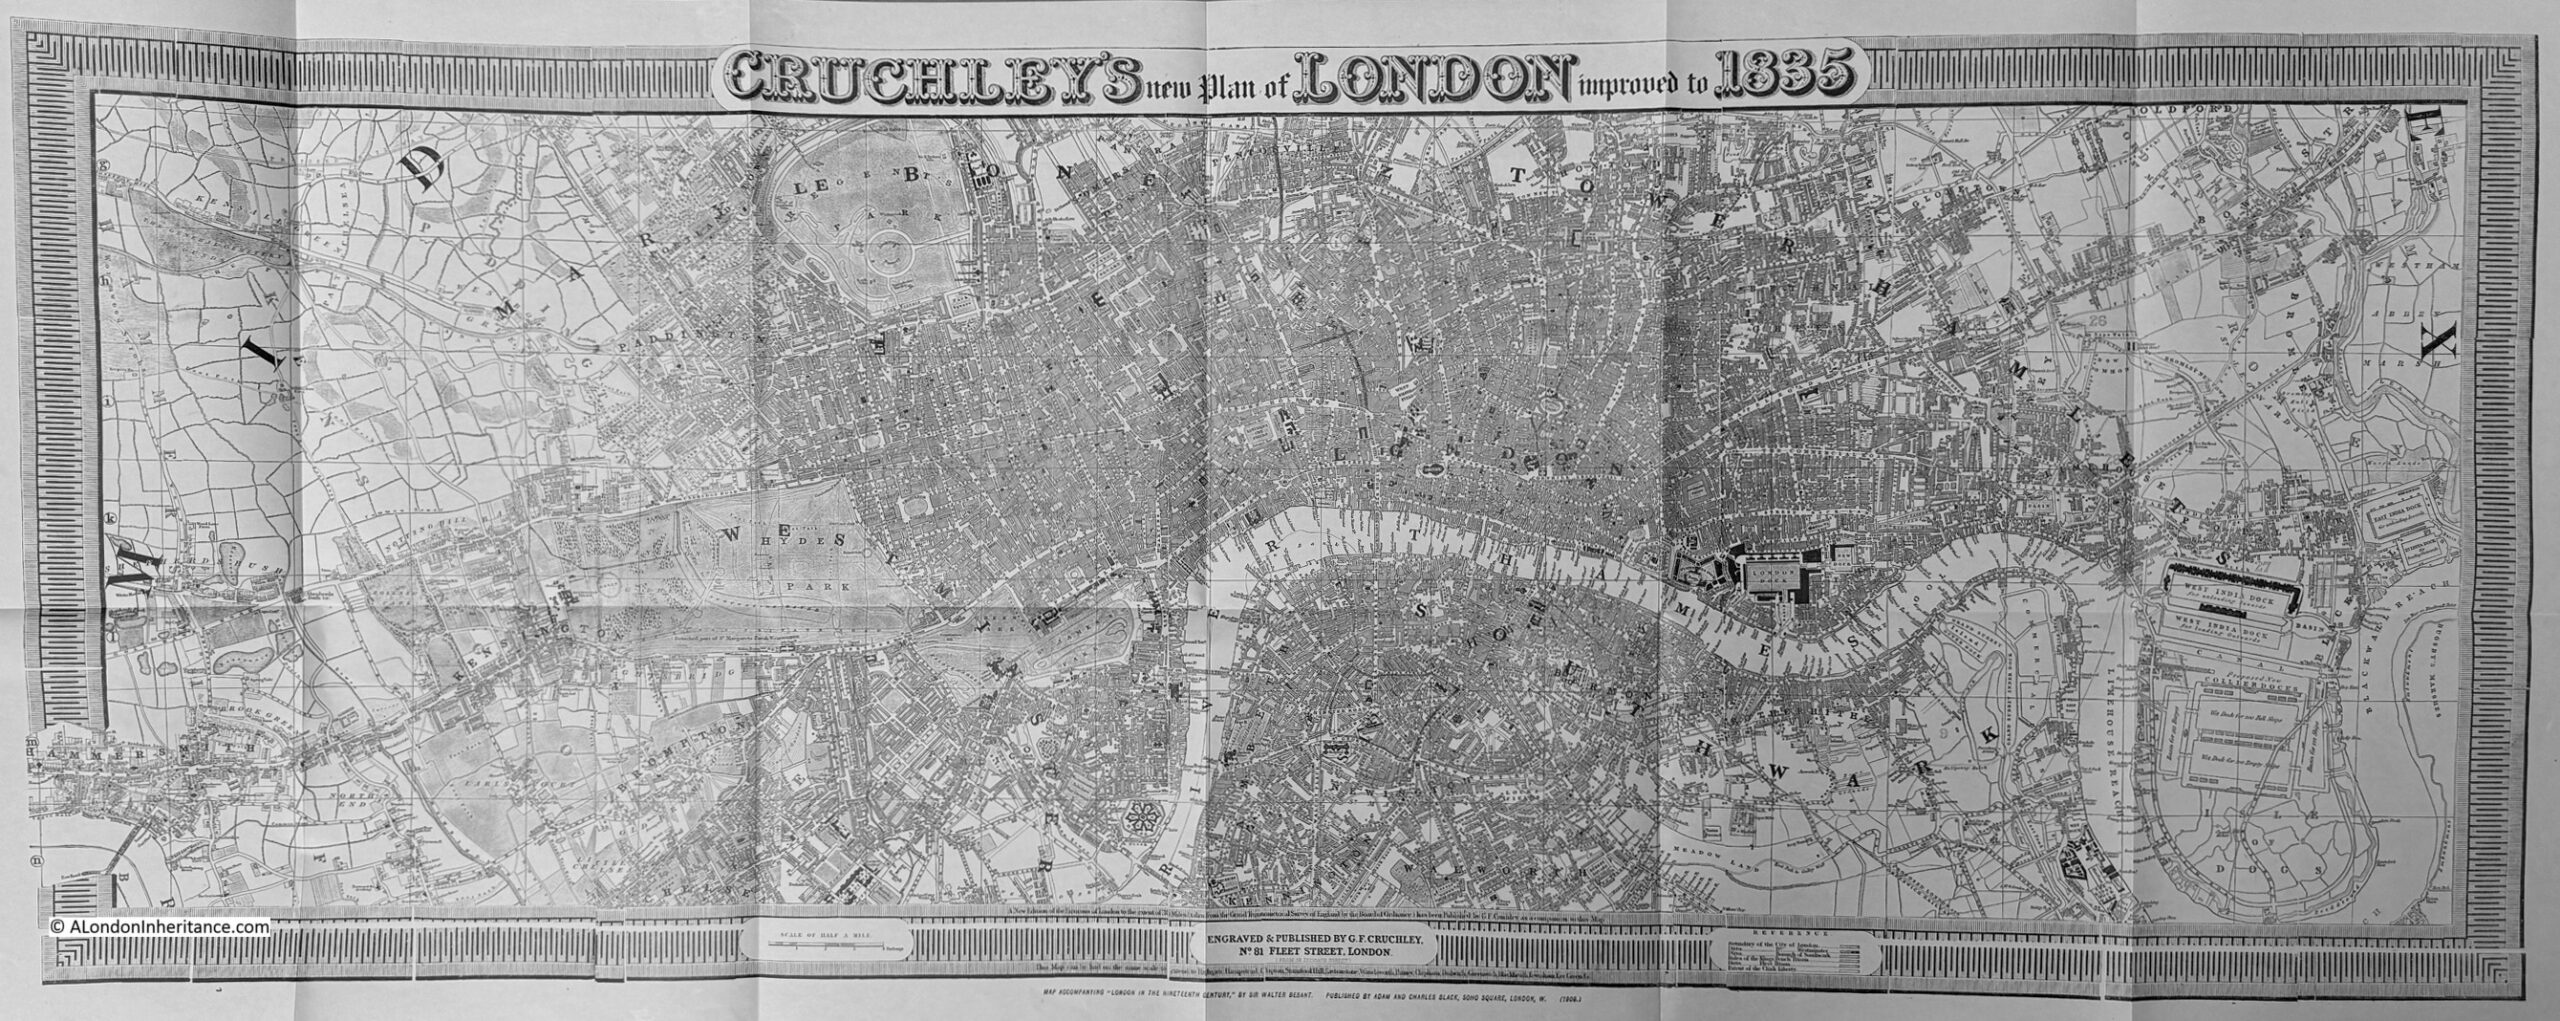
London has expanded rapidly, however there were still fields to the east and west, land that would be built on during the rest of the 19th century and early 20th century.
Part of the city’s expansion has been to the east, as trade carried along the river has grown considerably, and the original wharves and docks in the heart of the City were no longer capable of supporting the volume of goods and the size of ships.
If we look to the Isle of Dogs, we can see the West India Docks which were built in the early 19th century, and below these docks, we can see the outline for some proposed new docks, each capable of supporting 200 ships:

One of the early roads that ran through the Isle of Dogs to the ferry at the southern tip can be seen running across the outline of the new docks.
The docks would not be built as shown in Cruchley’s map, the new docks would be the southern dock below the West India, and the Millwall Dock.
Another book with an impressive fold out map is Henry Chamberlain’s:
A New and Complete History and Survey of the Cities of London and Westminster, the Borough of Southwark, and Parts Adjacent
The book dates from 1770, and has a large fold out map of the city in that year:
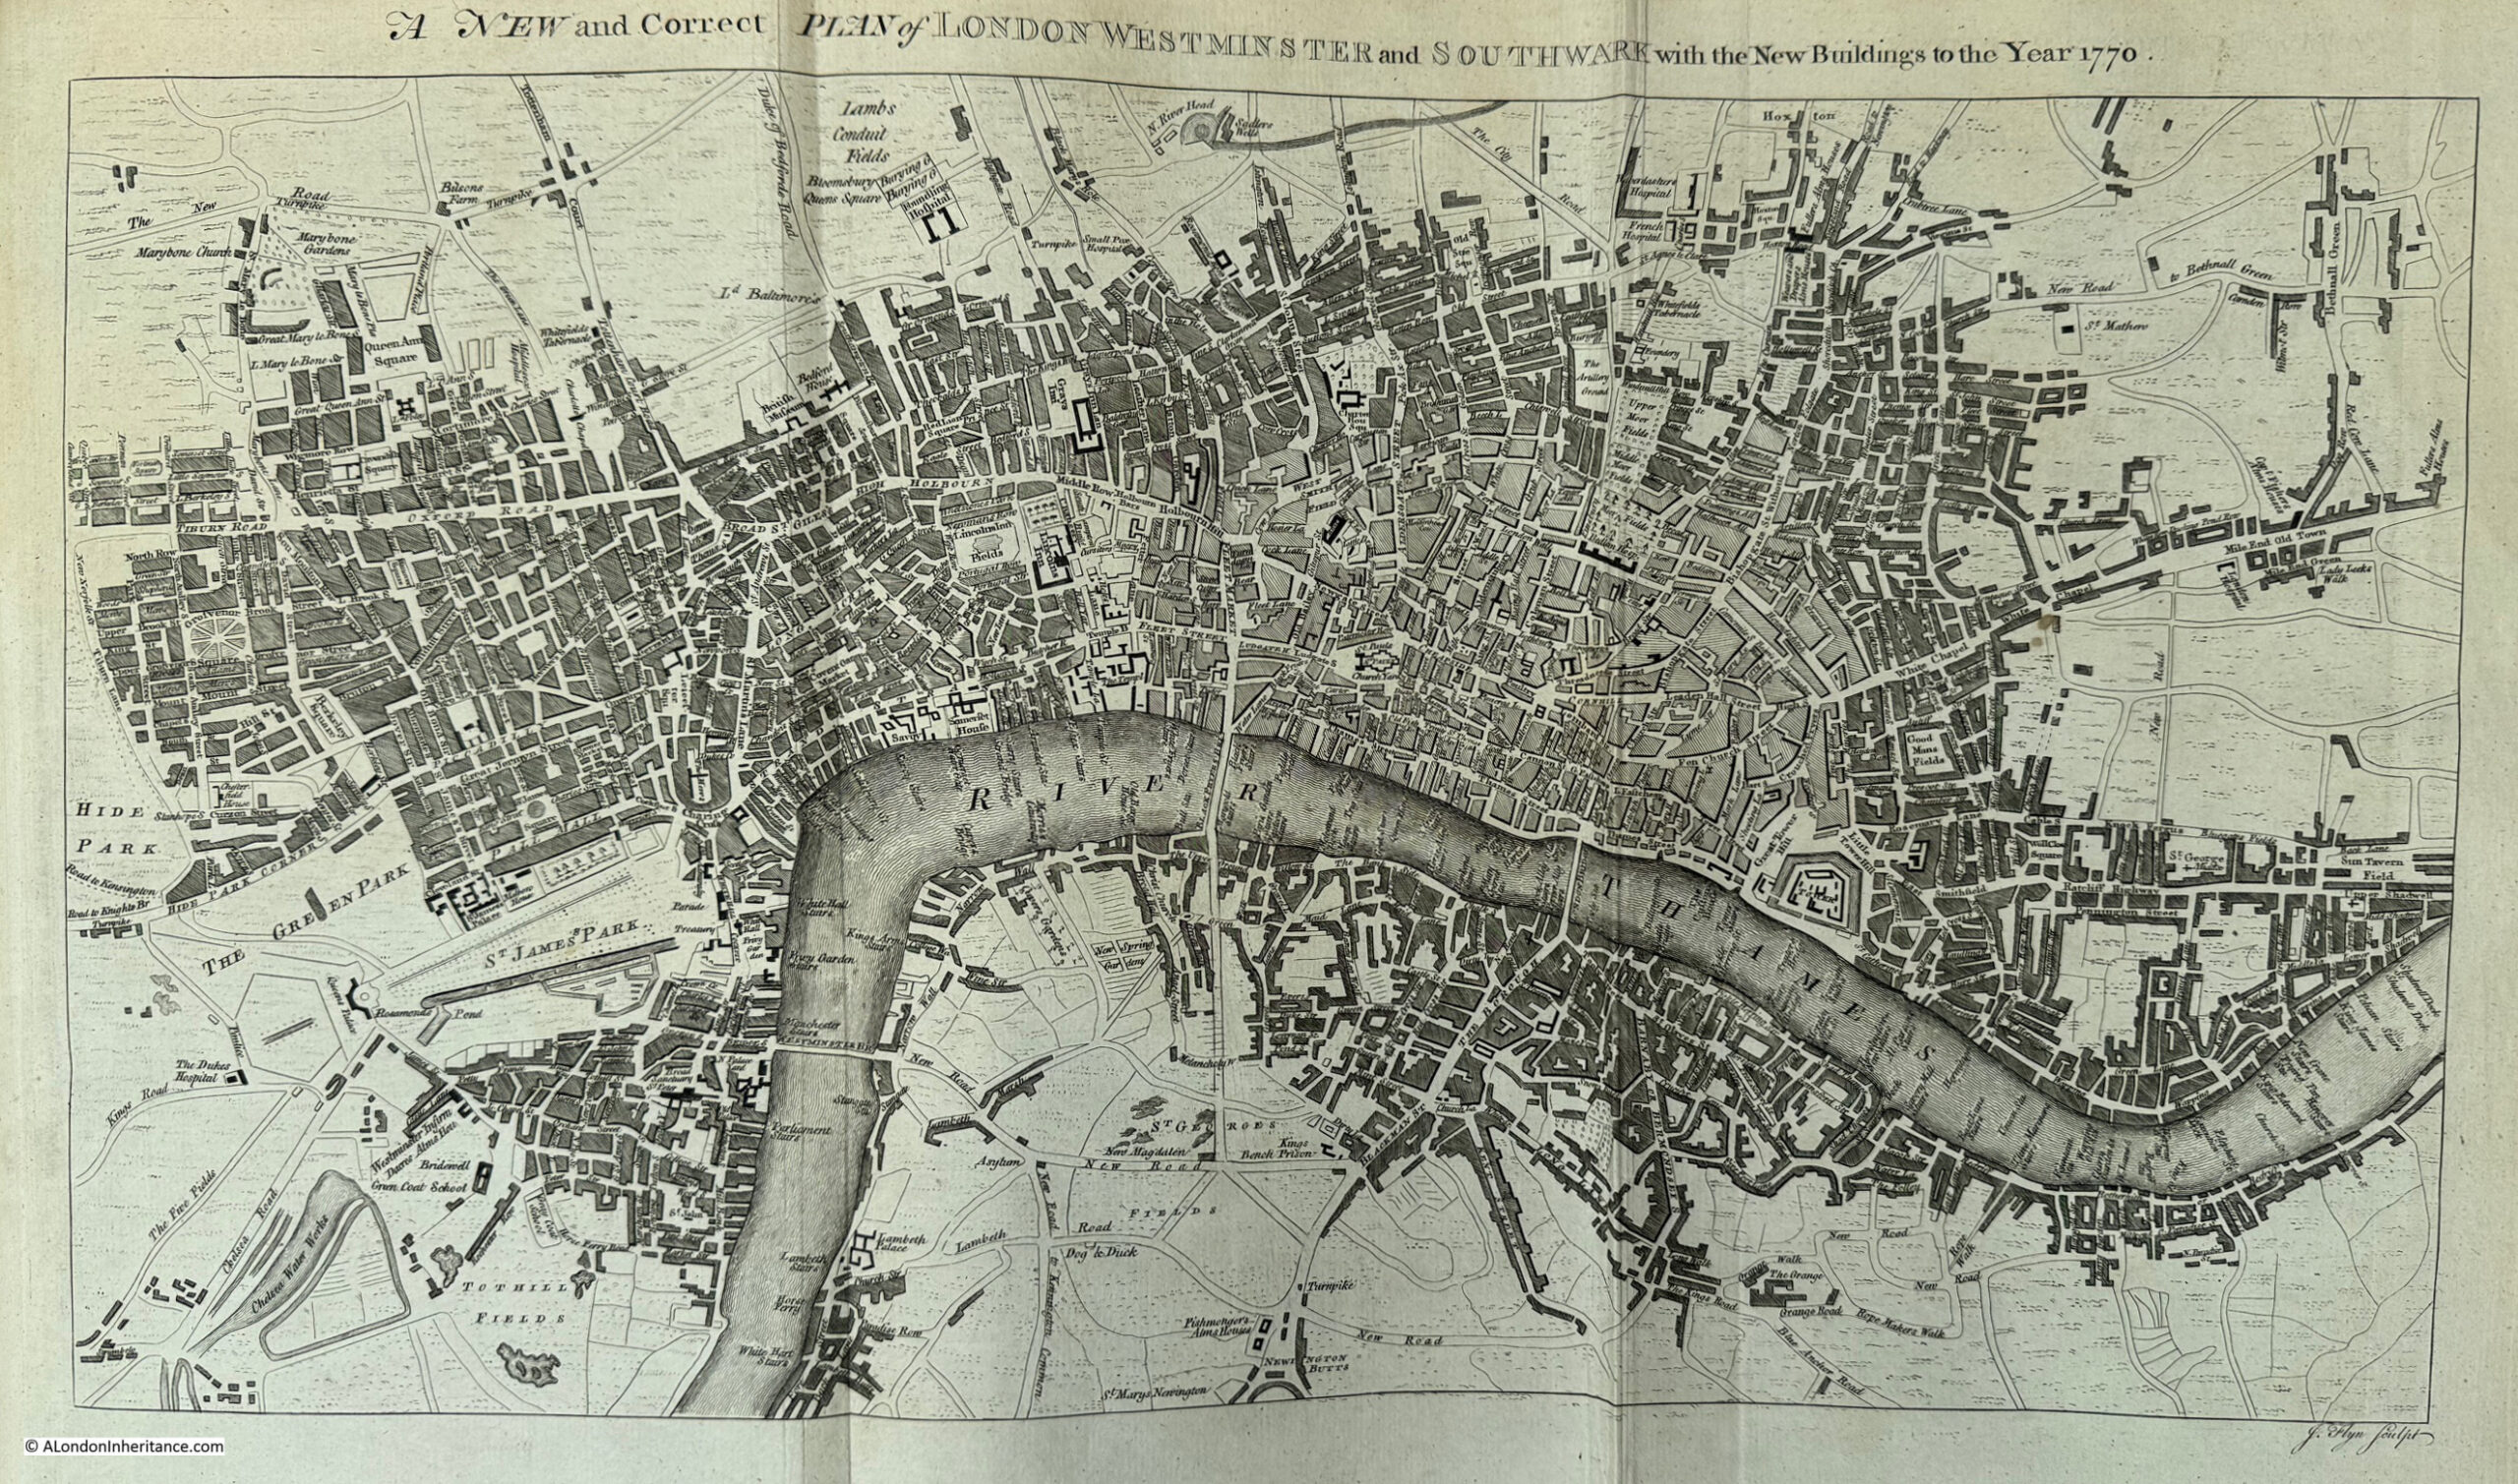
Again, there are plenty of little details which show the city at the time, and if we look at the top of the map, there is New River Head and Sadlers Wells:

New River Head was the large pond built at the end of the man-made New River that brought water in from springs around Ware in Hertfordshire, ready for onward distribution across London.
Sadlers Wells was named after a well and the first owner of the site and the entertainment venure he developed.
At the time, the land between Sadlers Wells and the city, was still open land, as the map shows, and was a risky place for those returning from a night at Sadlers Wells to their city homes, with many reports of theft across what would have been dark fields.
If we look at the area of Lambeth covered by the map, we can see at the time there were no other bridges between Blackfriars and Westminster Bridges, and we can see one of the pleasure gardens south of the river, Cuper Gardens, which is where the approach to Waterloo Bridge and the large roundabout at the end of the approach road are located today.

Narrow Wall can be seen on the map, one of the early attempts to stop the river from encroaching on the land and reclaiming Lambeth Marsh. Narrow Wall is today Belverdere Road and Upper Ground.
The next book is “A Dictionary of London” by Henry Harben (1918). This book has a pocket at the end, in which there are a selection of maps. The first being:
A Map of the Cities of London & Westminster and the Borough of Southwark together with the suburbs, 1708

Some of the maps in Harben’s book are based on several different maps to provide coverage and detail not seen within one individual map. The above map is based on “Hatton’s New View 1708, but it incorporates material supplied in Philip Lea’s map of 1673, John Ogilby’s of 1677 and Morden & Lea’s map of 1682. Further details come from Richard Blome’s ward maps published in Stryp’s edition of Stowe, 1720”.
The benefit of this composite approach is the level of detail in one map, and in the following extract we can see the stairs and houses along the river between the mouth of the Fleet and the horse ferry in Westminster:

Interesting that in St. James’s Park there is a feature labelled “Decoy”. This may have been a pond where ducks, or other waterfowl would be lured into and trapped. The benefit of such a place was that if they were to be served as meat for food, then not having been shot, they would not contain lead shot.
The next map in Harben’s book is the product of three maps, and is titled:
A Map of London about 1660. The Ground Plan is based on Hutton 1708. The details from Faithorne and Newcourt Circa 1658

Again, there are many small details. Wapping is mainly built along the river and along the Ratcliffe Highway, and the area of Rotherhithe is using the old name of Redriff.
There is one, small detail I really like. Take a look at Limehouse to the east, and next to the small indentation from the river (Limekiln Dock, see this post), there is a drawing of a lime kiln:

The lime kiln is shown in the correct location for the first lime kiln in the area, and is the structure that would give Limehouse its name. The accuracy of the image extends to the smoke issuing from the top of the kiln, from the burning of chalk brought up from Kent.
We then come to:
Map of London shows its size at the end of the 16th century. The ground plan is for convenience based on the plan in Hatton’s New View 1708. The main details are from Norden 1593 & Speed 1610

In this series of maps from Harben’s book, we have been going back in time, and this map shows the city at the end of the 16th century, overlaid on a plan of 1708.
It shows a much smaller city, and there are details which show just how undeveloped parts of London were at the time.
The area south of the river, where much of Lambeth is located today, is labelled Lambeth Marsh, and has the symbols for a marsh along with some lines of trees.
The area between Narrow Wall and the Thames are areas of agriculture, with inlets leading from the river up to Narrow Wall. This area between Narrow Wall and the river was used for agricultural purposes, such as growing reeds.

Some of the maps in Harben’s book show how you can add additional detail to a map, and these are the pre-Internet versions of the Layers of London site, for example:
Plan of London in the 16th, 17th & 18th Centuries Superimposed on the Present Ordnance Survey Plan

The above map is the Eastern Sheet and the map below is the Western Sheet:

A small detail from the map shows the outline of the pre-Great Fire St. Paul’s Cathedral overlaid on the outline of Wren’s cathedral which we see today, showing a slight change in orientation and size:

Another of Harben’s maps where has overlaid data on a street plan is a:
Plan of London showing the Levels of the Natural ground below the present Surface, the Line of the Roman Wall of the City, and the Sites of Discoveries of Roman remains etc.

Walking the city streets today, it is hard to appreciate just how much land levels have changed over the last couple of thousand years.
Centuries of dumping of building rubble, accumulations of rubbish, waste and soils, demolition rubble from events such as the Great Fire, leveling of the city, for example, the land running down to the Thames (when Queen Victoria Street was built, parts were raised to level out the street), covering of rivers such as the Fleet and the Walbrook etc. have all contributed to raising the ground level of the city.
The lowest levels where evidence of human occupation of the city are those from the Roman period, and in the map, Harden has located where remains have been found, and the level below the current surface, for example, as shown in this extract showing the area around Cripplegate and London Wall:

One of the best places where this raising of surface levels can be seen is the part of the Roman Wall shown in the above map, which is preserved in the underground car park below London Wall. Whilst there are many runs of the wall above ground in the area, these are all medieval, we have to look below the surface to get down to the Roman Wall, as can be seen in this post where I photographed the wall in the car park.
A small sample of some of the old maps of London that show how the city has developed over the centuries, and finding an old book with a large folding map, or even better, a pocket at the end of the book stuffed with maps is always a bonus.
Some of the other maps I have looked at in the blog are Reynolds’s Splendid New Map Of London , the 1944 report on the Reconstruction of the City of London, and the 1943 London County Council Plan for the redevelopment of London.
Today’s post was like finding gold at the end of a rainbow ! So much information that it could occupy me for days (or weeks). I love maps ! Thank you for all your detailed research and for each and every blog you send.
Wow! This is brilliant research and a fabulous depth of information. Thank you.
Thnk you for this brilliant post. A superb review of London maps.
A stunning contribution even by your high standards! Thanks.
A great post and interesting how you have overlaid the maps.
A London Inheritance always provides new dimensions each week; this is no exception.
I am setting aside a couple of hours each evening to digest the contents in slices.
As a possessor of various map book and other specialty books and plans about London, this edition was particularly noteworthy.
It was a delight to see that one of the books quoted for this edition was the 1943 London County Council Plan for the redevelopment of London, from which I am privileged to own a copy.
A fascination and welcome arrival in my in-box this morning. Thank you so much for this and all the other editions and photographs and maps.
Fabulous collection, many many thanks for this blog
This was fascinating, thanks for sharing your map collection. I love studying maps and trying to locate places in London through the centuries and see how the city has developed.
Interesting how quickly London expanded over the 19th century, before then Marylebone looks rural and obscure ( comparatively uncharted on the maps). Come the mid 19th century and places like Lisbon Grove, Church St. and Bell St, are packed with multi occupied terraces and people living in abject poverty.
Where did they suddenly come from?
A timely posting, many thanks, as I have just finished Neil Stevenson’s System of the World (set in 1710’s) and will be diving in to the 4th of Karen Maitland’s Daniel Pursglove series (set 1605-1608). Both authors describe moving about through London in good detail, and it is lovely to be able to see that foul Fleet ditch and where it slices through built up areas.
Your collection expands my modest few from that time, and lets my imagination take the twists and turns in those books in every greater detail. Many thanks