If you are interested in one of my walks, the following two walks have a few space available. Click for details and booking:
From the Strand to the Old Thames Shoreline: Transformation of a River Bank on Saturday October 18th
From the Strand to the Old Thames Shoreline: Transformation of a River Bank on Sunday October 19th
As any regular reader will know, I find old books and maps about London fascinating, and when the two combine, it is the perfect way to understand some of London’s history.
This is my second post featuring maps from books about London (you can read the first here), and these maps cover a range of areas and themes.
Some of the maps in today’s post are 200 years old, and are printed on thin, folded paper, so the photos are not perfect as I did not want to stretch or flatten the paper.
Click on the image to see each map in more detail.
The first map is from:
Fleet Street in Seven Centuries
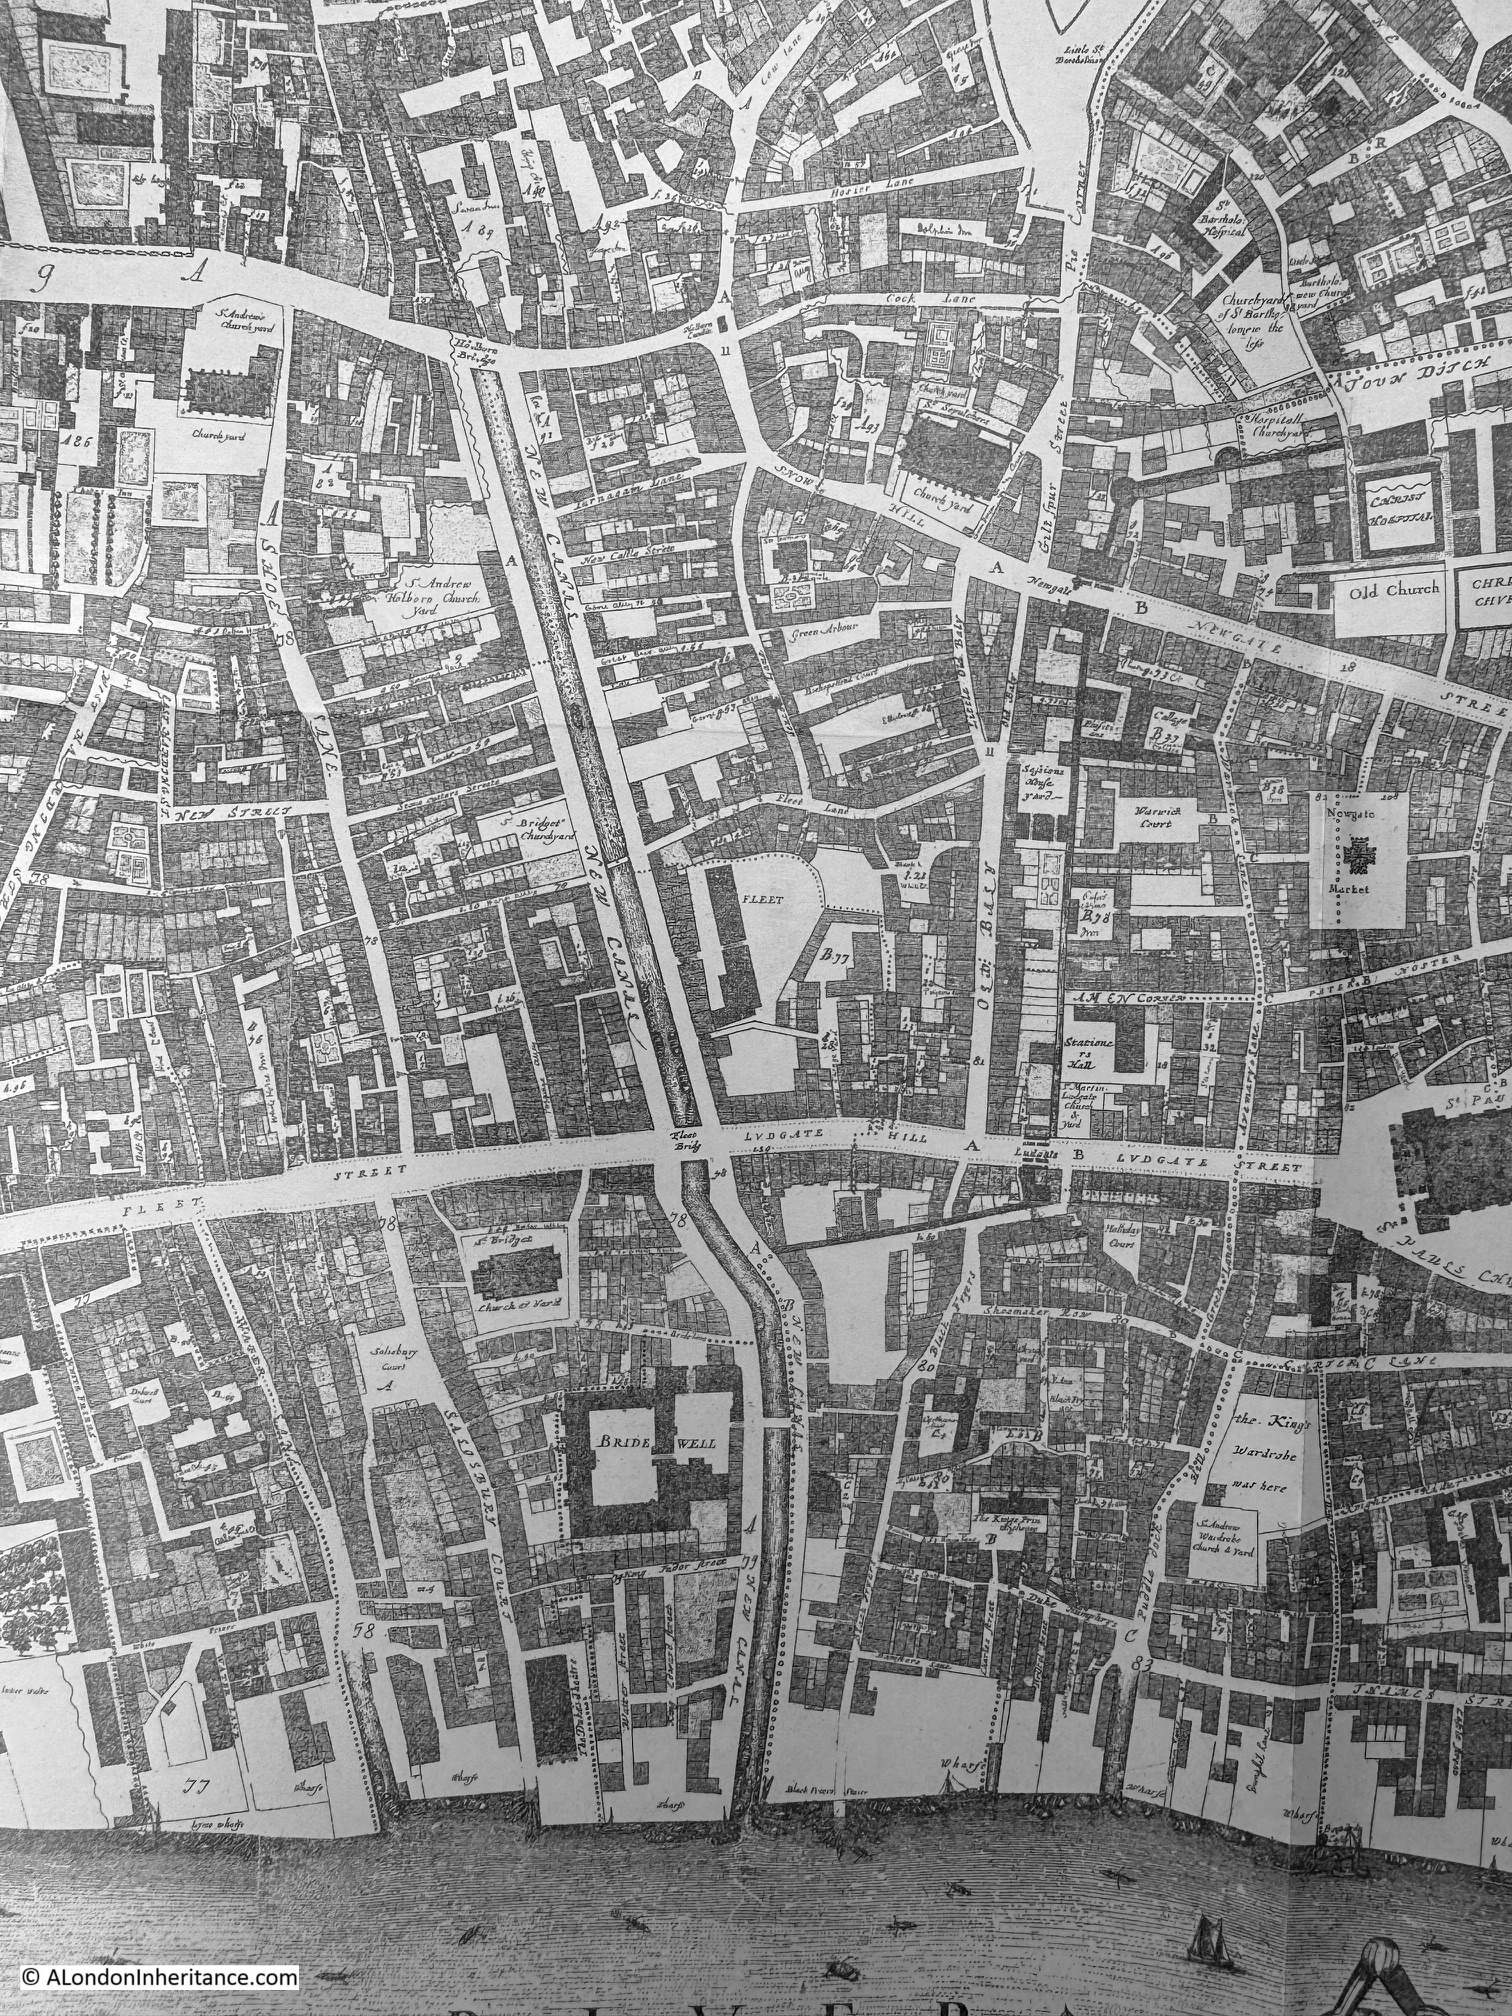
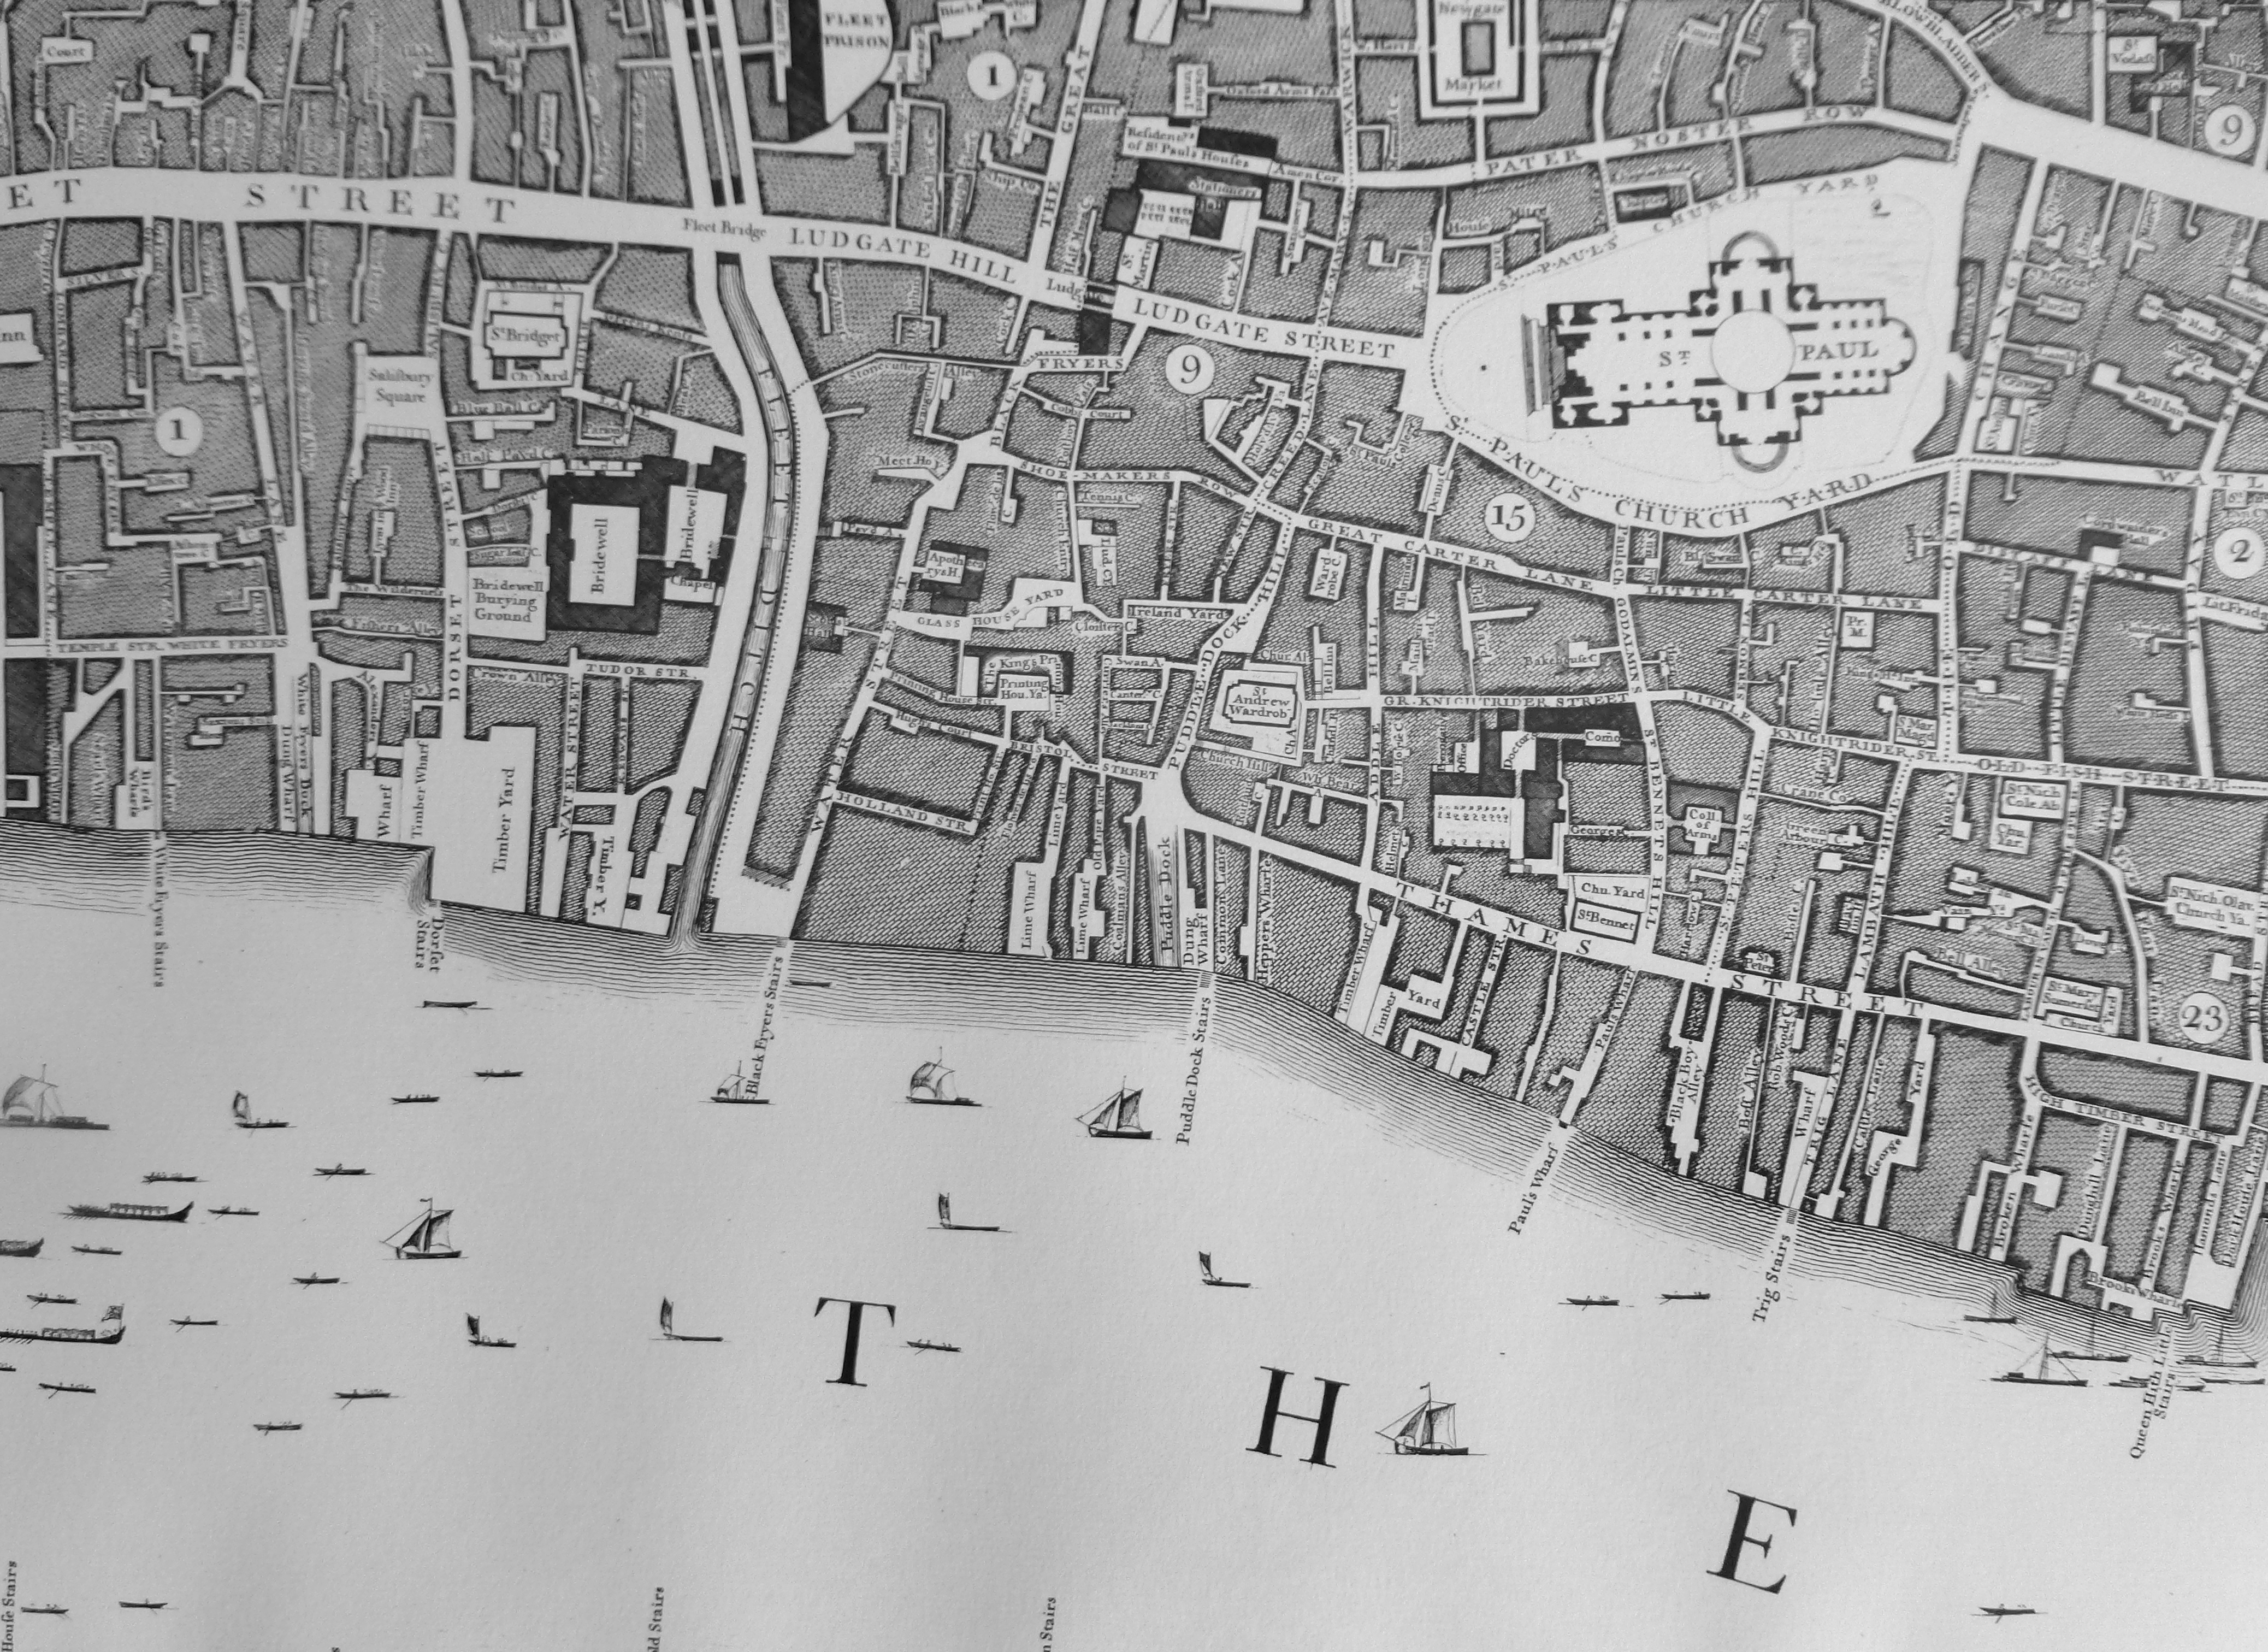
This book, by Walter George Bell was published in 1912. It is a detailed book of some 600 pages covering the history of Fleet Street, and includes a fold out map showing Fleet Street at the Reformation, 1538 – 40, and shows the property belonging to the religious houses and clergy and is based mainly upon the seizures of King Henry VIII at the suppression of the religious houses:
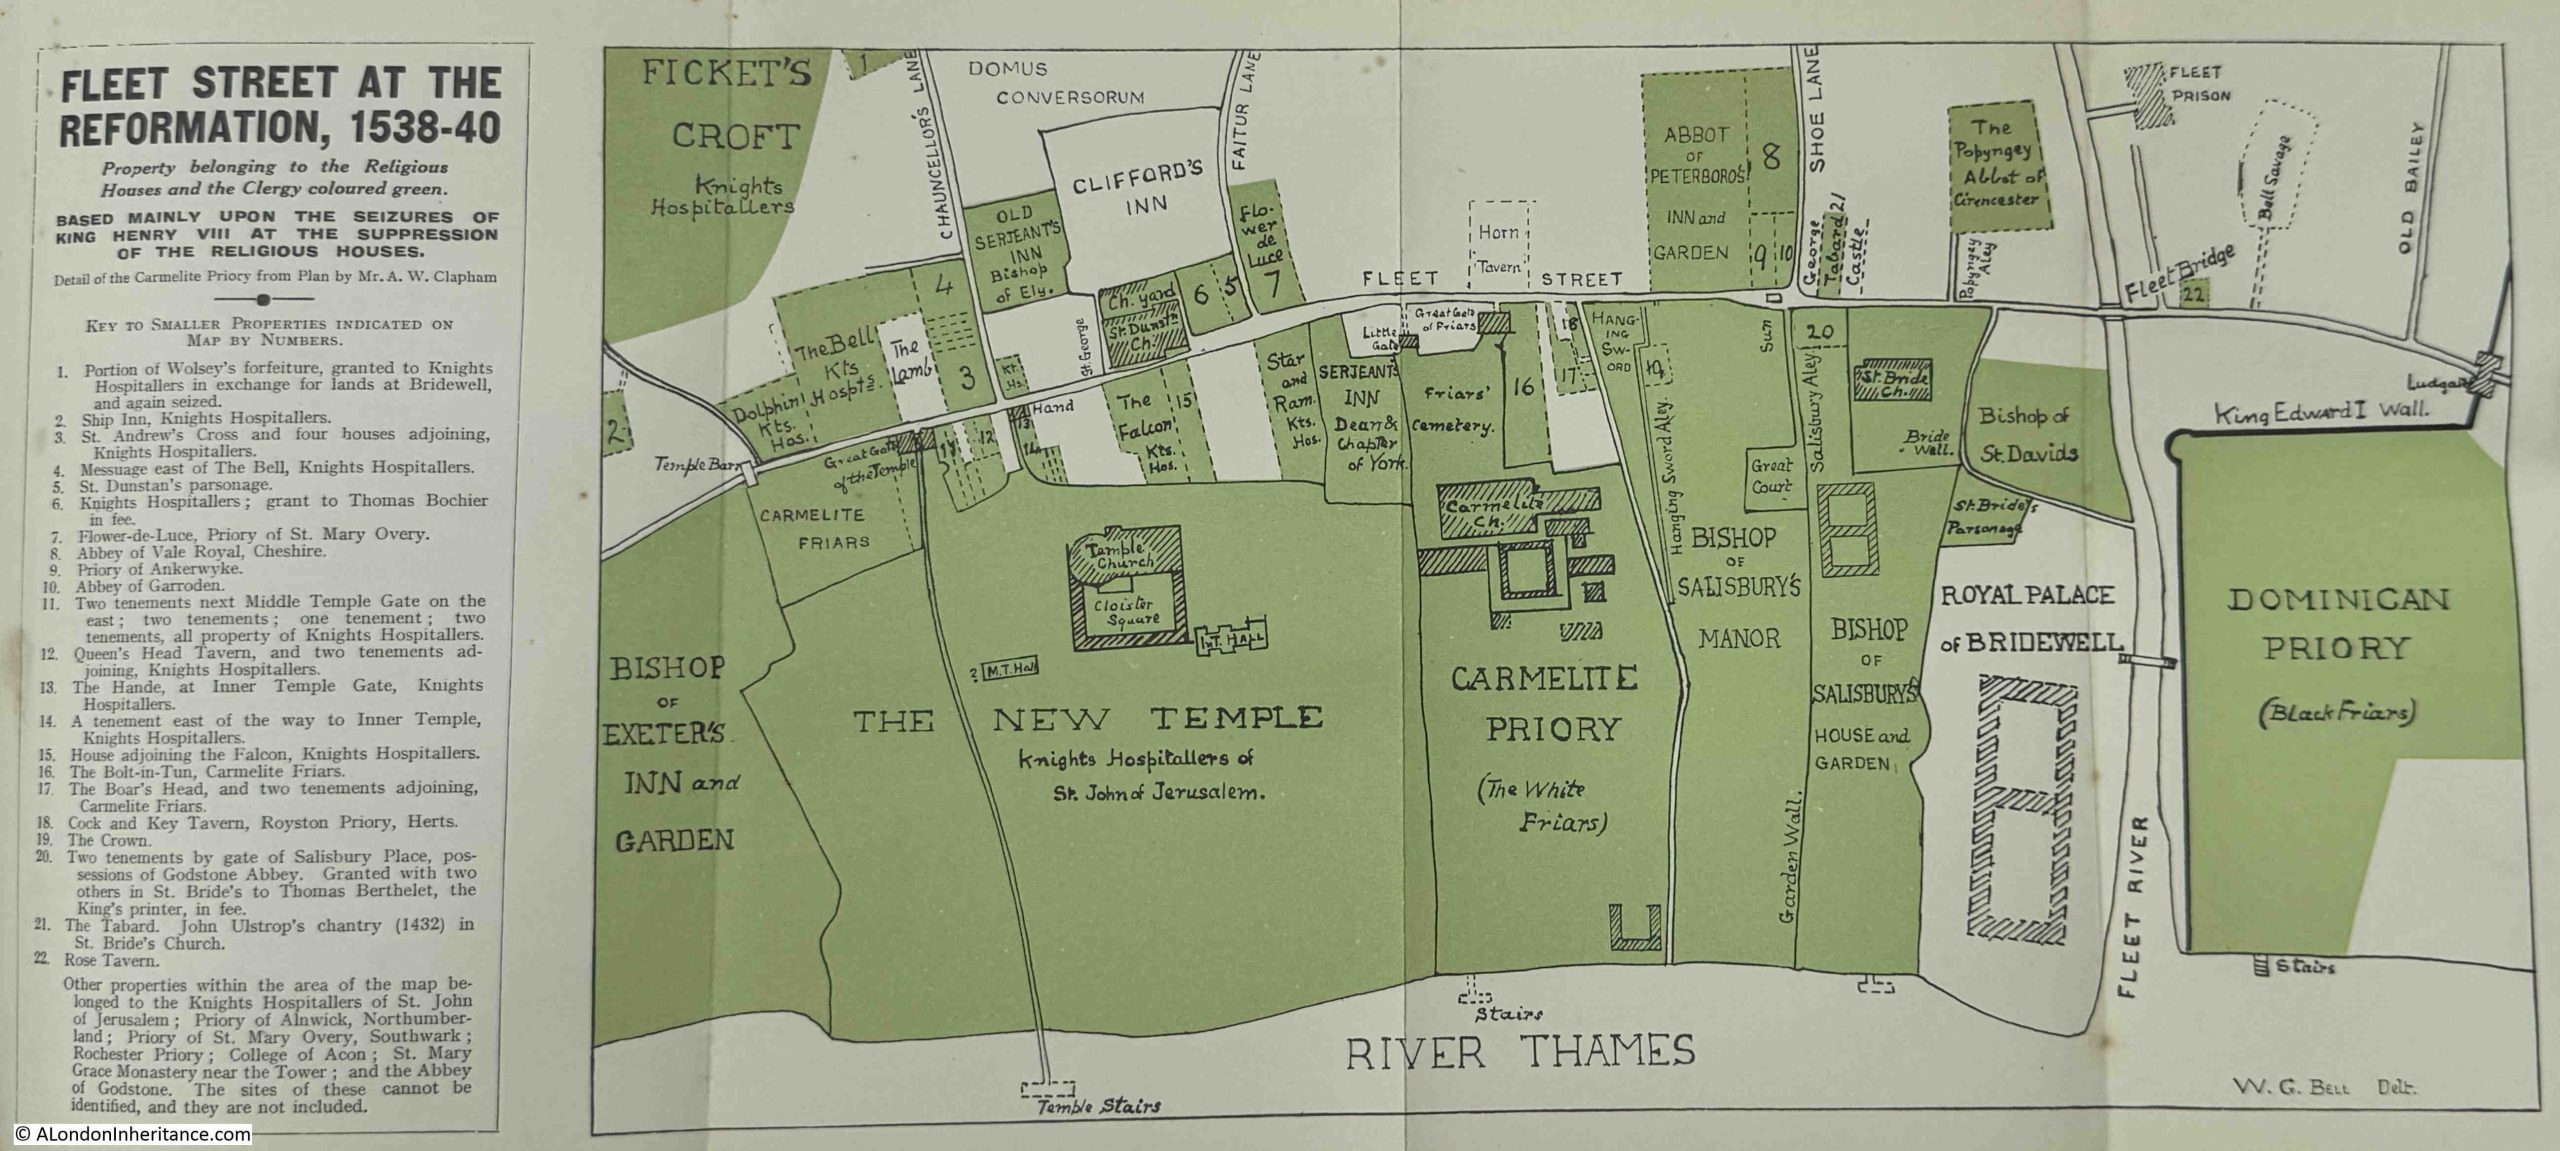
The map shows just how much property was owned by religious institutions. The small details within the map bring out features that require some follow-up, for example:
At number 9 there is a small property that is identified as “Priory of Ankerwyke”.
Ankerwycke is on the banks of the Thames, to the south west of Heathrow Airport, and there is a really nice walk to the site from Wraysbury station (45 minutes from Waterloo station).
It was a Benedictine Priory, dedicated to St. Mary Magdalene. A small priory with only six or seven nuns and a Prioress at the start of the 16th Century with an annual income of £20. The Priory was founded at Ankerwycke around 1160 and closed during the dissolution in 1536. Today only a small part of the old Priory buildings survive:
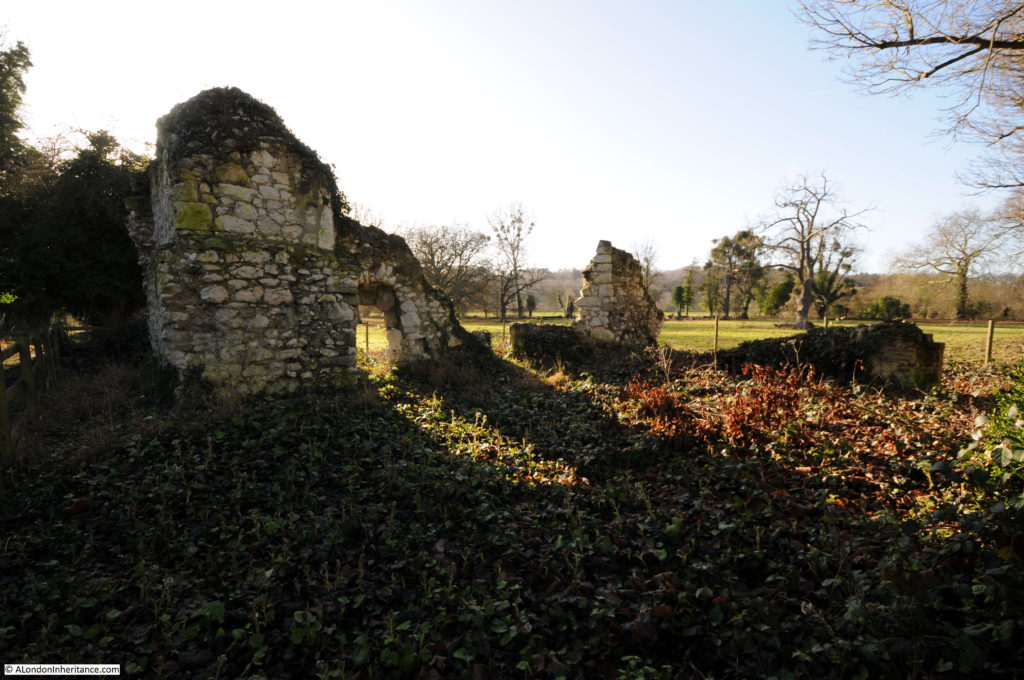
Assuming that it is the same place, it demonstrates the importance of having a presence in London if even such a small Priory had a property on Fleet Street.
The map shows St. Bride’s Church, which we can still see today, and includes a location for the Bride Well in the churchyard.
Hanging Sword Alley is also shown, a name we can still find today, but with an altered orientation.
There are a number of pubs; including the Queen’s Head Tavern, the Bolt-in-Tun, The Boar’s Head the Cock and Key Tavern (next to Cock and Key Alley). Many of these seem to have an association with one of the religious institutions.
Four sets of stairs are also shown, and Temple Stairs is shown correctly as having a longer extension into the river. Temple Stairs had a small bridge like structure out from the foreshore (see towards the end of this post).
The History and Antiquities of the Parish of Islington
This book by John Nelson was publish in 1829, and inside the front cover is a very delicate map – A Survey of the Roads and Footpaths in the Parish of Islington. From a Plan in the Vestry Room, Drawn in the Year 1735:
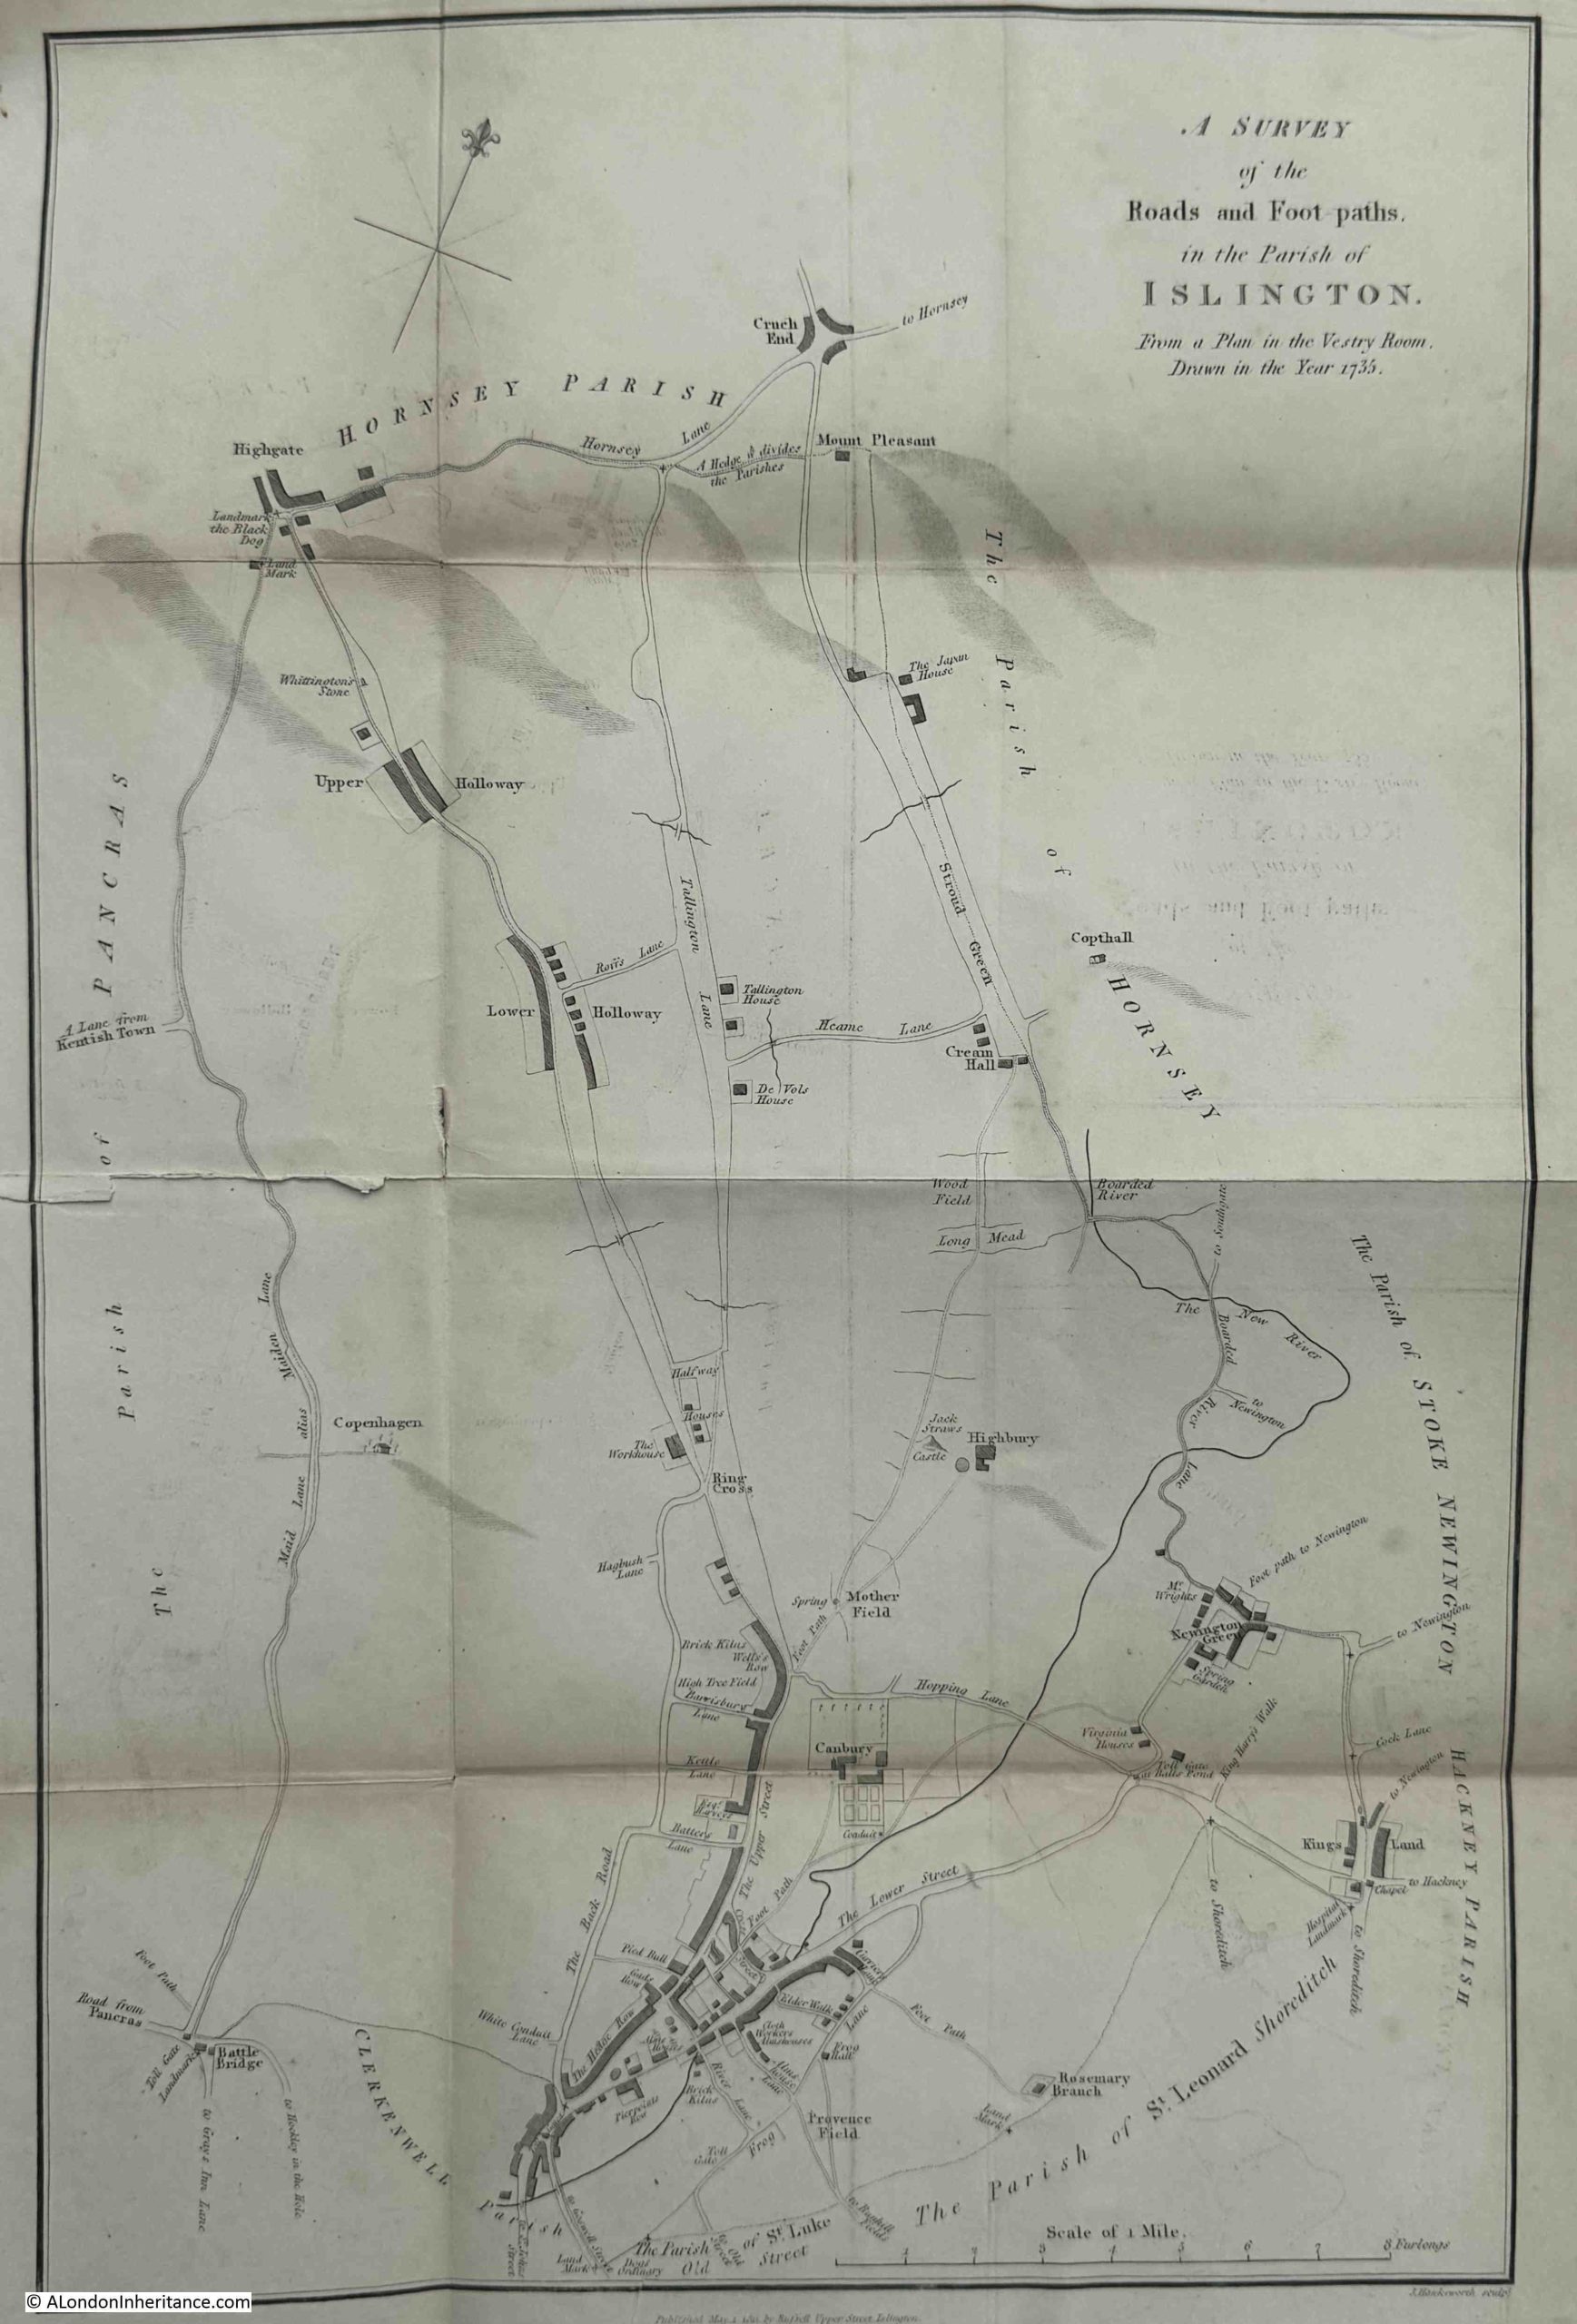
There is not that much on the map, no network of streets, large blocks of land owned by religious institutions etc. but what the map does show is how London has changed in 300 years. From an area where tiny little hamlets could still be found among the fields, where the New River, in 1735 over a century old, wound through the landscape, and where the layout of the core of Islington around the Angel, is the same then, as it is today, as shown in the following extract:
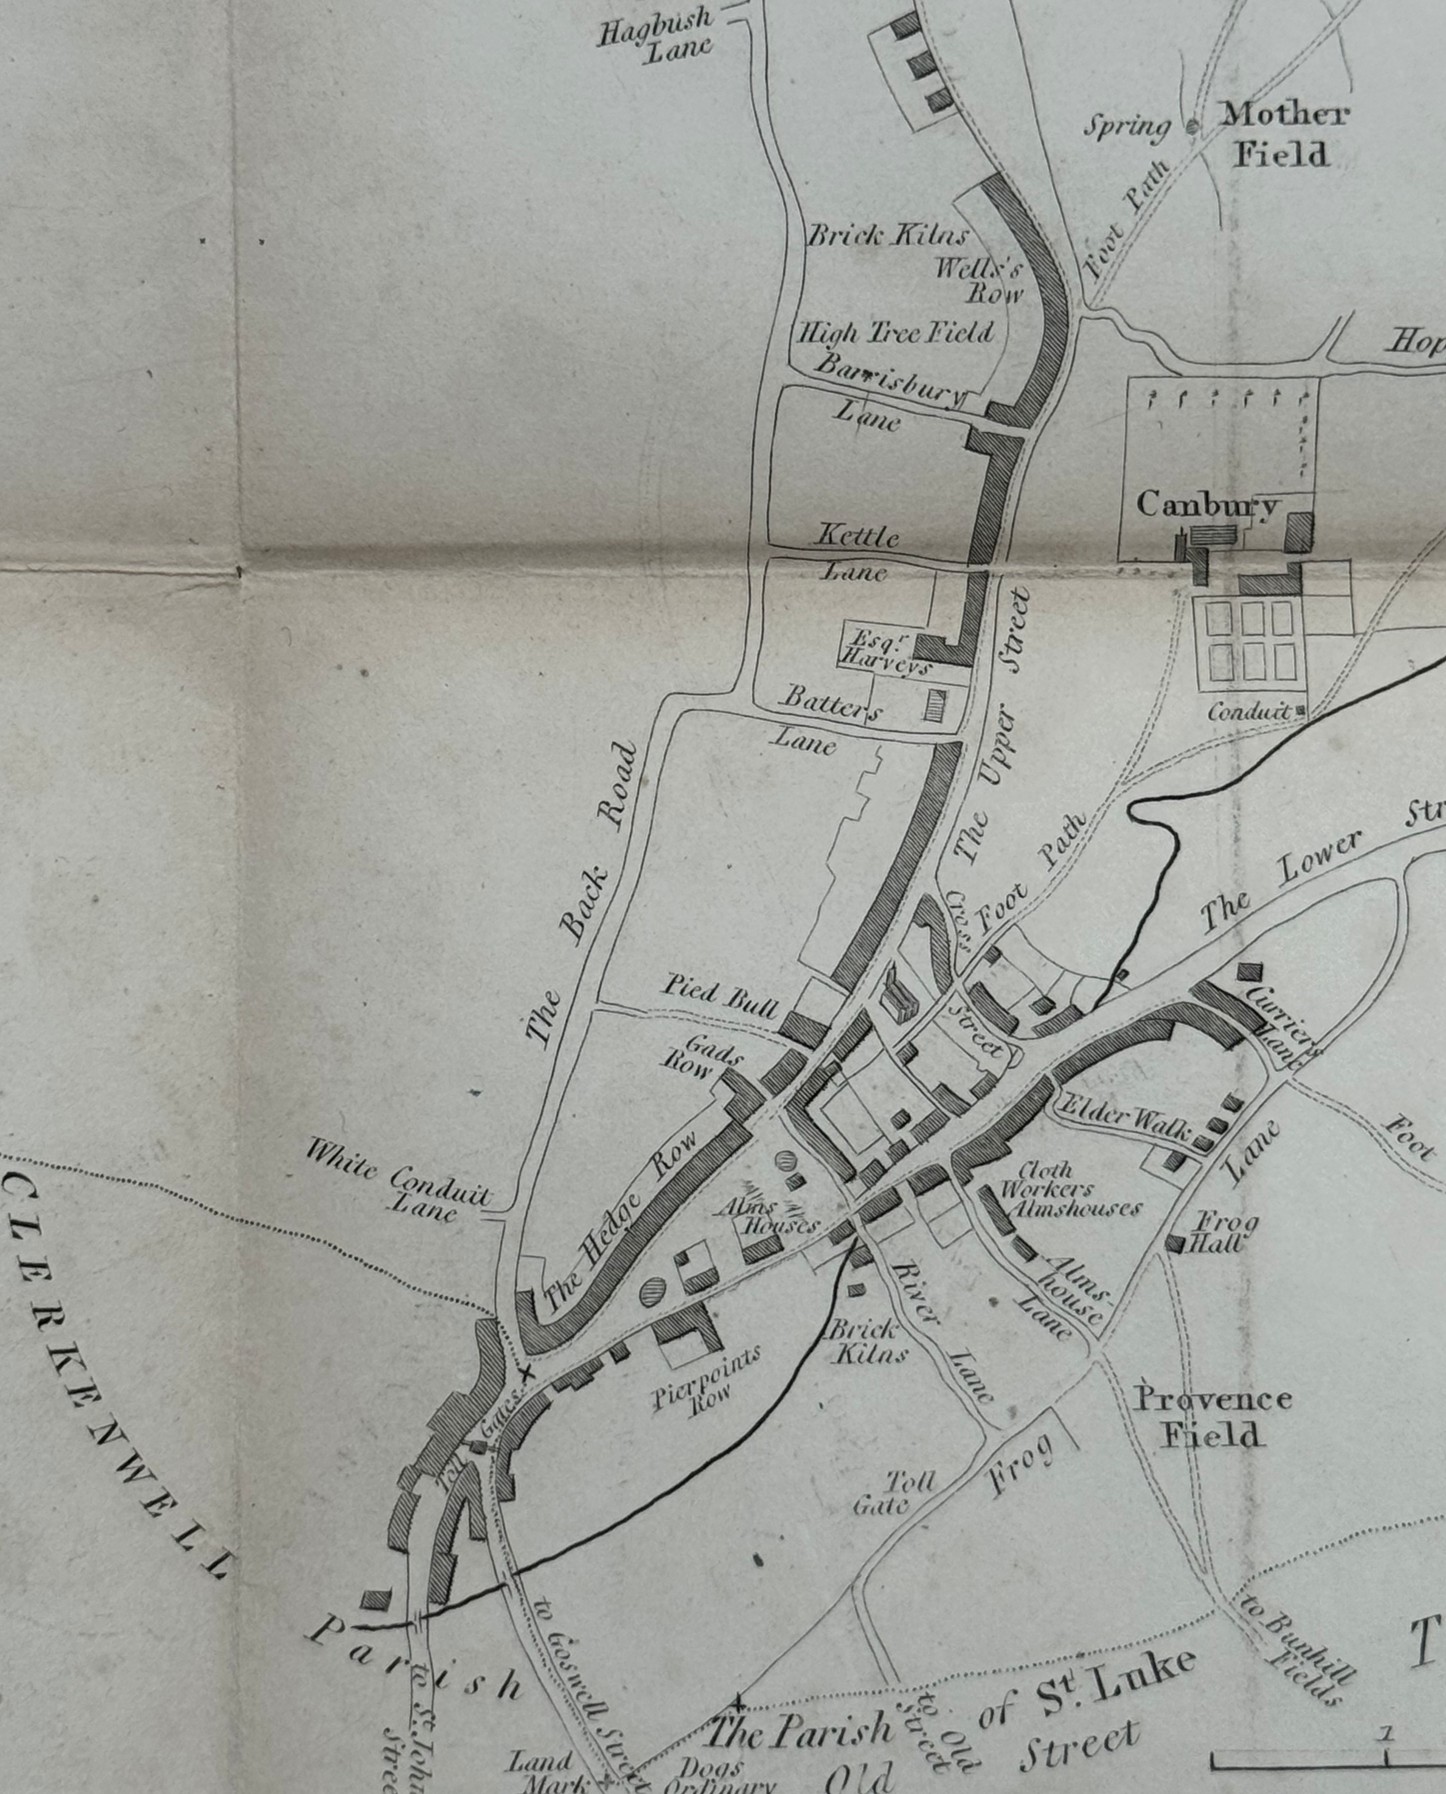
There is the same triangular arrangement below Hedge Row towards the lower centre of the map, and area which today is Islington Green.
Upper Street has the same name today, also known as the A1, and for long a major road from London to the north, and Lower Street to the right is now Essex Street.
Many place names remain to this day, but have been transformed from small hamlets, for example Newington Green:
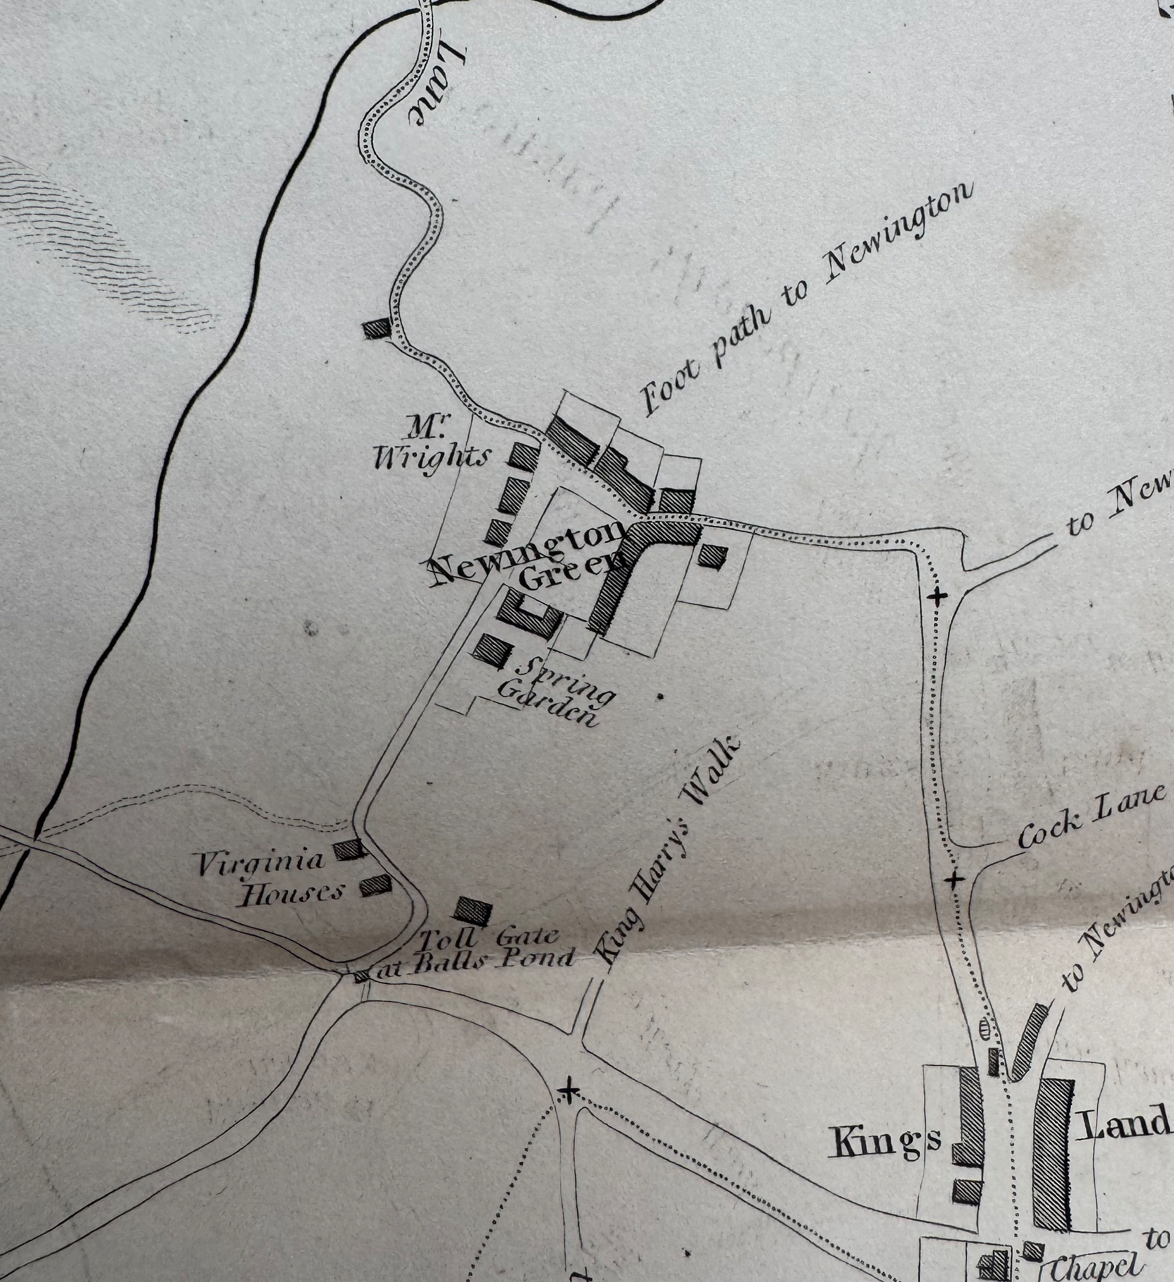
Newington Green is interesting, because we can still see some of the features of the streets today.
In the above extract, the houses of Newington Green are clustered around a central green. From the lower left of the green, a road runs south, but then curves around Virginia Houses.
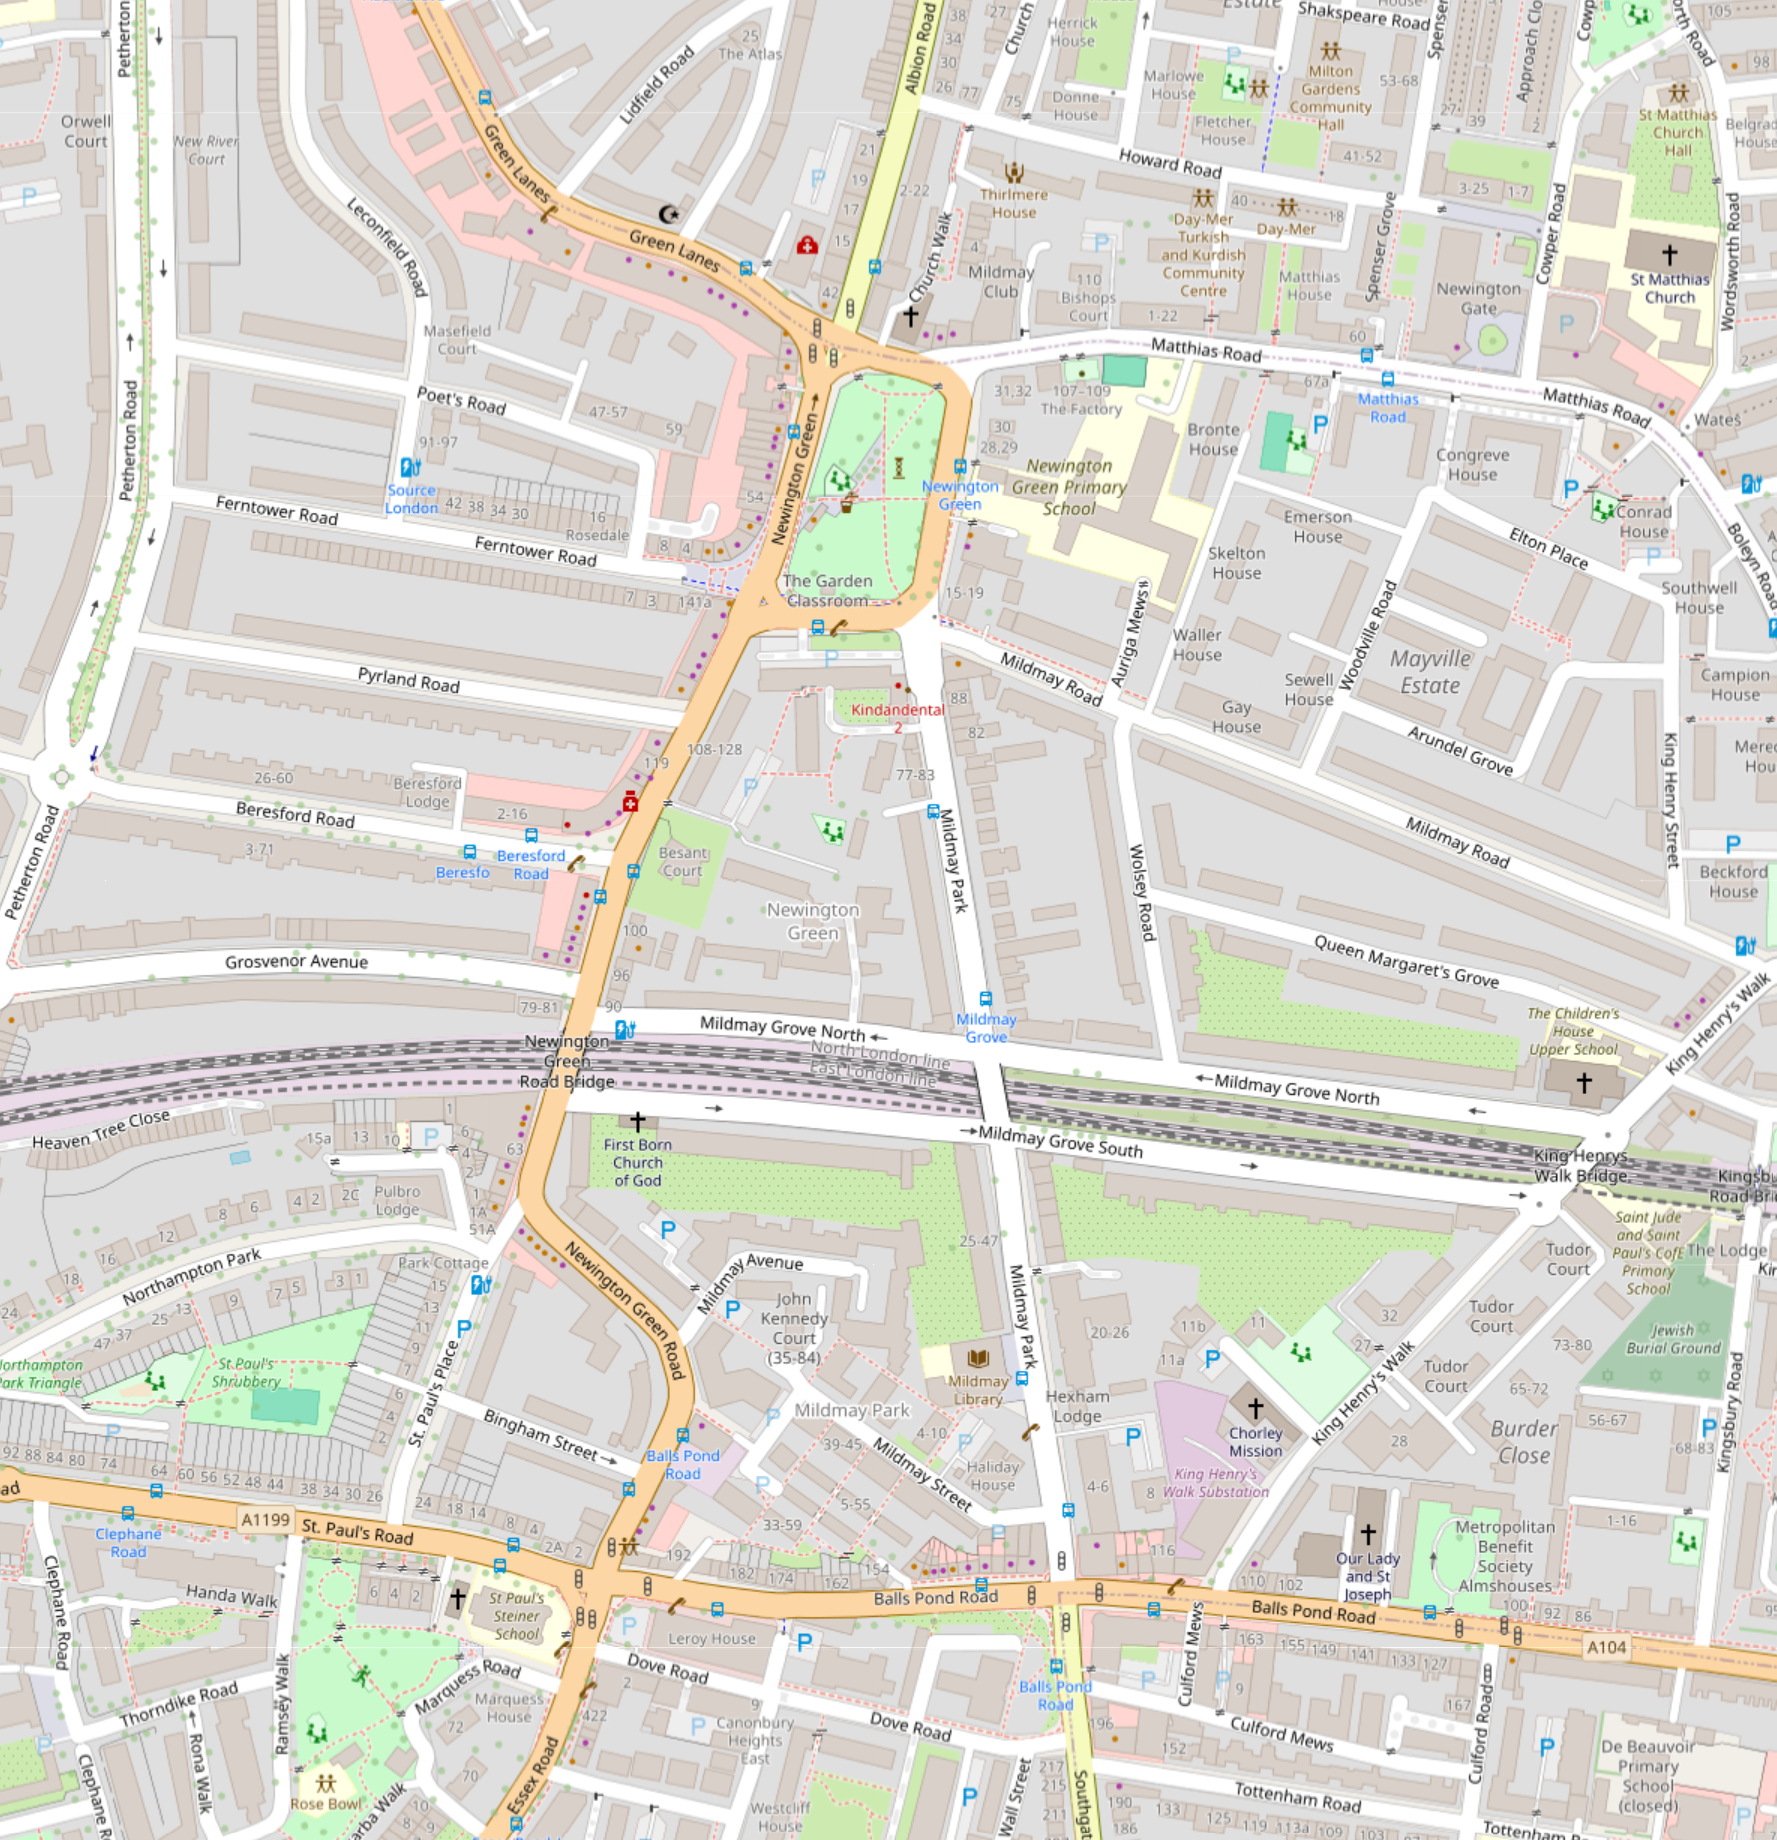
If we look at the map day, there is still a central green, at the heart of Newington Green (upper centre of the map. Follow the road that runs from the lower left corner, and after it passes under the railway lines, it follows the same curve (allowing for some straightening over the centuries, as in the 1735 map, down to the junction with Balls Pond Road. so this curve of Newington Green Road is probably down to the boundaries of the Virginia Houses properties:
Other hamlets that have been transformed into landmark place names of today include Highbury:
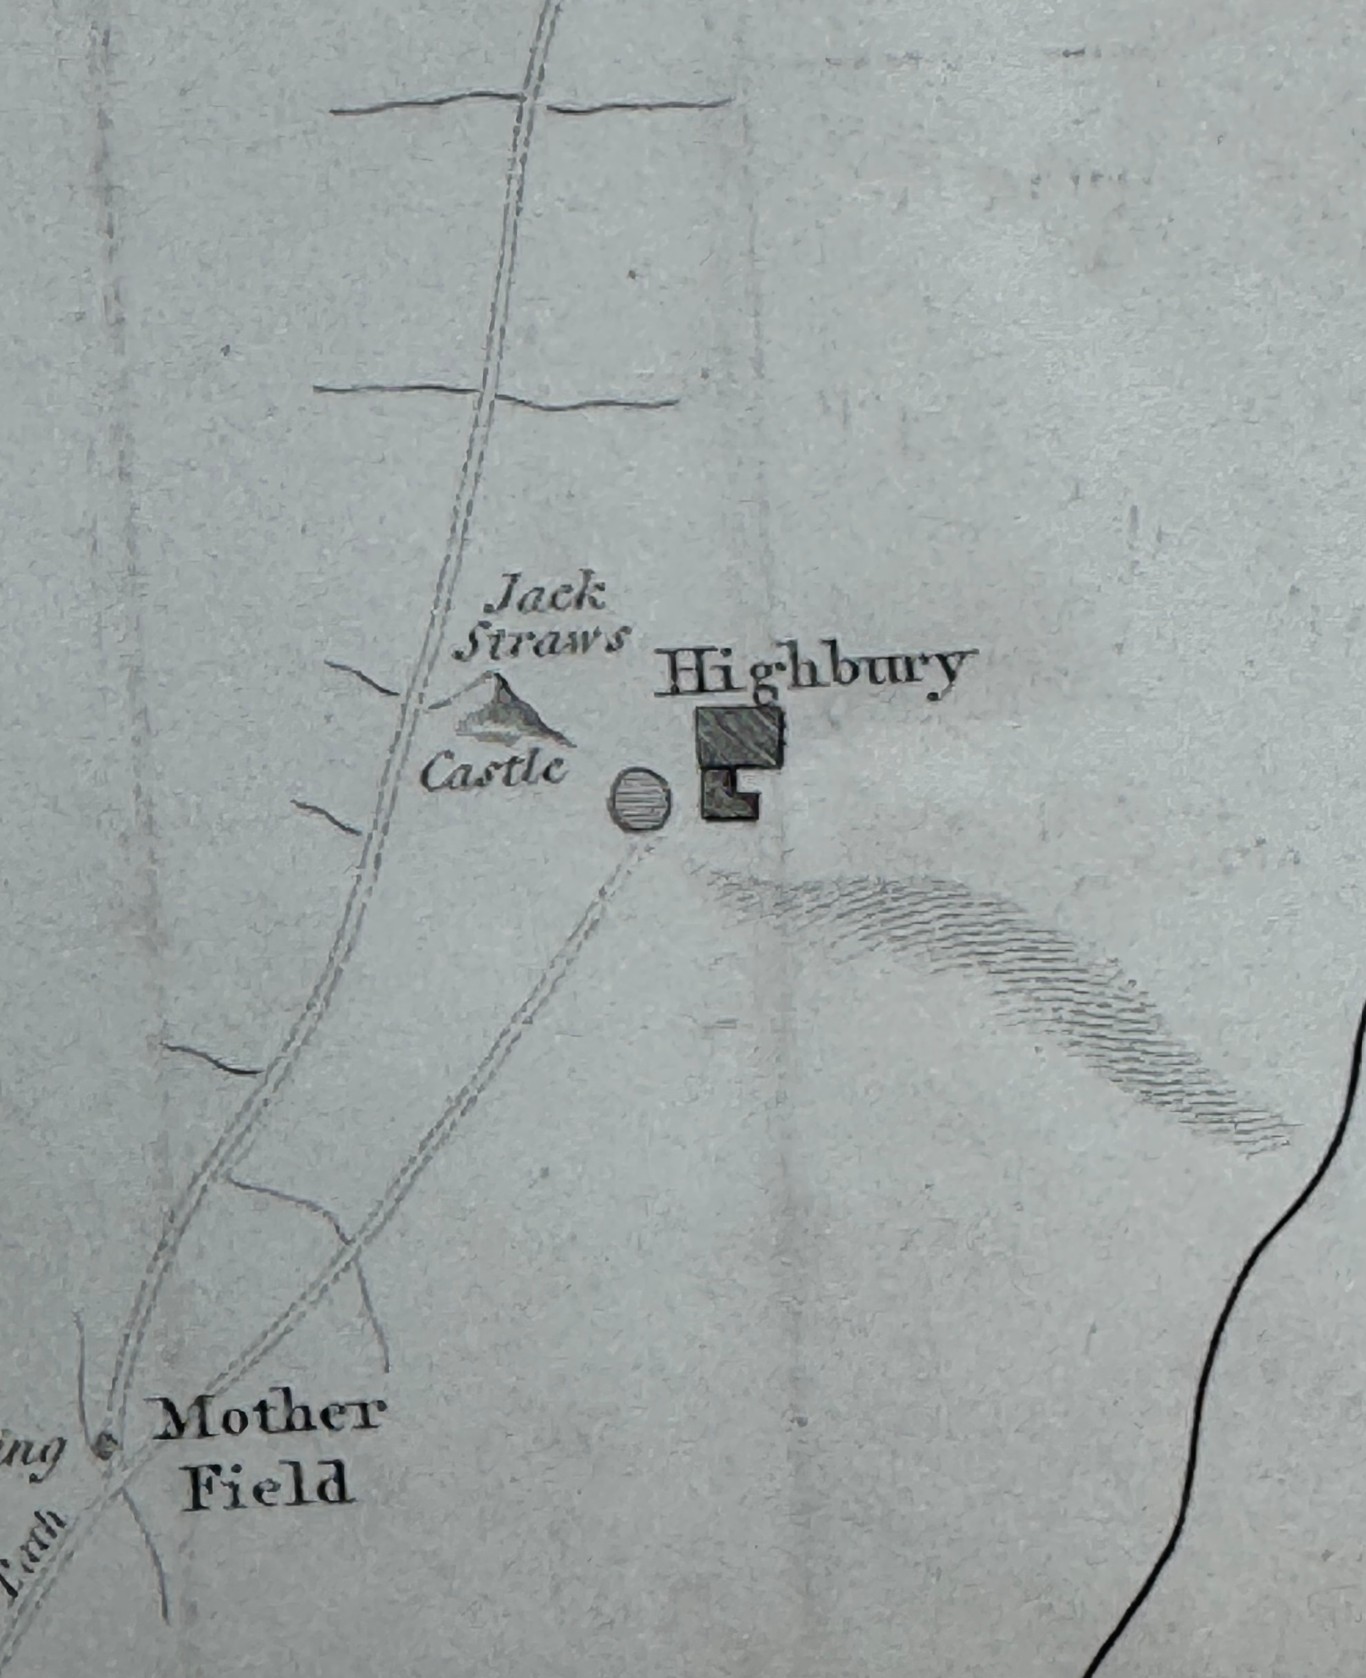
There is a feature by the name of Jack Straws Castle to the left of Highbury. The book provides the following explanation for the name:
“The haughtiness and ambition of the knights Hospitallers, and the excessive riches that they accumulated, gave such offence to the community at this period, that in the insurrection under Wat Tyler, A.D. 1381, after totally consuming with fire their magnificent priory in St. John’s Street near Smithfield, causing it to burn by the space of seven days together, and not suffering any to quench it, a detachment of the mob proceeded with the same intention to the Prior’s country house at Highbury. Jack Straw, one of the leaders, appears to have headed the party engaged in tis affair, the number of which, as we are informed by Holinshead, was estimated at 20,000, who took it in hand to ruinate the house, from which circumstance, and having perhaps made the spot a temporary station for himself and his followers, the place was afterwards called Jack Straw’s Castle, by which name it continues to be known to the present day.”
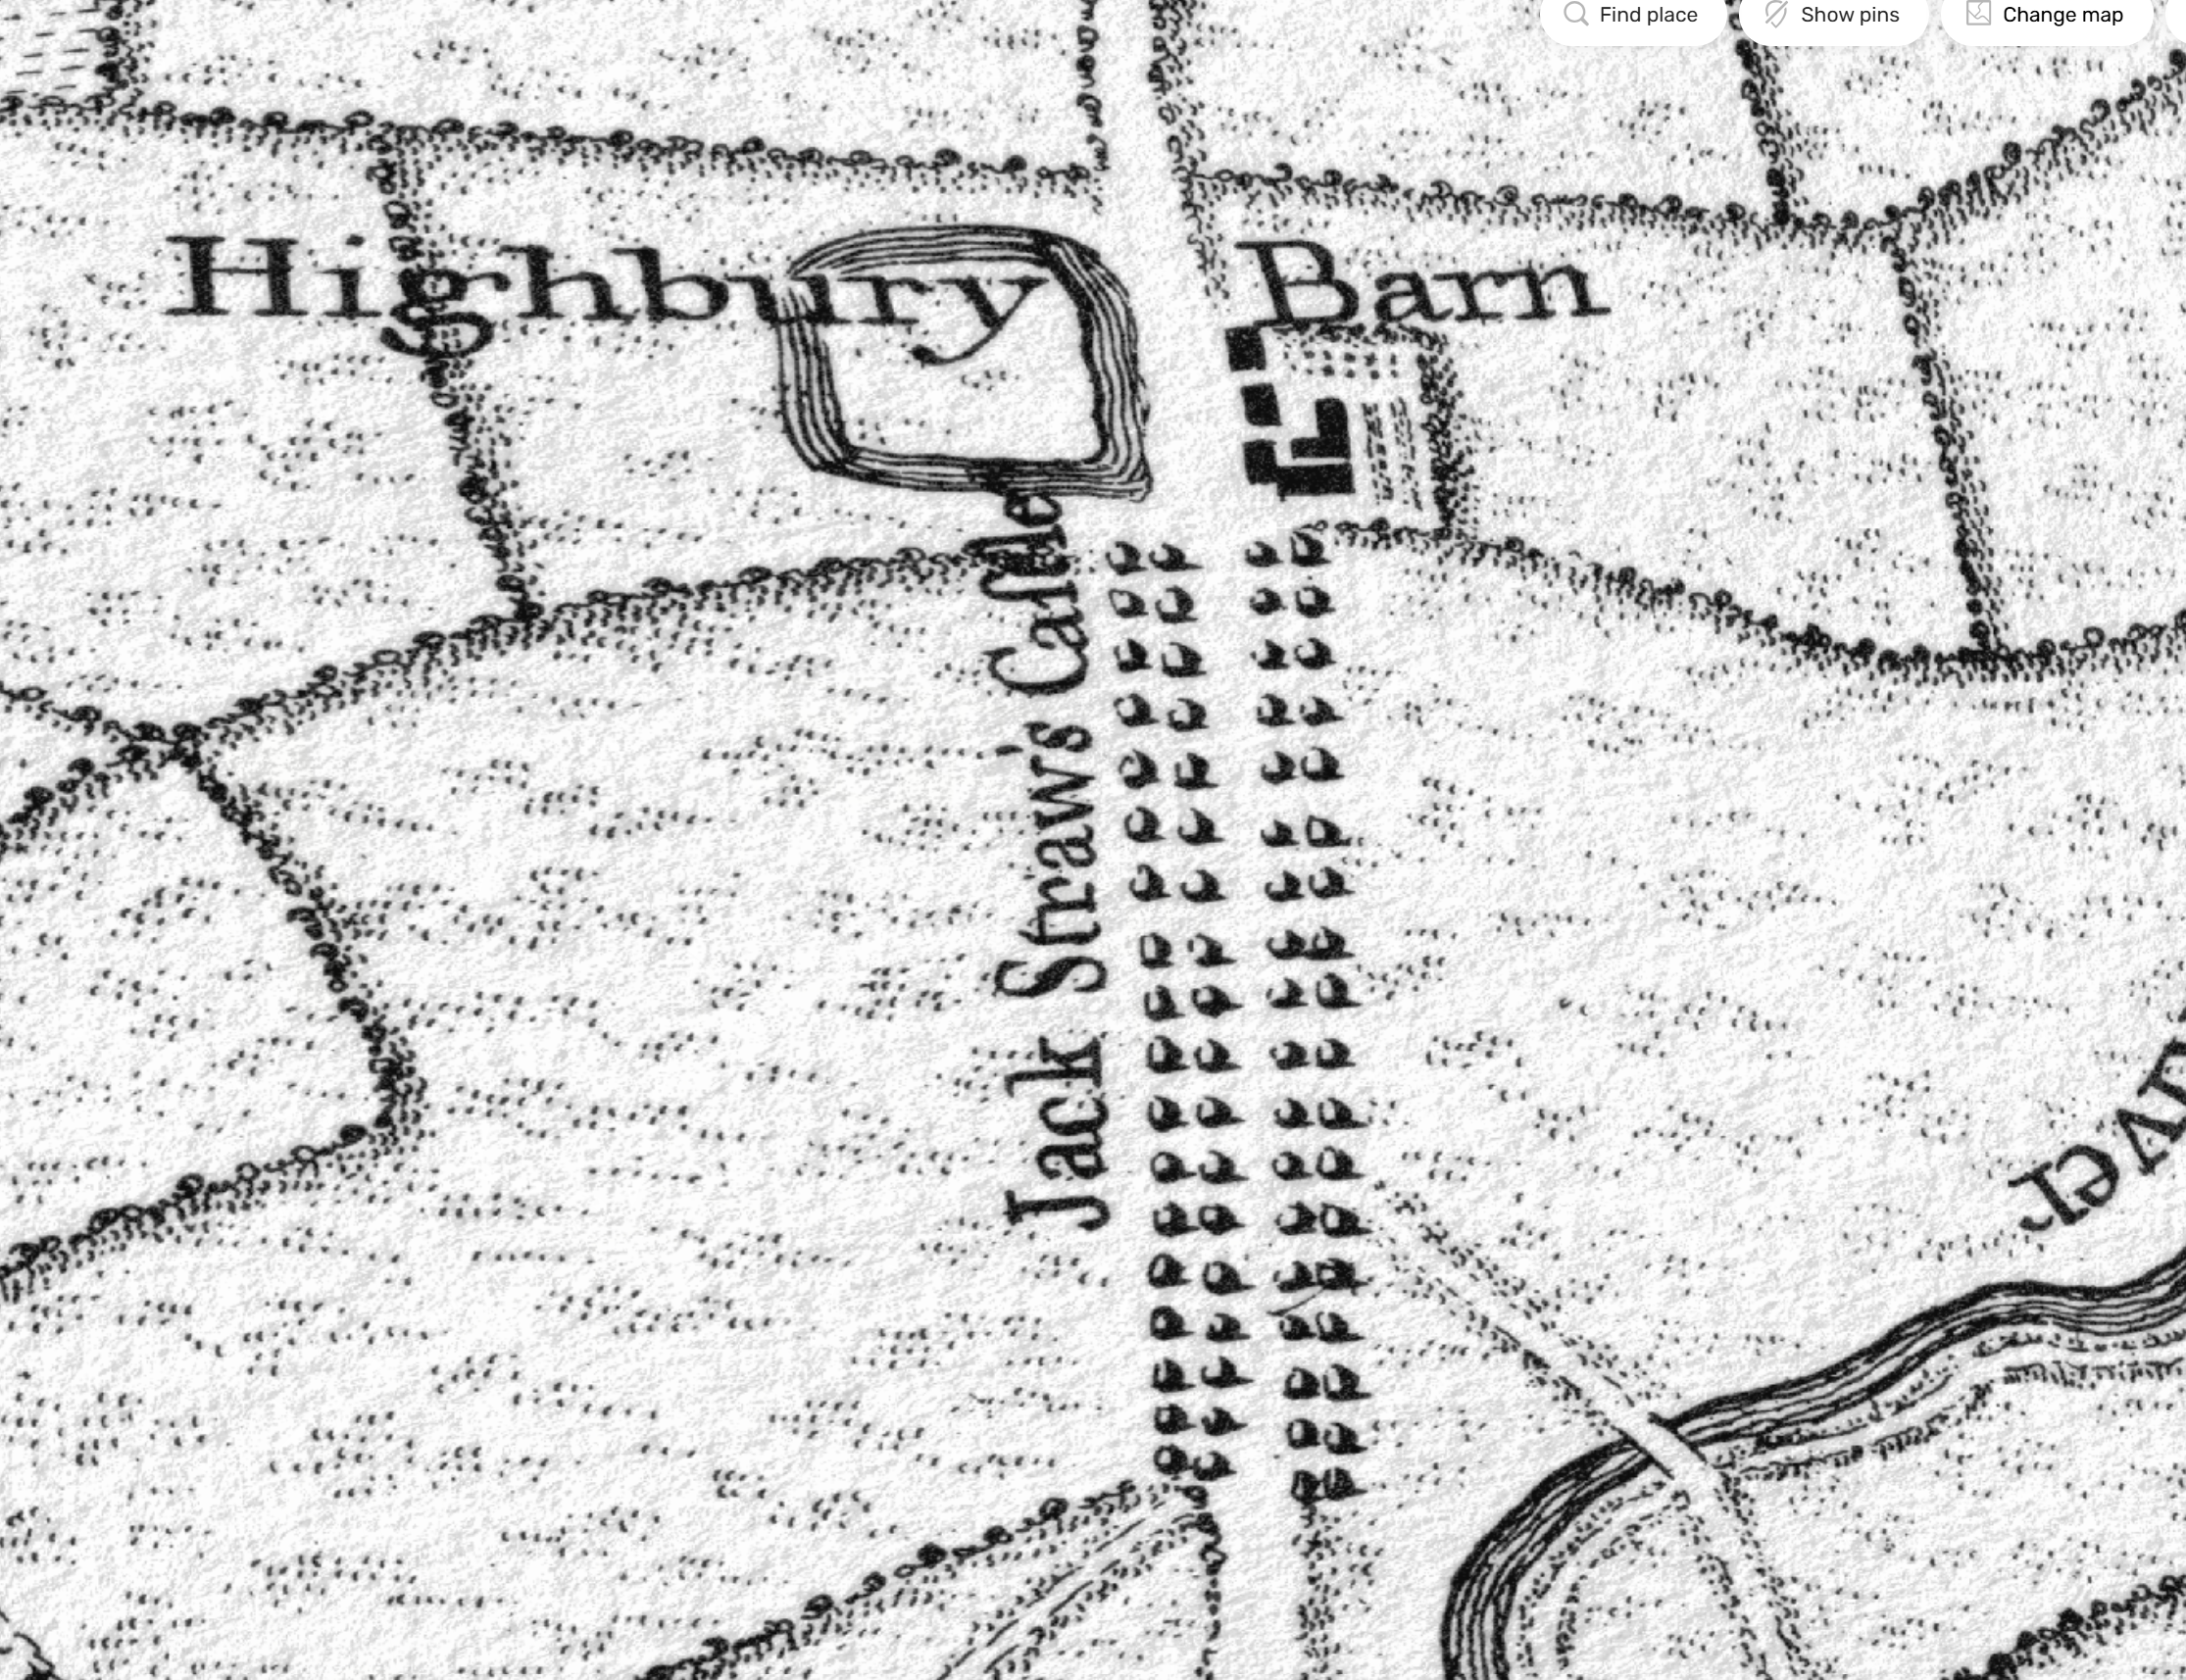
In Rocque’s map of 1746, the tree lined route to Jack Straw’s Castle today is Highbury Grove and the name Highbury Barn is still used for the pub at what was once the core of Highbury, long before the name became associated with a football club that had moved from Woolwich Arsenal in 1913:
From the roads and footpaths of Islington, we head south to:
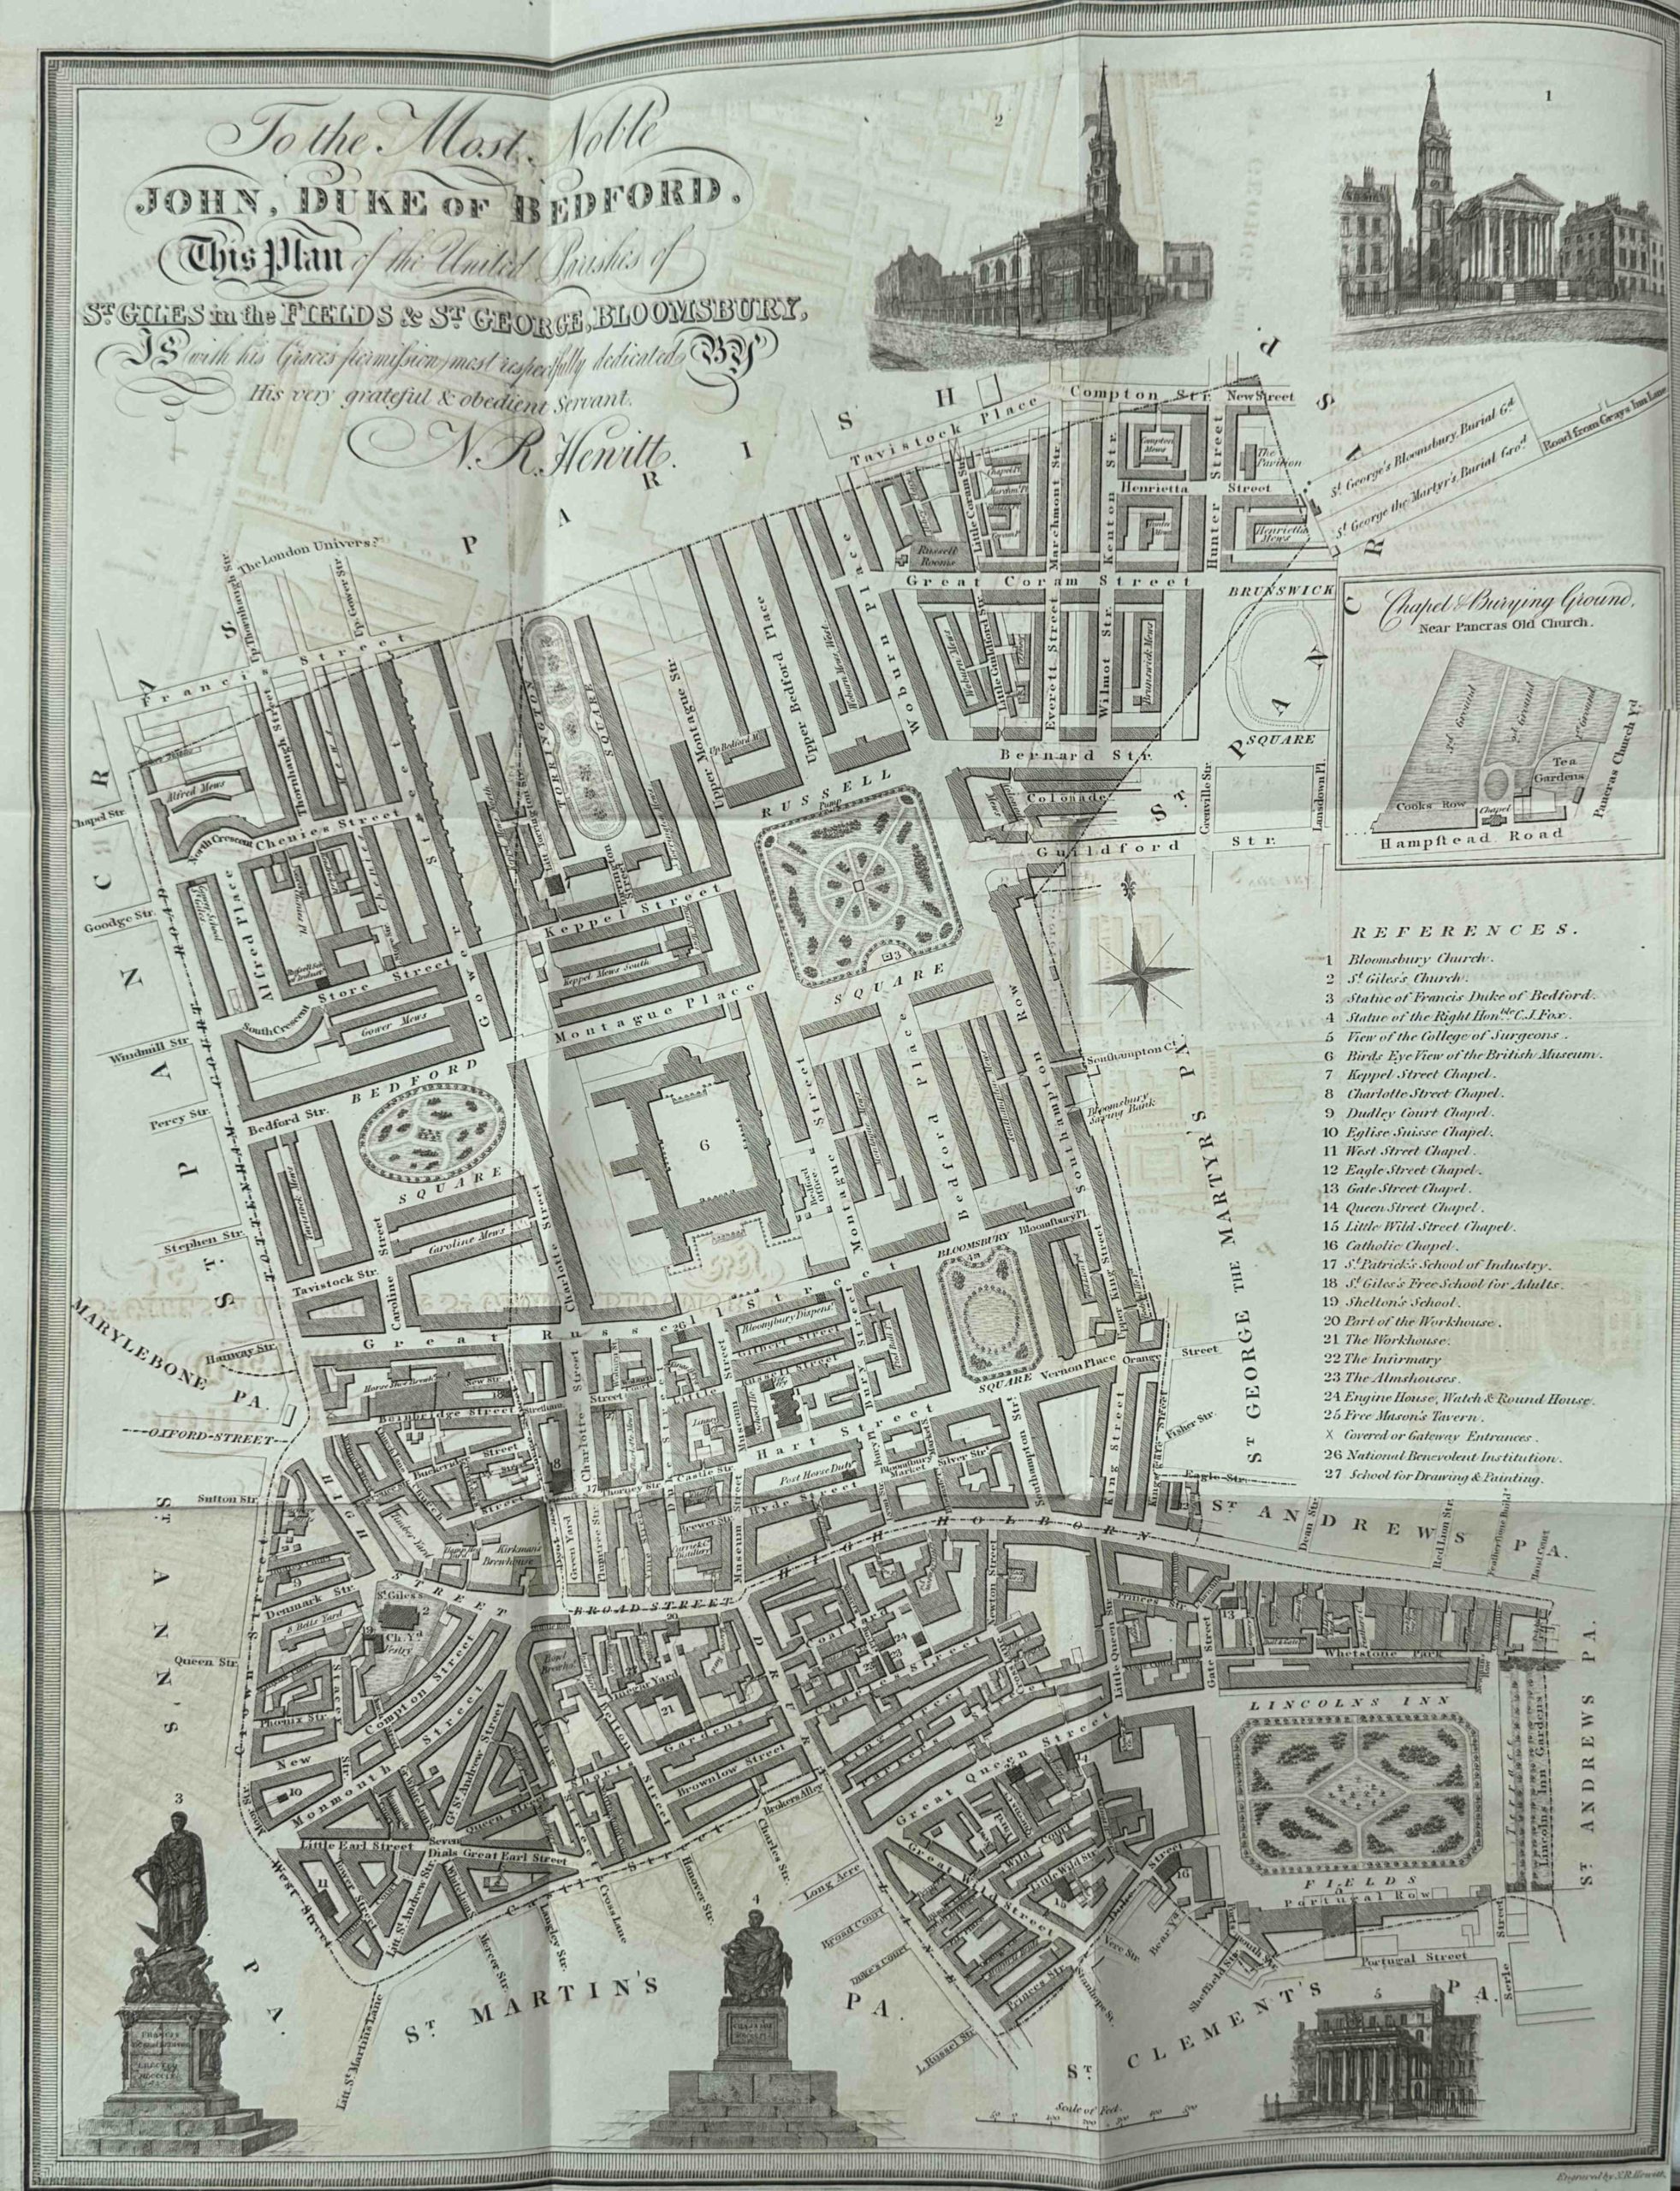
The History of the United Parishes of St. Giles in the Fields and St. George Bloomsbury
This book by Rowland Dobie and published in 1829 states that it combines “strictures on their parochial government, and a variety of information of local and general interest”, and it also includes a delicate, fold out map:
This book is interesting, not just for the historical content, but also it is a book with an agenda.
The preface to the book starts with the following paragraph:
“In the early part of 1828, an Association was formed in the United Parishes of St. Giles in the Fields and St. George Bloomsbury, for the laudable purpose of investigating and correcting the abuses which had too long prevailed under the government of a Select Vestry, possessing no claims to power but what was founded on assumption and usurpation.”
Local politics have long been a place of disagreement and controversy.
It seems that a Mr. Parton, the late clerk of the Vestry of the parishes had collected material for a historical account of the parishes, which was published in an imperfect states after his death.
Although he could not defend himself, the author of the book with the map, goes on to state that:
“Occupying a station both lucrative and influential, Mr. Parton too frequently forgot the impartial province of the historian in his zeal for advocating the cause of the assumed Vestry under whom he held his appointment.”
1829, the year of the book’s publication was also the year when the “pretended select Vestry” of St. Giles was overthrown in a Court, which Rowland Dobie, the author of the book, celebrated in his preface, as an act which would “establish the long-lost rights of the parishioners of St. Giles”.
Returning to the map, and we can see how the combined parishes had developed.
The area south of Great Russel Street was of older streets, whilst to the north there is the more formal development of the land owned by the Duke of Bedford, where we see with more widely spaced, straight streets.
If the map was completed shortly before the publication of the book in 1829, then the map shows the newly completed British Museum, following the demolition of Montague House which had been on the same site, and had been the first home of the British Museum from 1759.
Many of the sites within the map are numbered, and at number 21 (in the centre of the following extract) was the Workhouse, where the poor and needy of the parish would have ended up
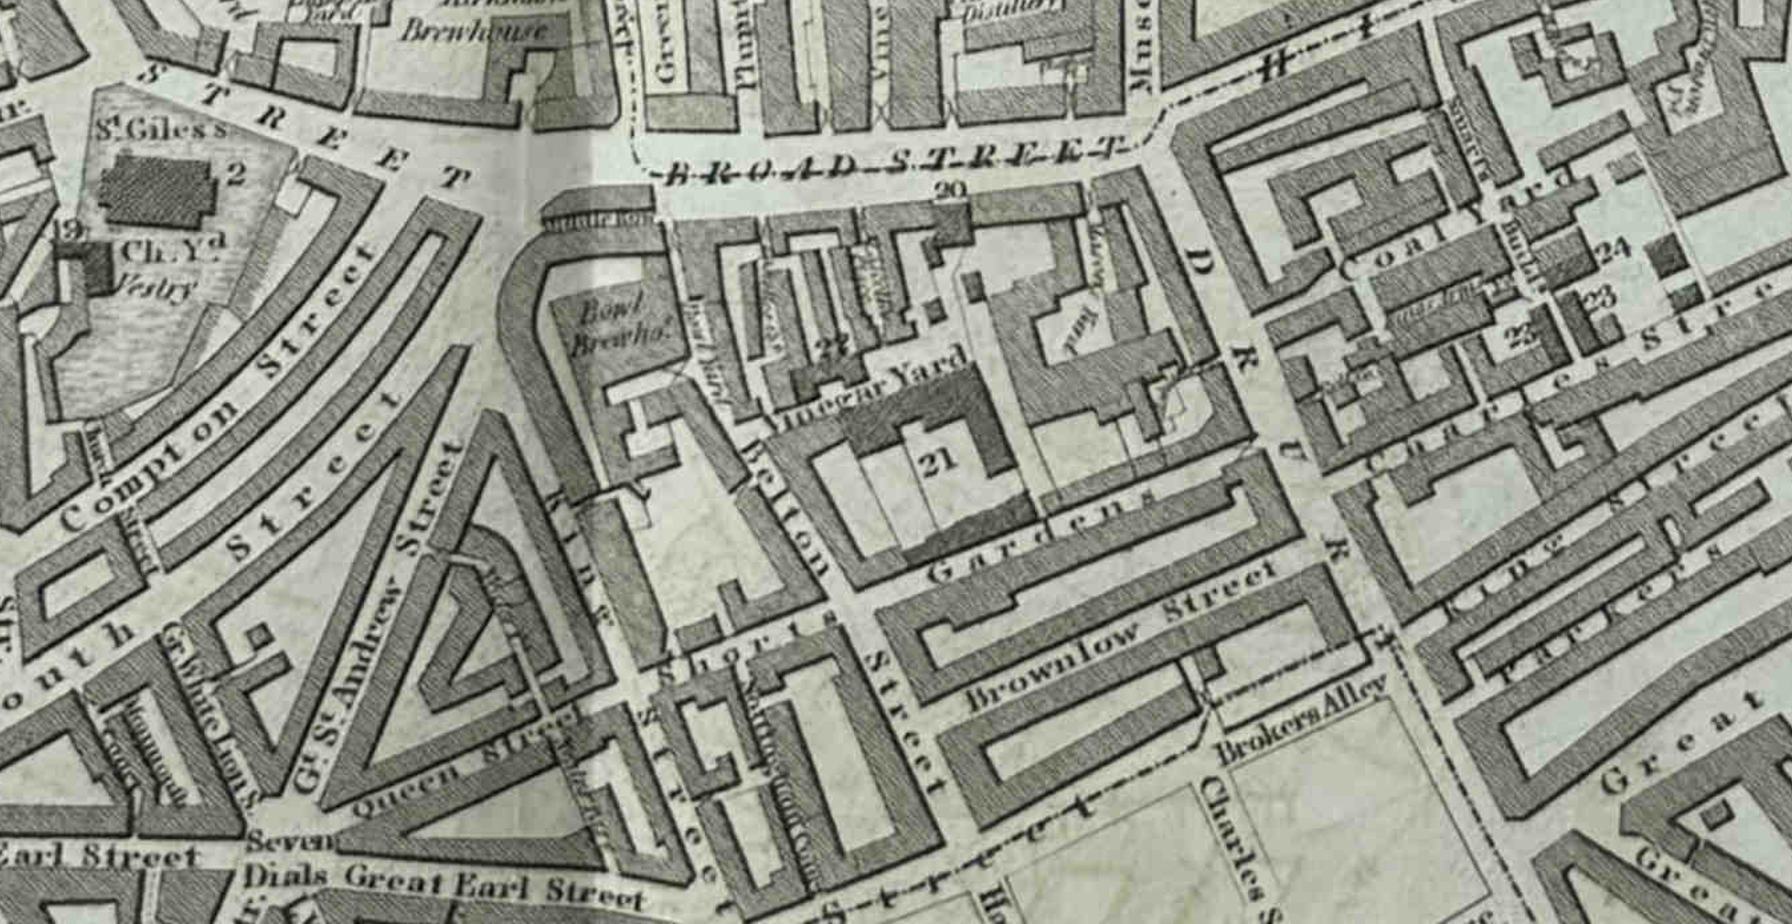
The Workhouse shown in the map was the second to serve St. Giles. The first had been pulled down when Seven Dials had been redeveloped. The new Workhouse was build on land purchased for £2,252 10 shillings, and would support not just the Workhouse, but also a hospital and burial ground.
The expectation was that the Workhouse would expect “the poor to be relieved amounted to upwards of 840 persons, at an expense of above £4,000 a year”. A considerable sum, and the book uses extracts from Vestry minutes to highlight the problems of raising such an amount
On the western edge of the parish was Denmark Street which led to Crown Street (at the time of the book, Charing Cross Road had not yet been formed from a widened and lengthen street we see today):
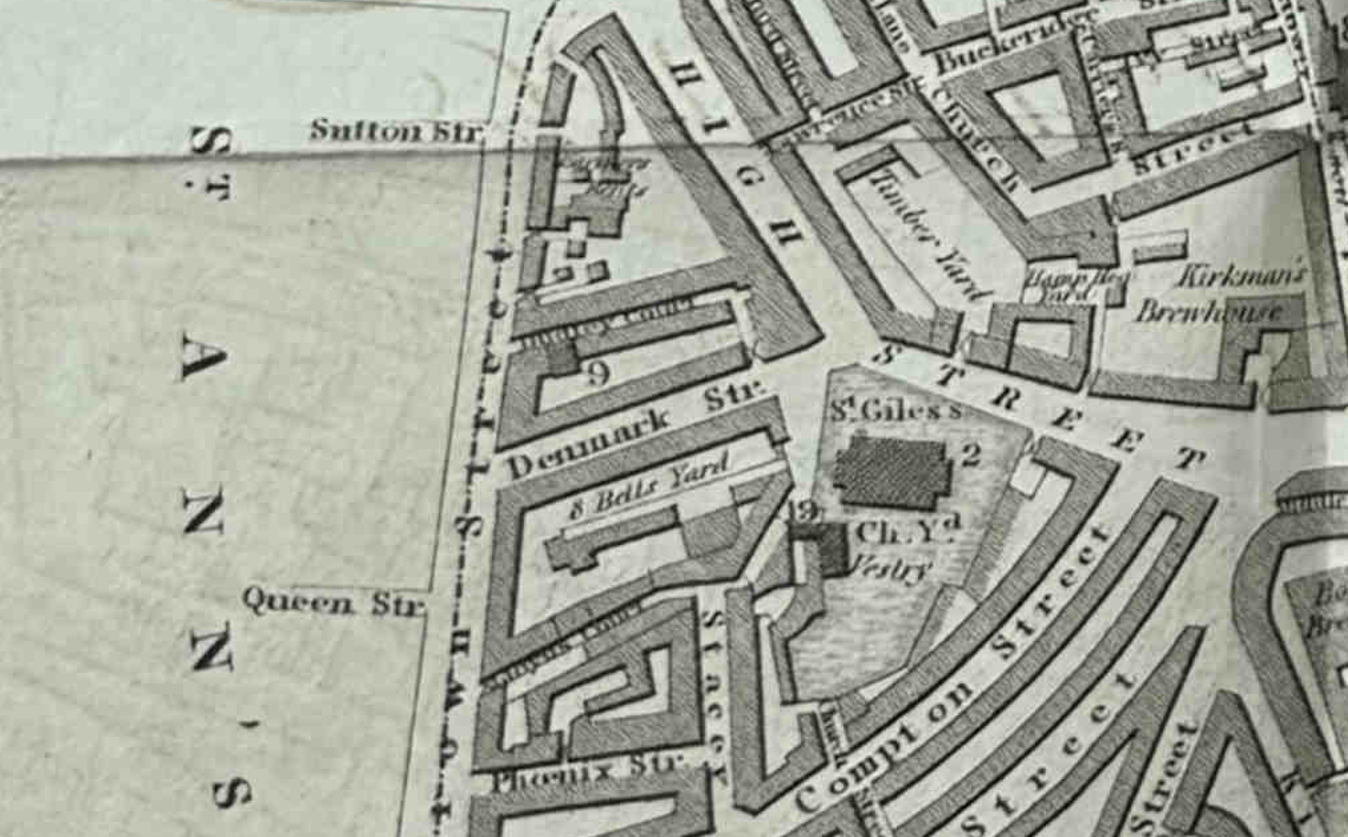
Denmark Street would later become an important player in 20th century British popular music. The street just survives today, whilst the area to the north of Denmark Street has been significantly redeveloped, included the dazzling lights of the Outernet.
Marylebone and St. Pancras. Their History, Celebrities, Buildings and Institutions
Marylebone and St. Pancras by George Clinch was published in 1890, and includes the following map showing the plan of the Marylebone estate as it was when purchased by the Duke of Newcastle in 1708, with some of the planned new streets of the developed area shown overlaid on the fields of the original estate (the eventual redevelopment would be slightly different):
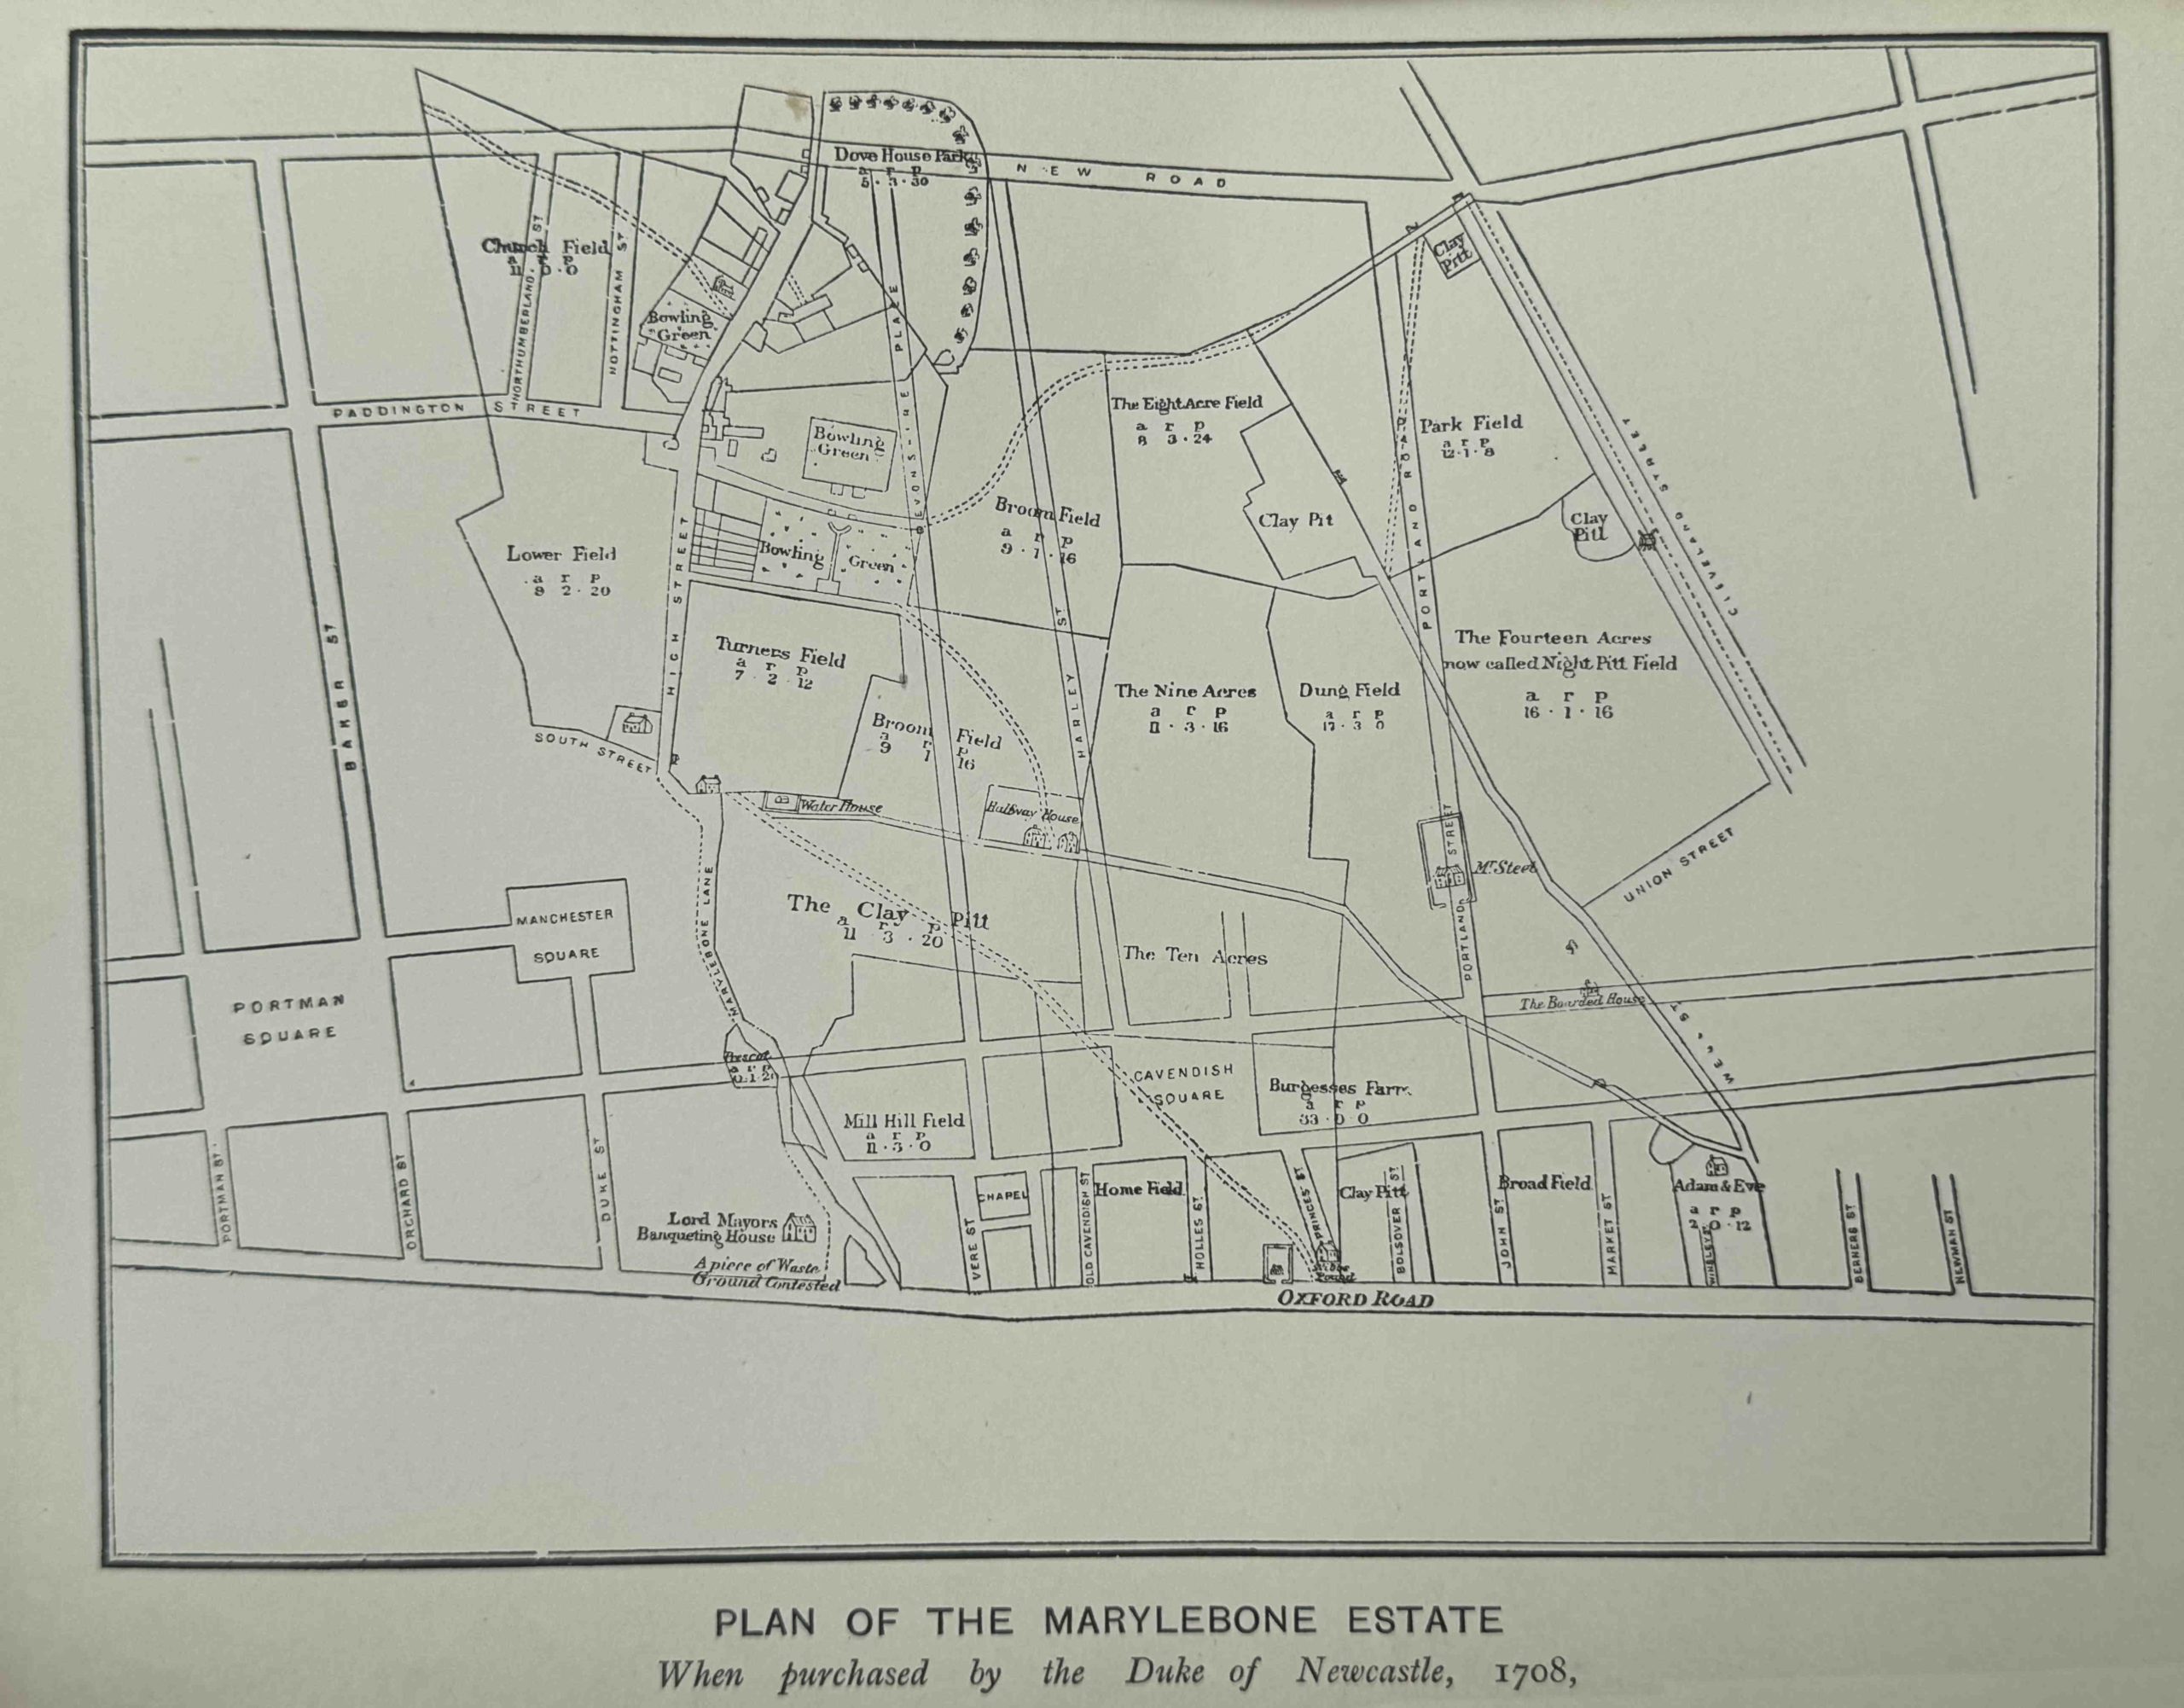
It is usually easy to see in London, whether streets were developed as part of an area development, or whether they were part of a centuries old street plan that had just followed original field or land boundaries, navigated obstacles, or followed the preferred routes for travellers.
In the above map, the new streets run straight across the fields, whilst Marylebone Lane follows a more natural route that aligns with the street’s long history.
Names such as the Clay Pitt provide an indication of what the fields were used for, with Dung Field being a rather descriptive name for the field’s use.
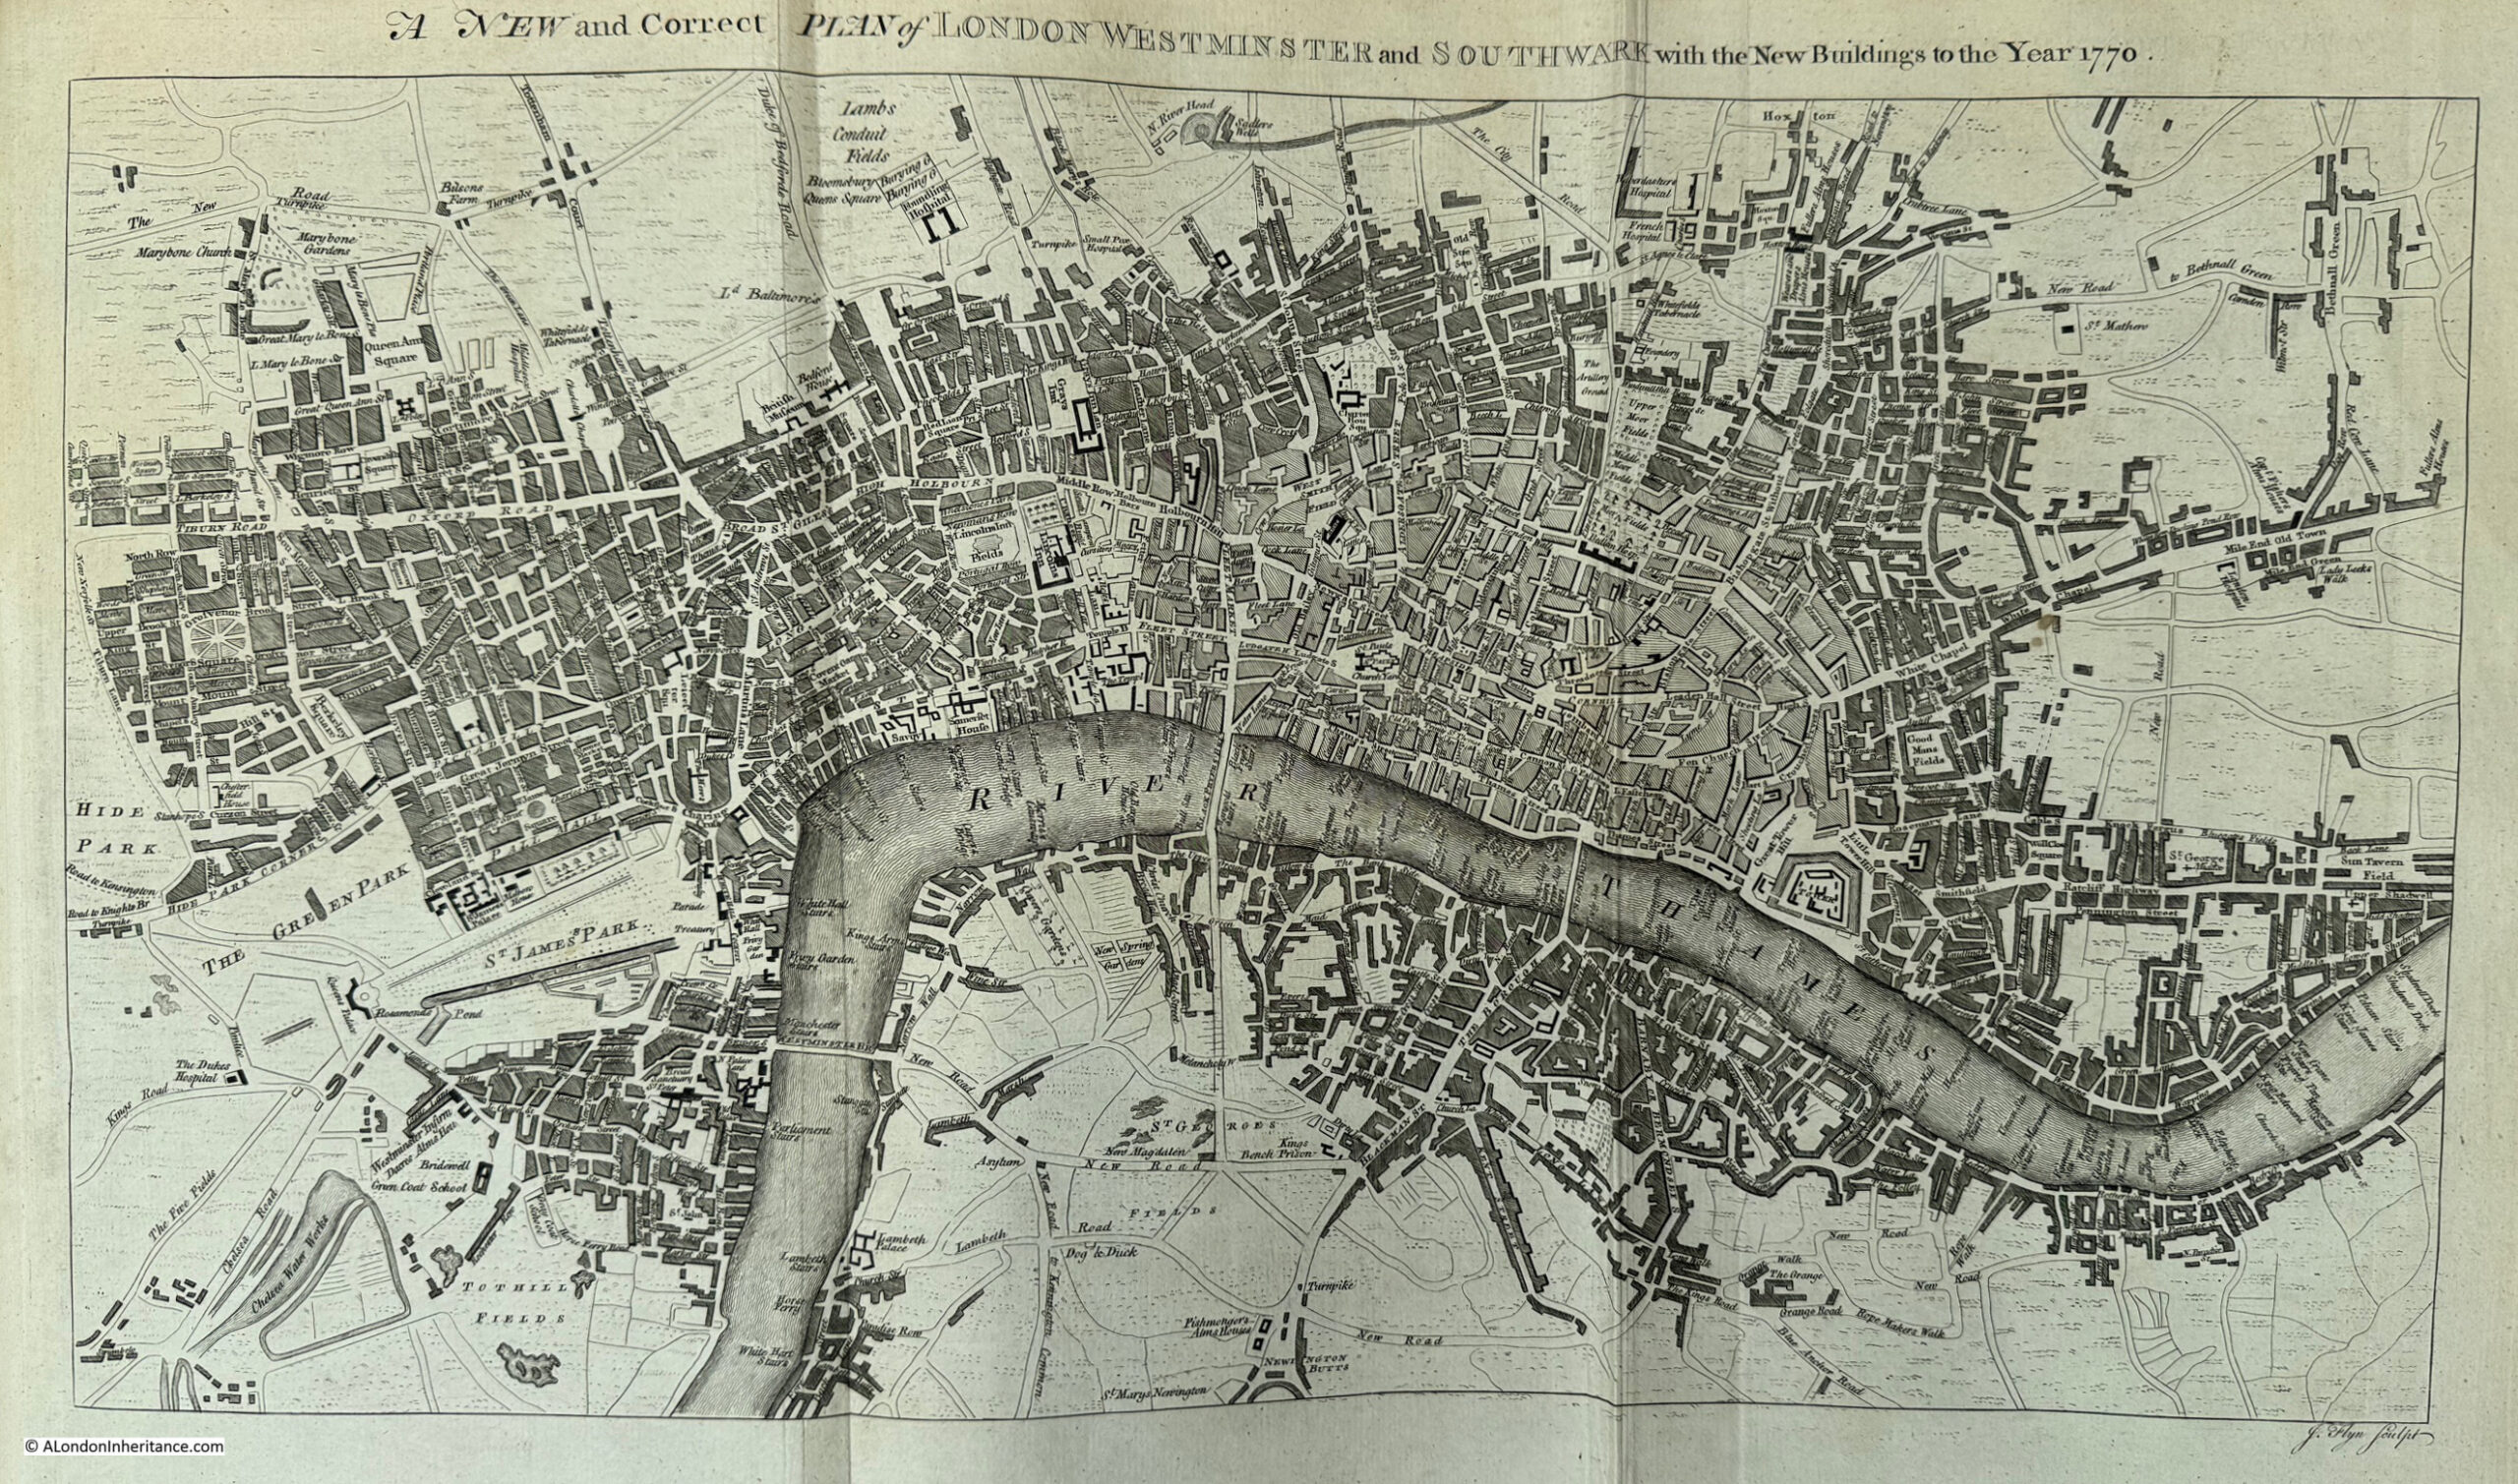
The actual development of the area is shown in the following map from the book, using Morden and Lea’s Plan of the City of London from 1732:
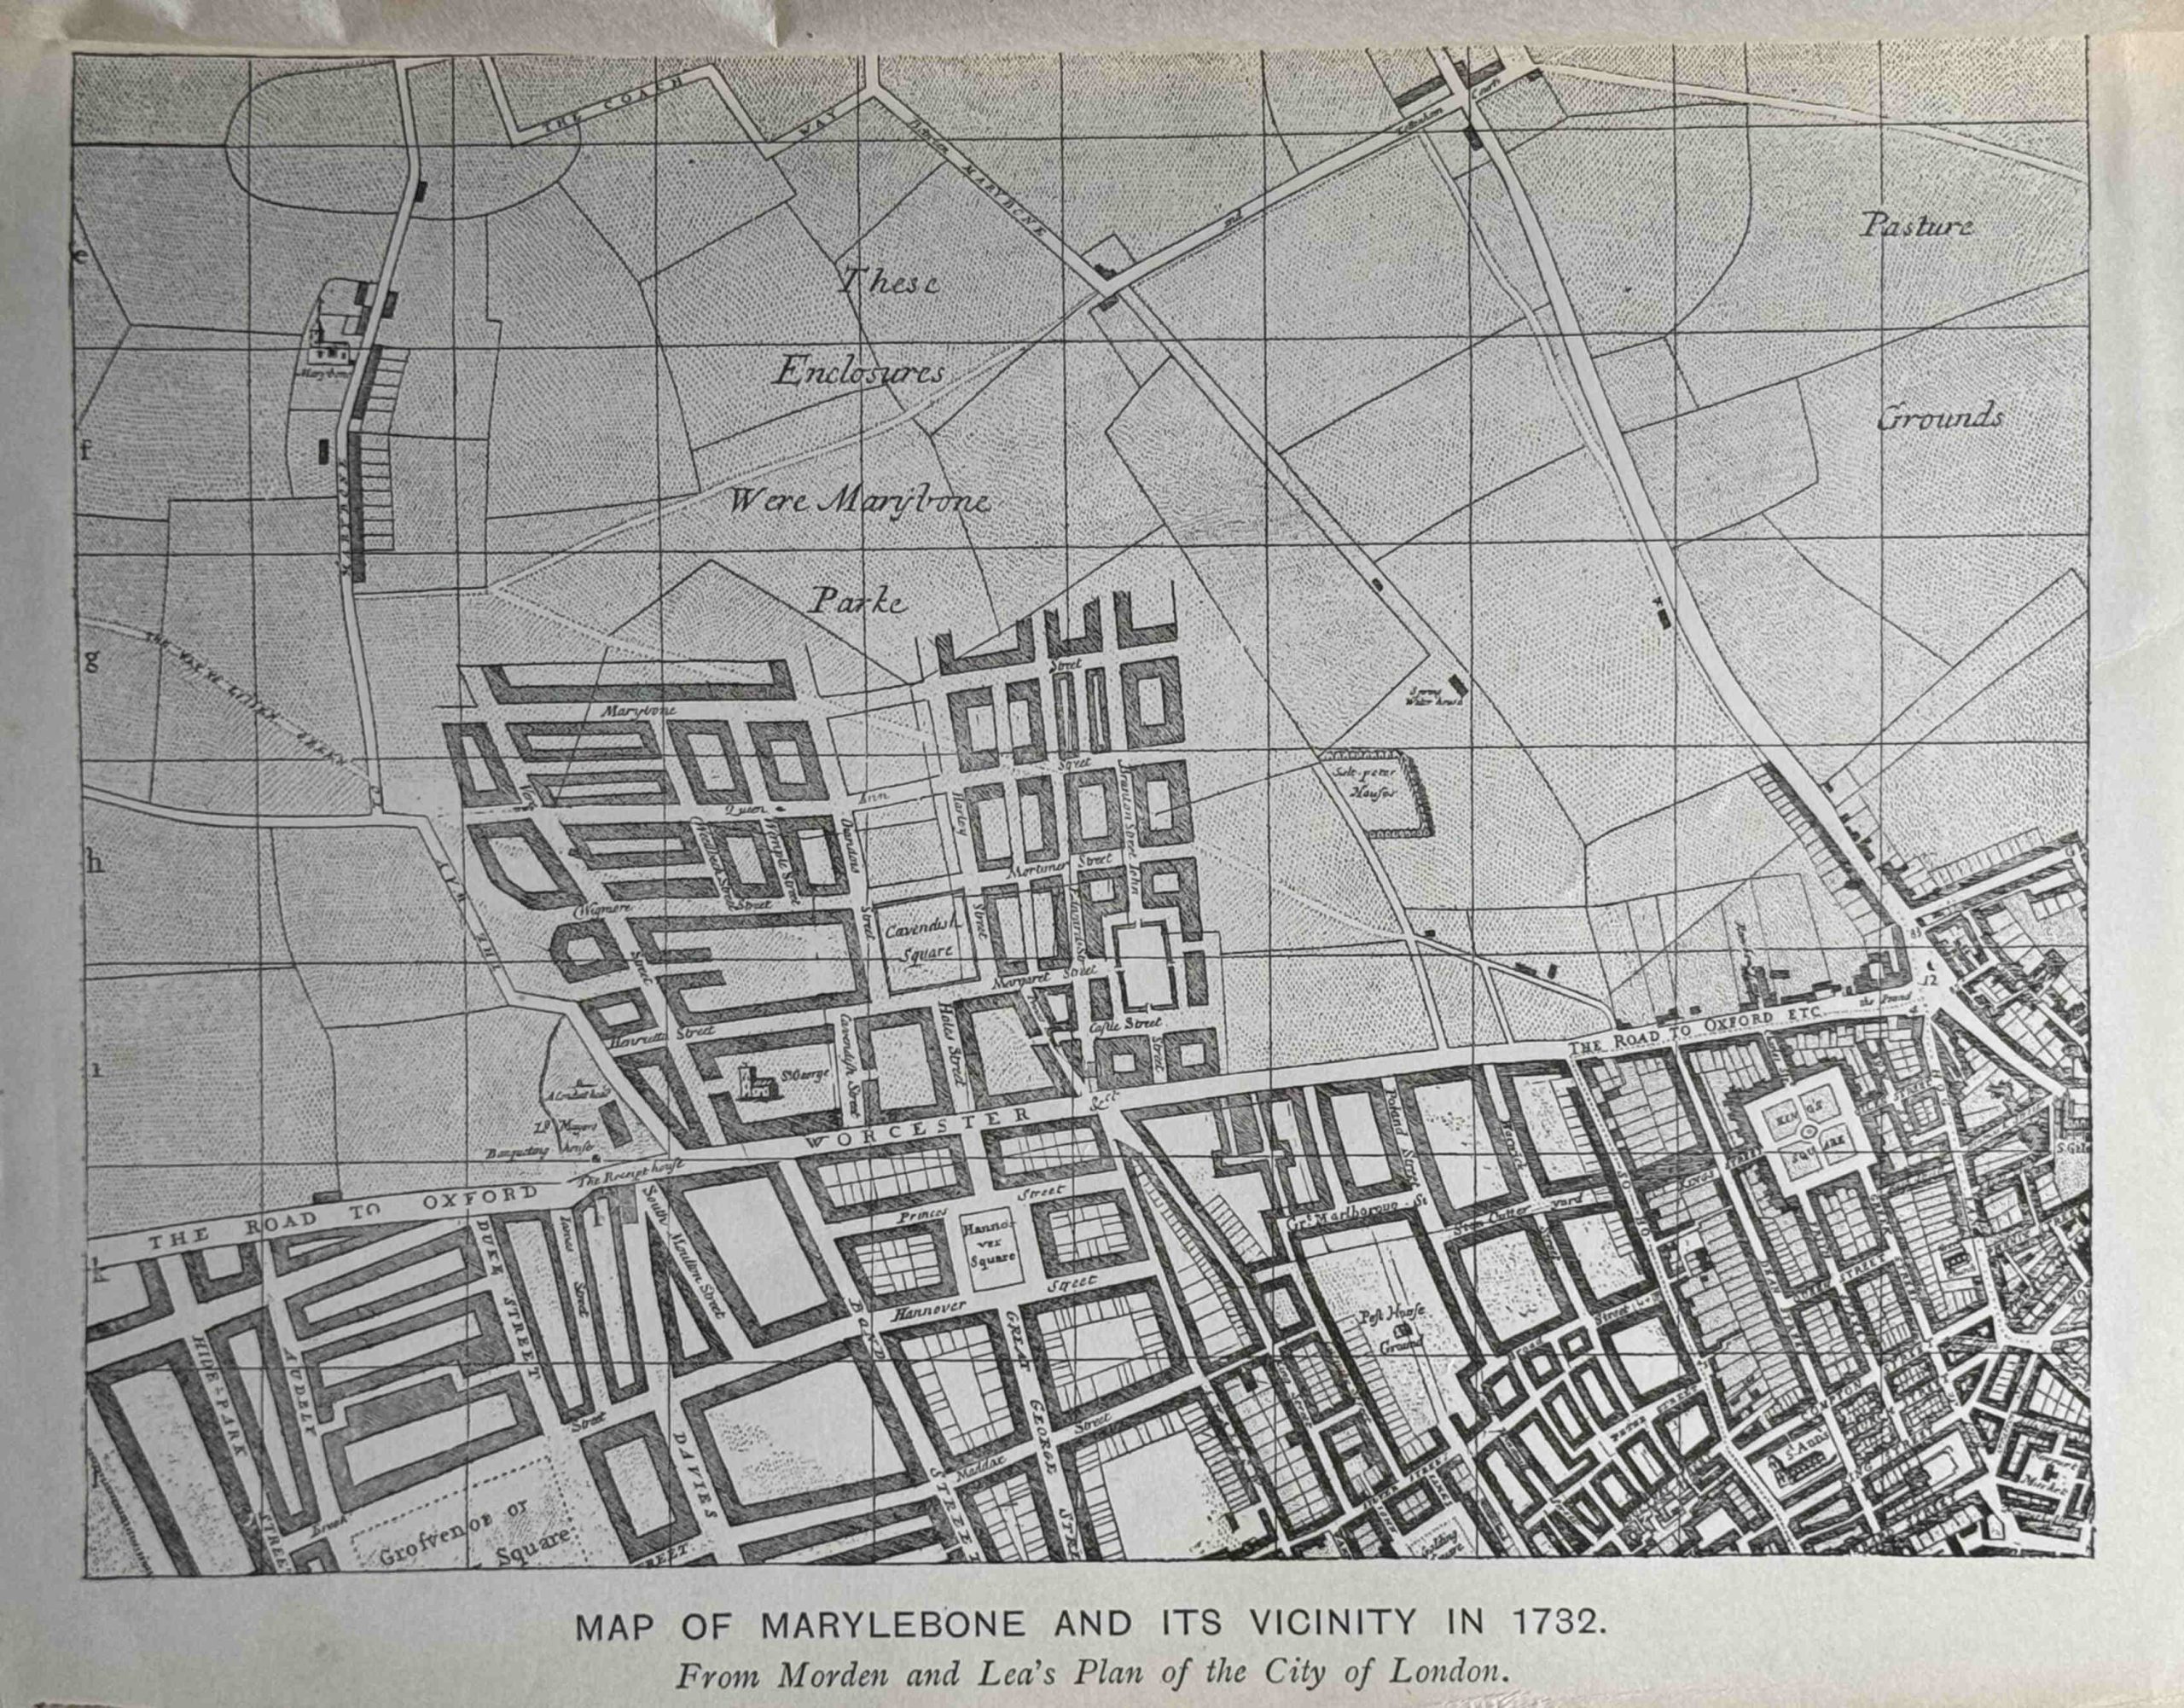
The map shows how these new estates were developed over once rural land. It must have been strange to see this new block of streets and large houses extending northwards whilst the surrounding land was still fields. An indication of what would happen to all the land in the map over the coming decades.
A Chronicle of Blemundsbury
A Chronicle of Blemundsey by Walter Blott F.R.Hist. S. published in 1892 has the sub title of “A record of St. Giles in the Felds and Bloomsbury, with original maps, drawings and deeds”, and it is packed with information across its 400 pages.
The name Blemundsbury in the title is the original name of Bloomsbury. Nearly every history of Bloomsbury gives the origin of the name as being from the Norman landowner William De Blemond. Blott’s book provides an alternative source as Blemond being corrupted from Bellemont, the name of the original Norman lord who owned the manor.
Another indication of how there always appears to be different stories for history going back 1,000 years.
In Blott’s Chronicle of Blemundsey, he states that the original Manor of Blemundsey covered a far larger area than that of Bloomsbury today, covering an area from around Tottenham Court Road / Charing Cross Road in the west, to the River Fleet in the east, and he includes two maps to show a 12th century view.
This is Blemundsburys West:
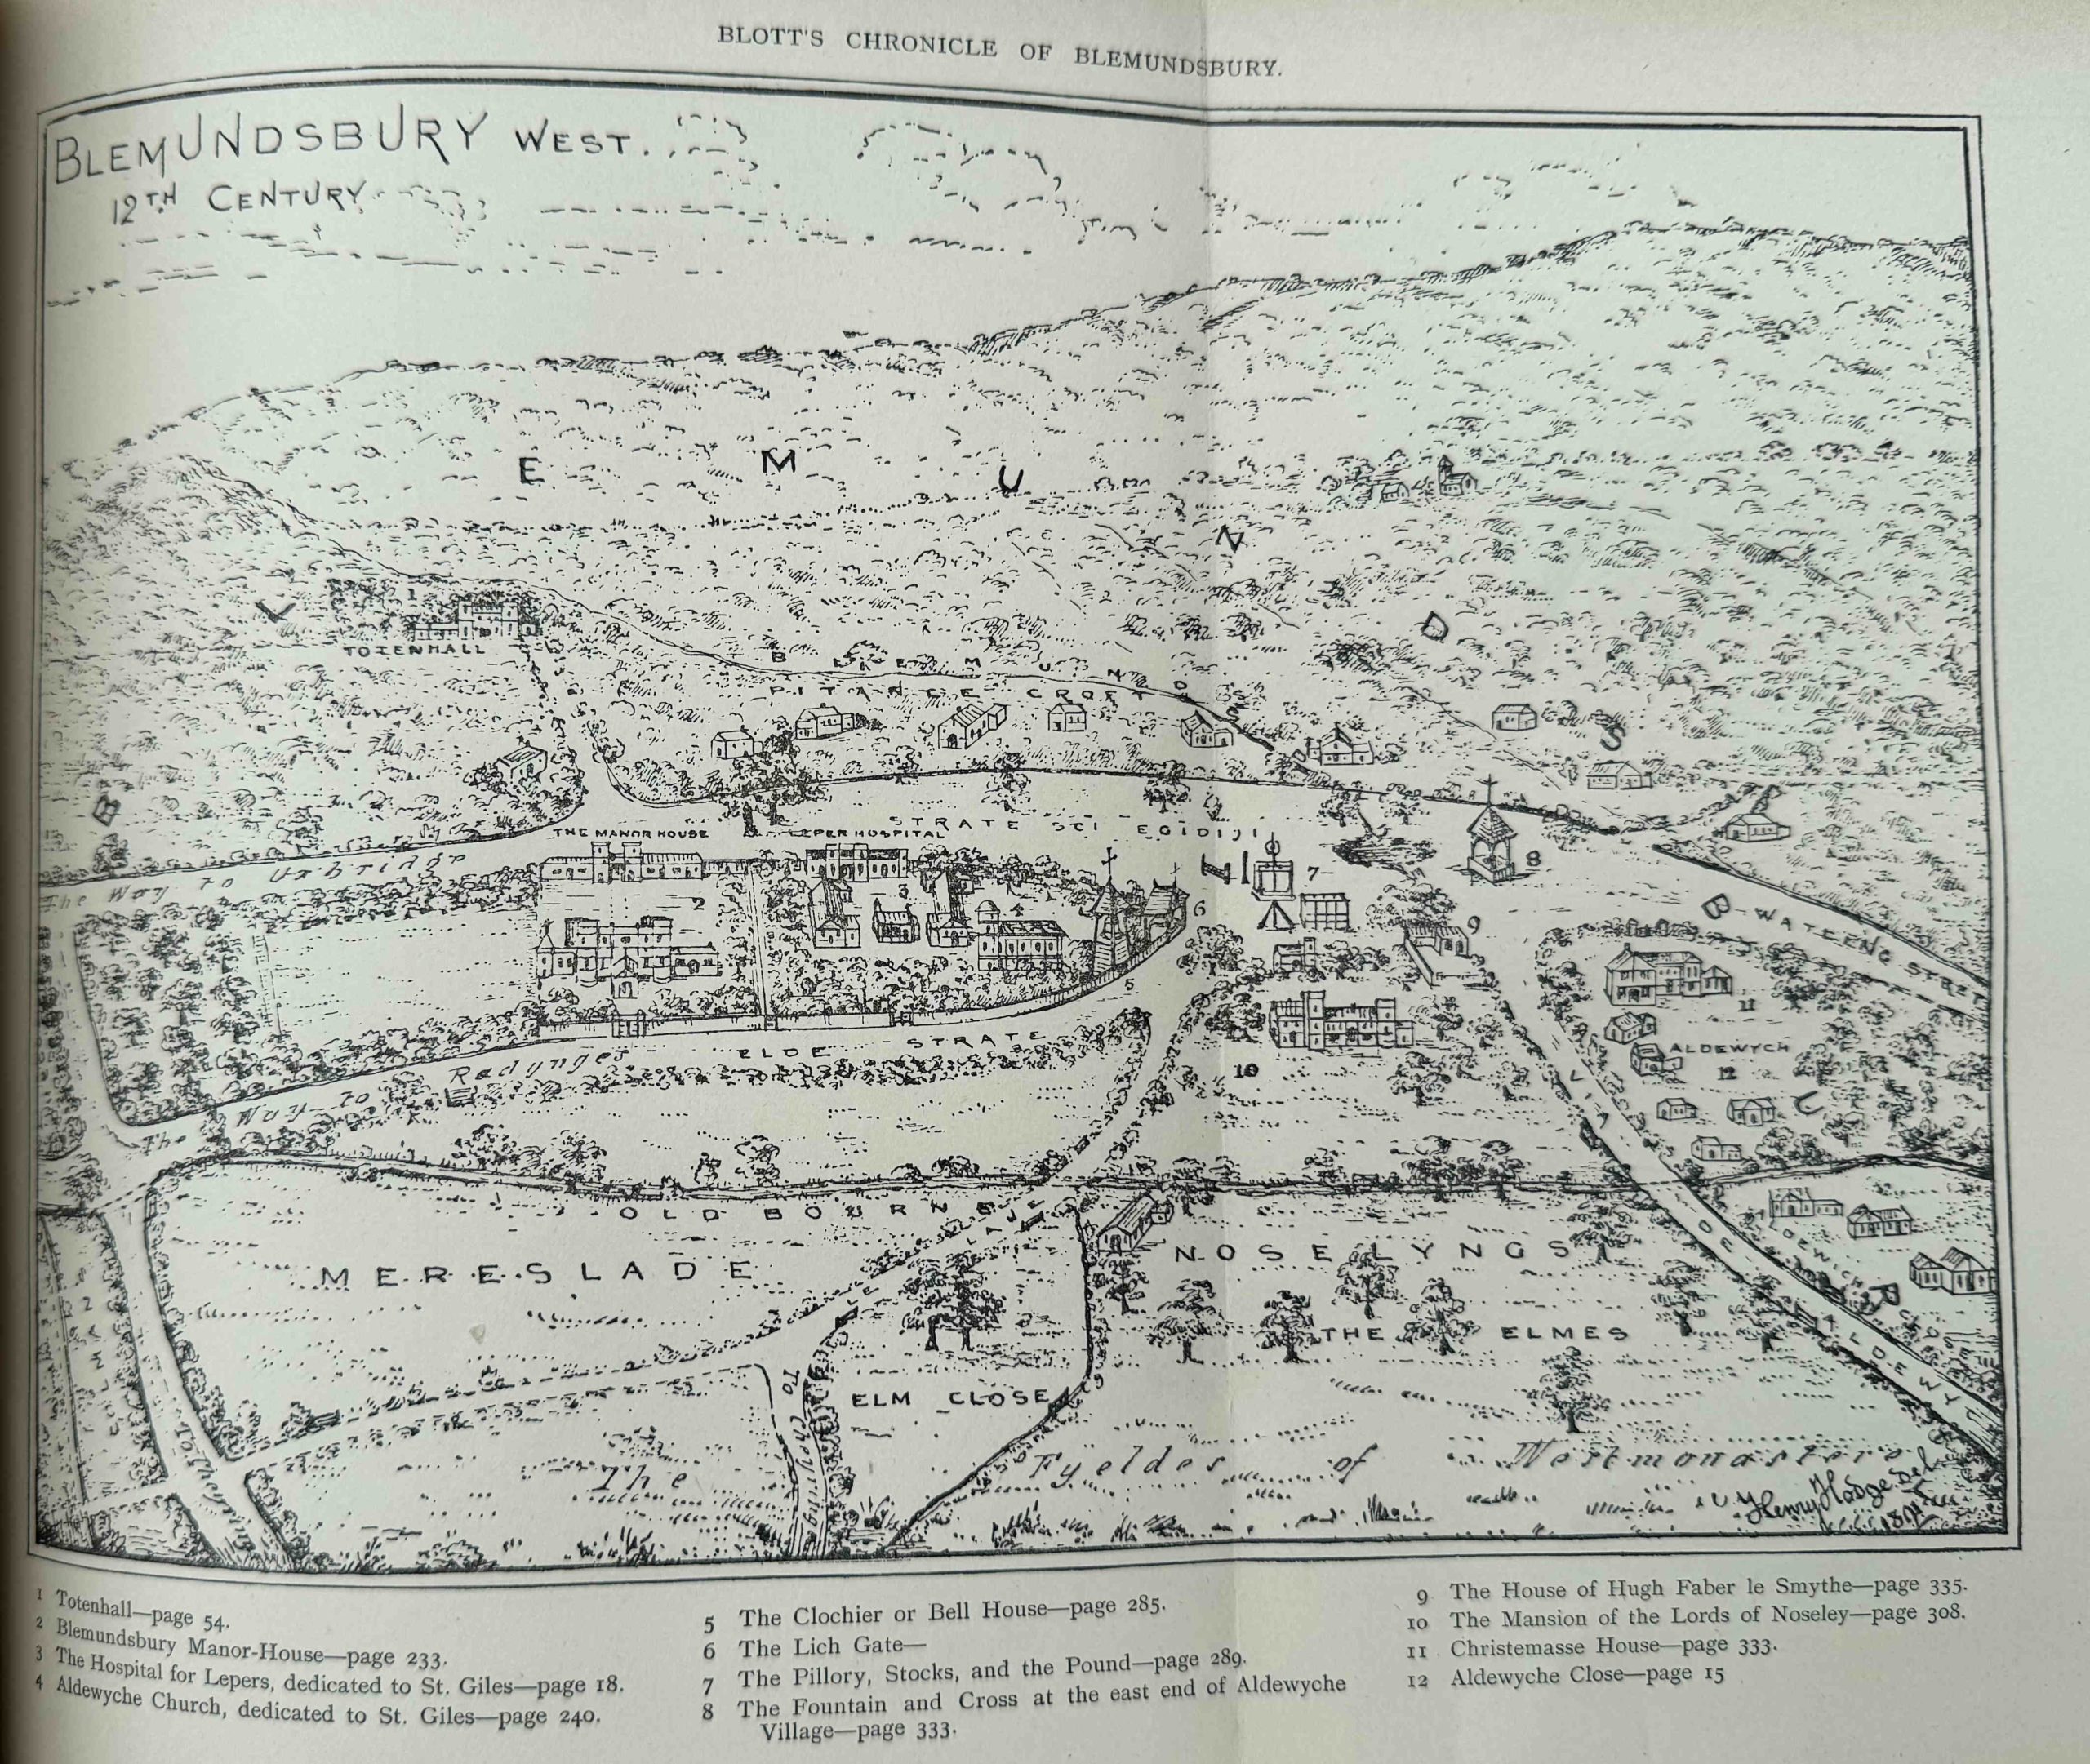
Again, it is always difficult to know how accurate maps which claim to represent an area some hundreds of years earlier. really are. The book does reference a range of earlier maps, deeds, records etc. and many of the features shown in the maps can be found in other sources, so it is probably a reasonably good representation of the area in the 12th century.
There are a number of interesting features. In the above map, the road leading to the lower right corner, labelled Via de Aldwych is today Drury Lane. The street running to the right, labelled Watling Street is High Holborn.
In the middle is a large open space where a number of roads meet, and to the left, a built area, shown in more detail below:
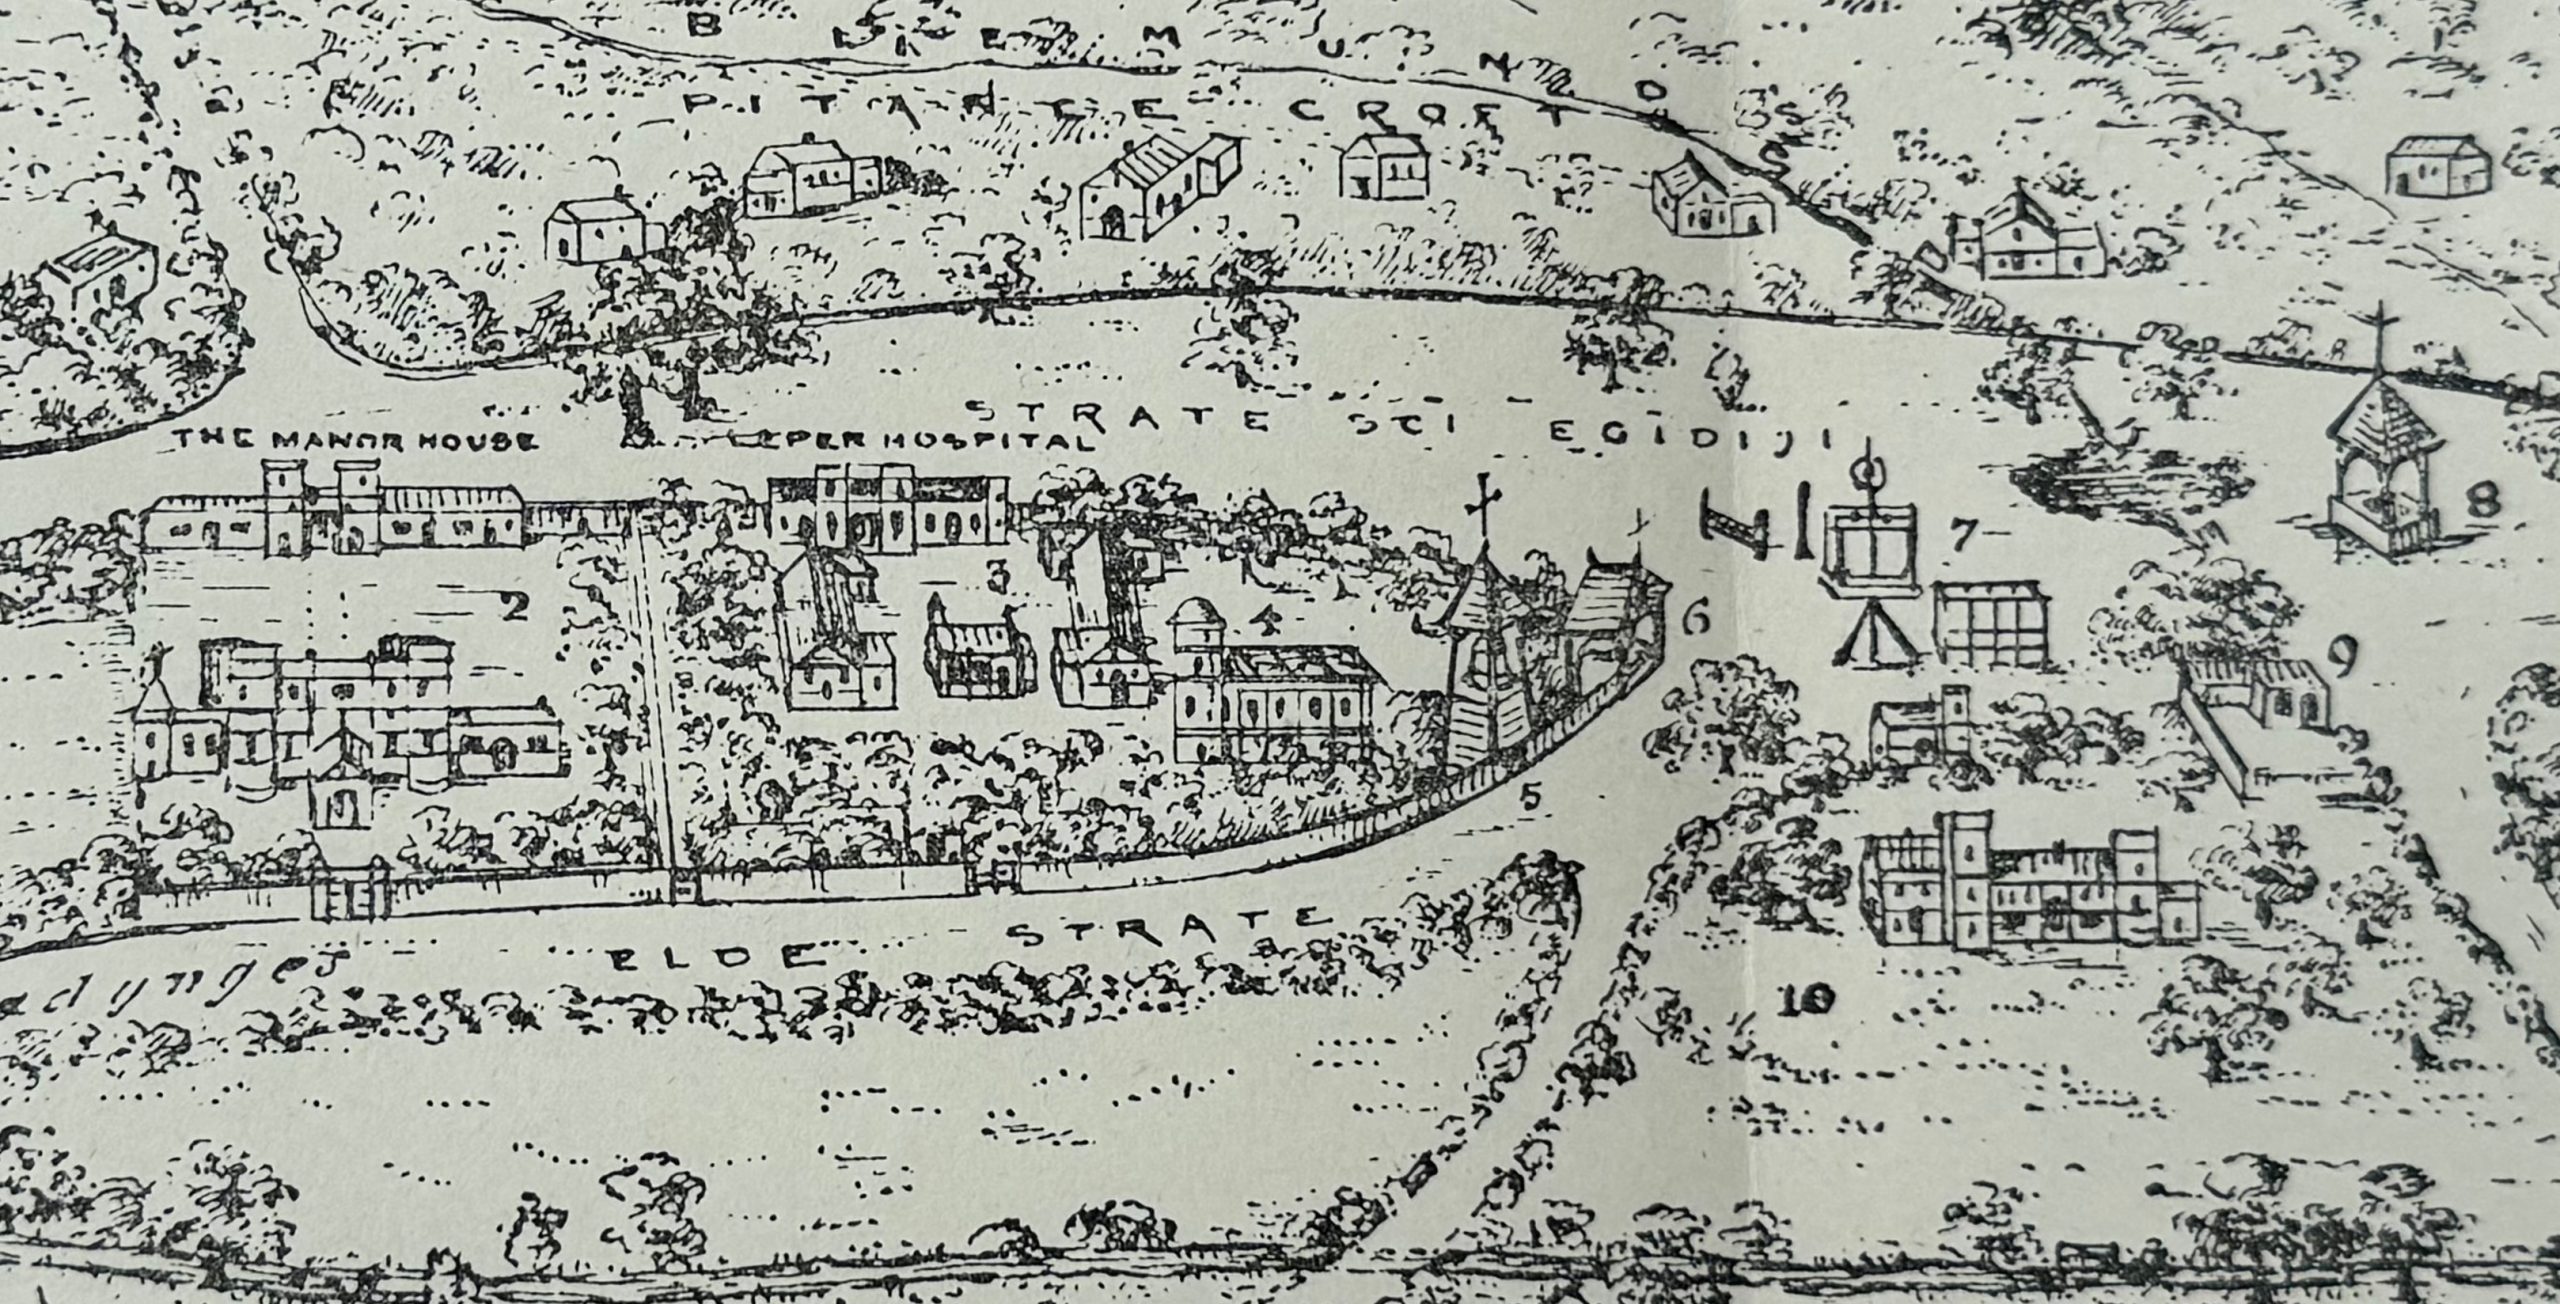
In the middle left is number 3, which in the key is the Hospital for Lepers. The book states that the founding of the hospital was down to Queen Matilda (also known as Maud, the wife of Henry I), and that it dates from 1108 to 1117 (the later date is the most commonly quoted date, the earlier date is probably the founding of the hospital and the later is the consecration).
The hospital was taken by Henry VIII, and in 1542 the old chapel of the hospital became a parish church, and the latest rebuild of the parish church is today the church of St. Giles in the Fields. The later part of the name of the church describes the area around the church when it became the parish church as this was still an undeveloped part of London. The chapel is number 4 in the map.
In the open space at the road junction is a number of items of public punishment with number 7 identifying the Pillory, Stocks and Pound.
Number 8 is the Fountain and Cross. A cross was often a feature of key road junctions, and today a street name such as Redcross Street by the Barbican is a reminder of when these features were to be seen.
The book also includes a map of Blemundsbury East:
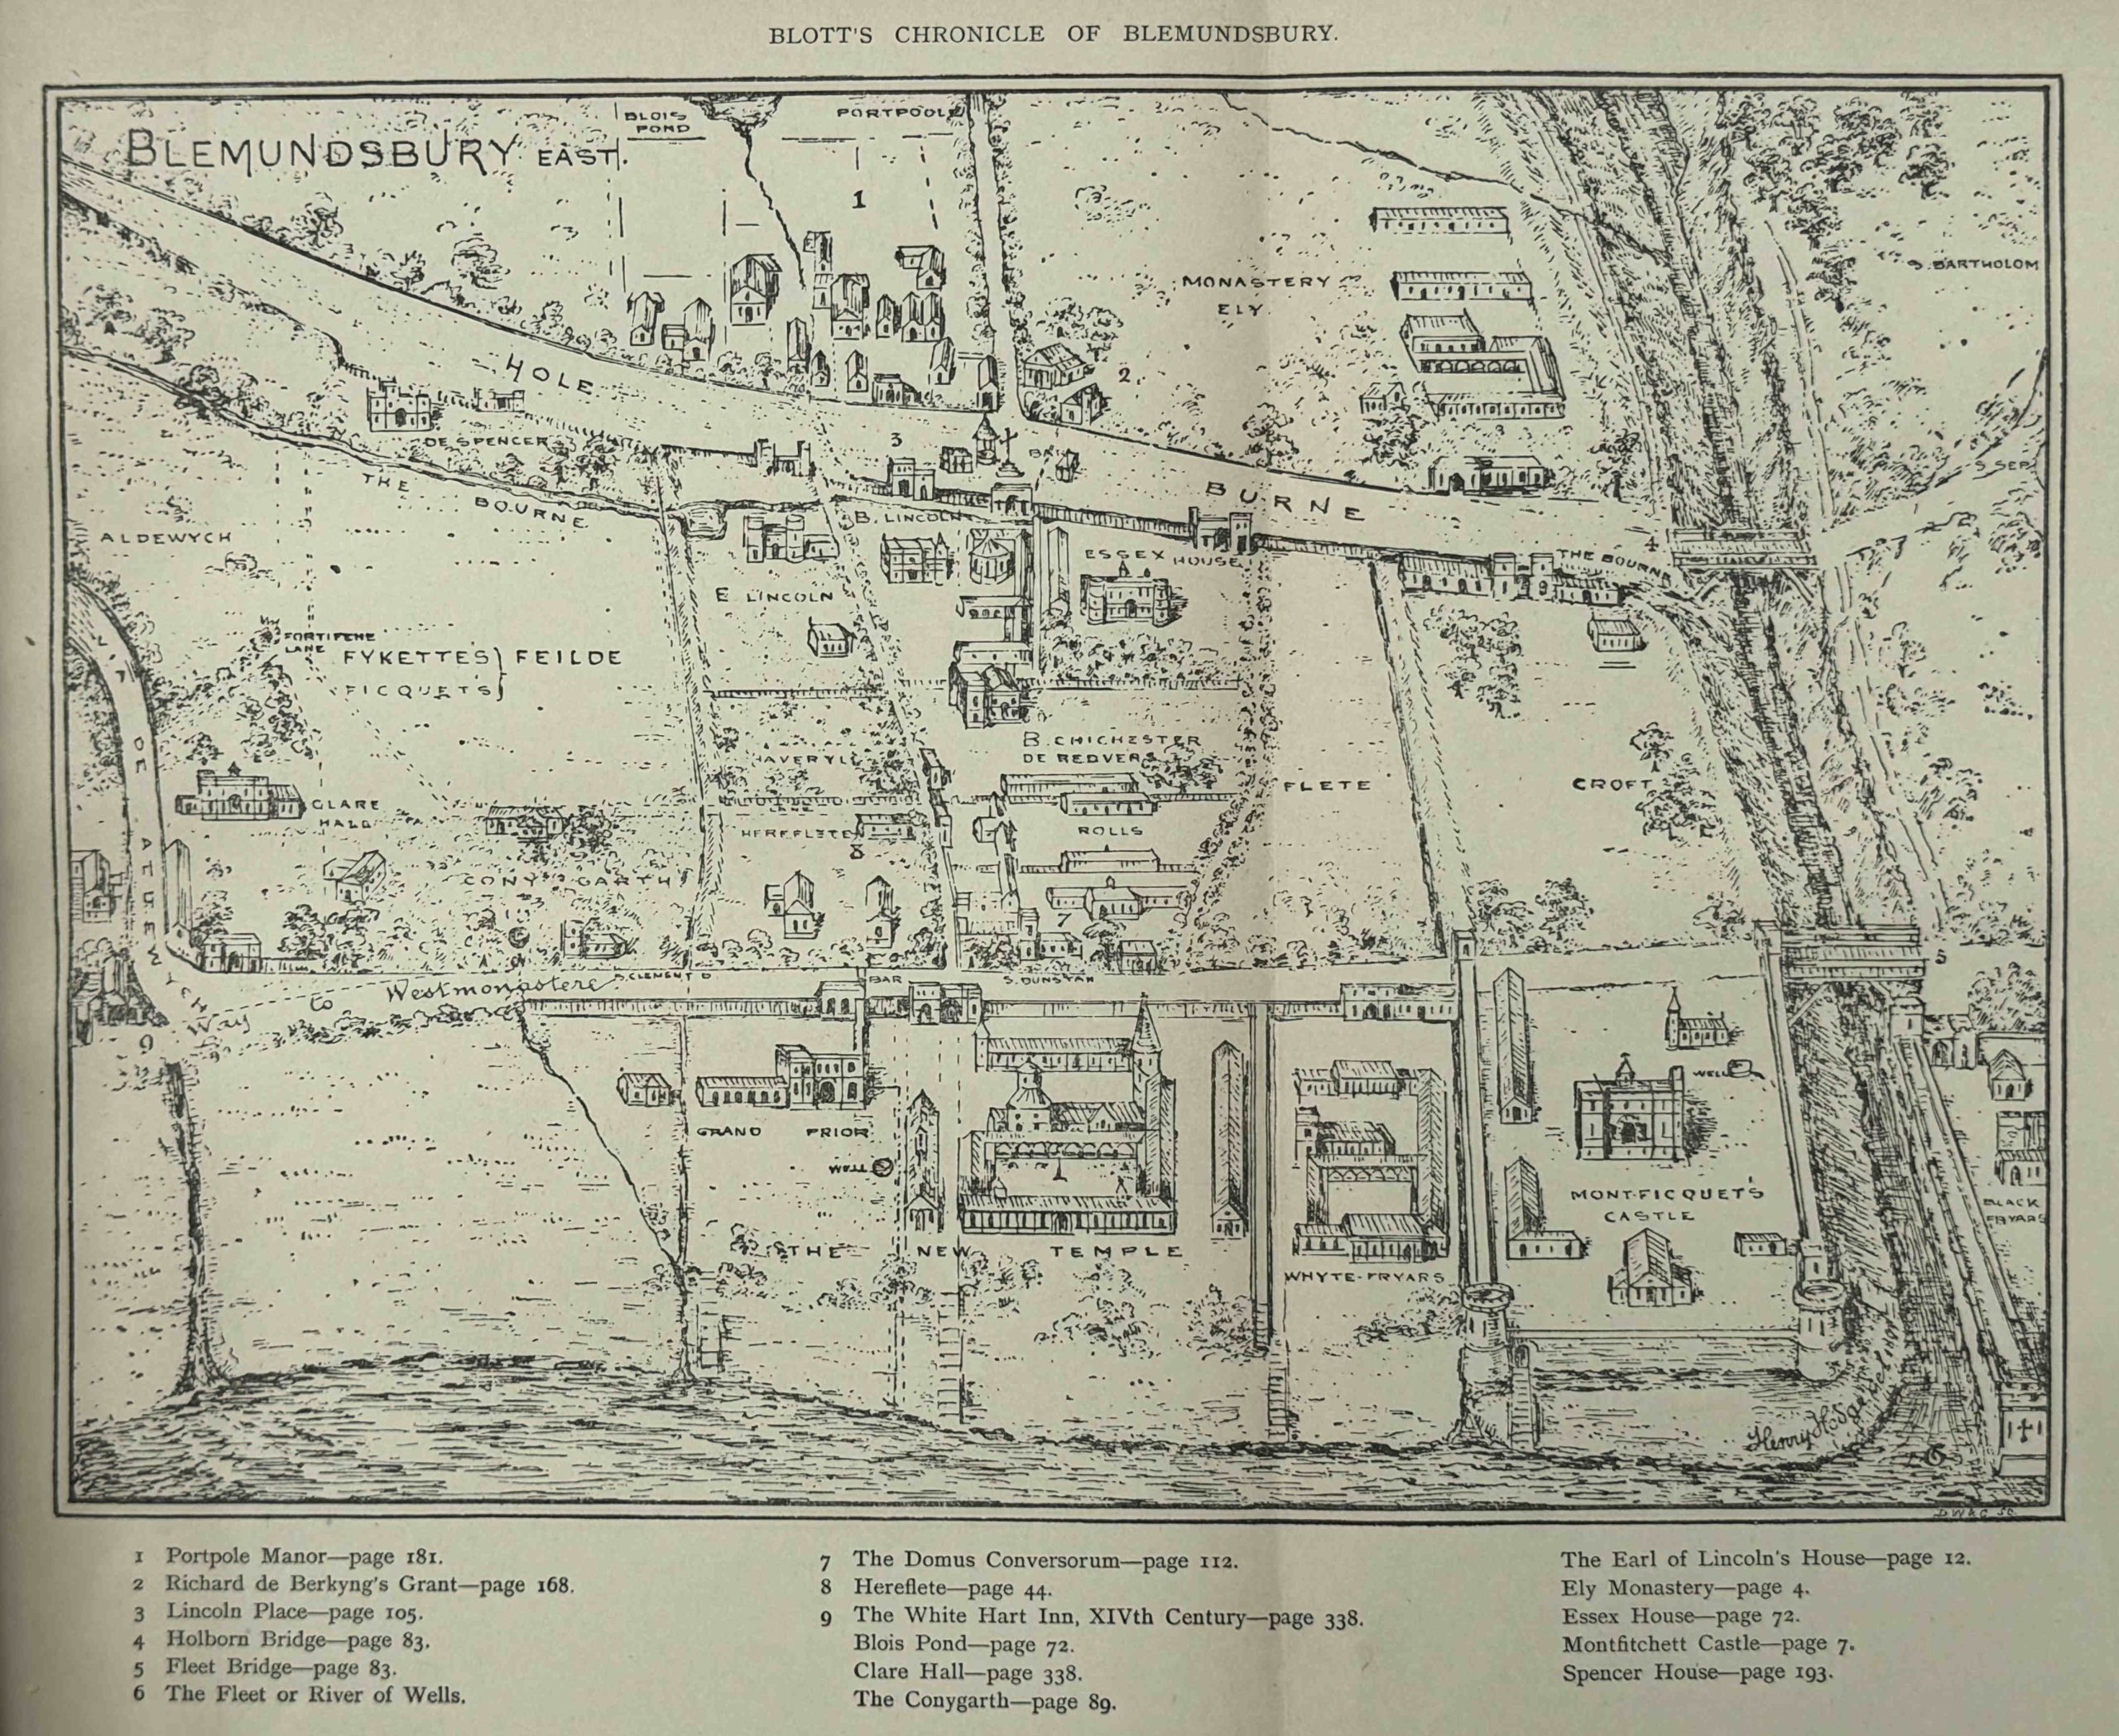
On the left of this map is Via de Aldewych (Drury Lane), to where is meets “the way to Westminster”, today Fleet Street and the Strand.
On the right is the River Fleet with the bridges between Ludgate Hill and Fleet Street on the lower part of the Fleet and the bridge leading to Holborn across the upper part.
In a previous post on Strand Lane, I quoted a reference from a 1709 publication that there were once 311 open channels of water crossing the route between Westminster Hall and the Royal Exchange, and the above map extract does confirm there were a number of channels (although 311 does seem rather high).
Along the top edge of the map there is a Blois Pond. The book gives the source of the name of the pond as “Alexander de Blois, Archdeacon of Salisbury and Chief Justice of England had just succeeded Bishop Bloet and taken his residence in Lincoln’s Inn, by the Old Temple. On the opposite side of the way was a pond which afterwards bore his name – Blois Pond”. This seems to date from the early 12th century.
A stream leads south from the pond, then seems to disappear after reaching Holborn.
Further south, along the edge of the Thames, as well as the Fleet, we can see three other channels that have an outlet into the river.
There are also a number of stairs along the edge of the river which again confirms the age of these structures.
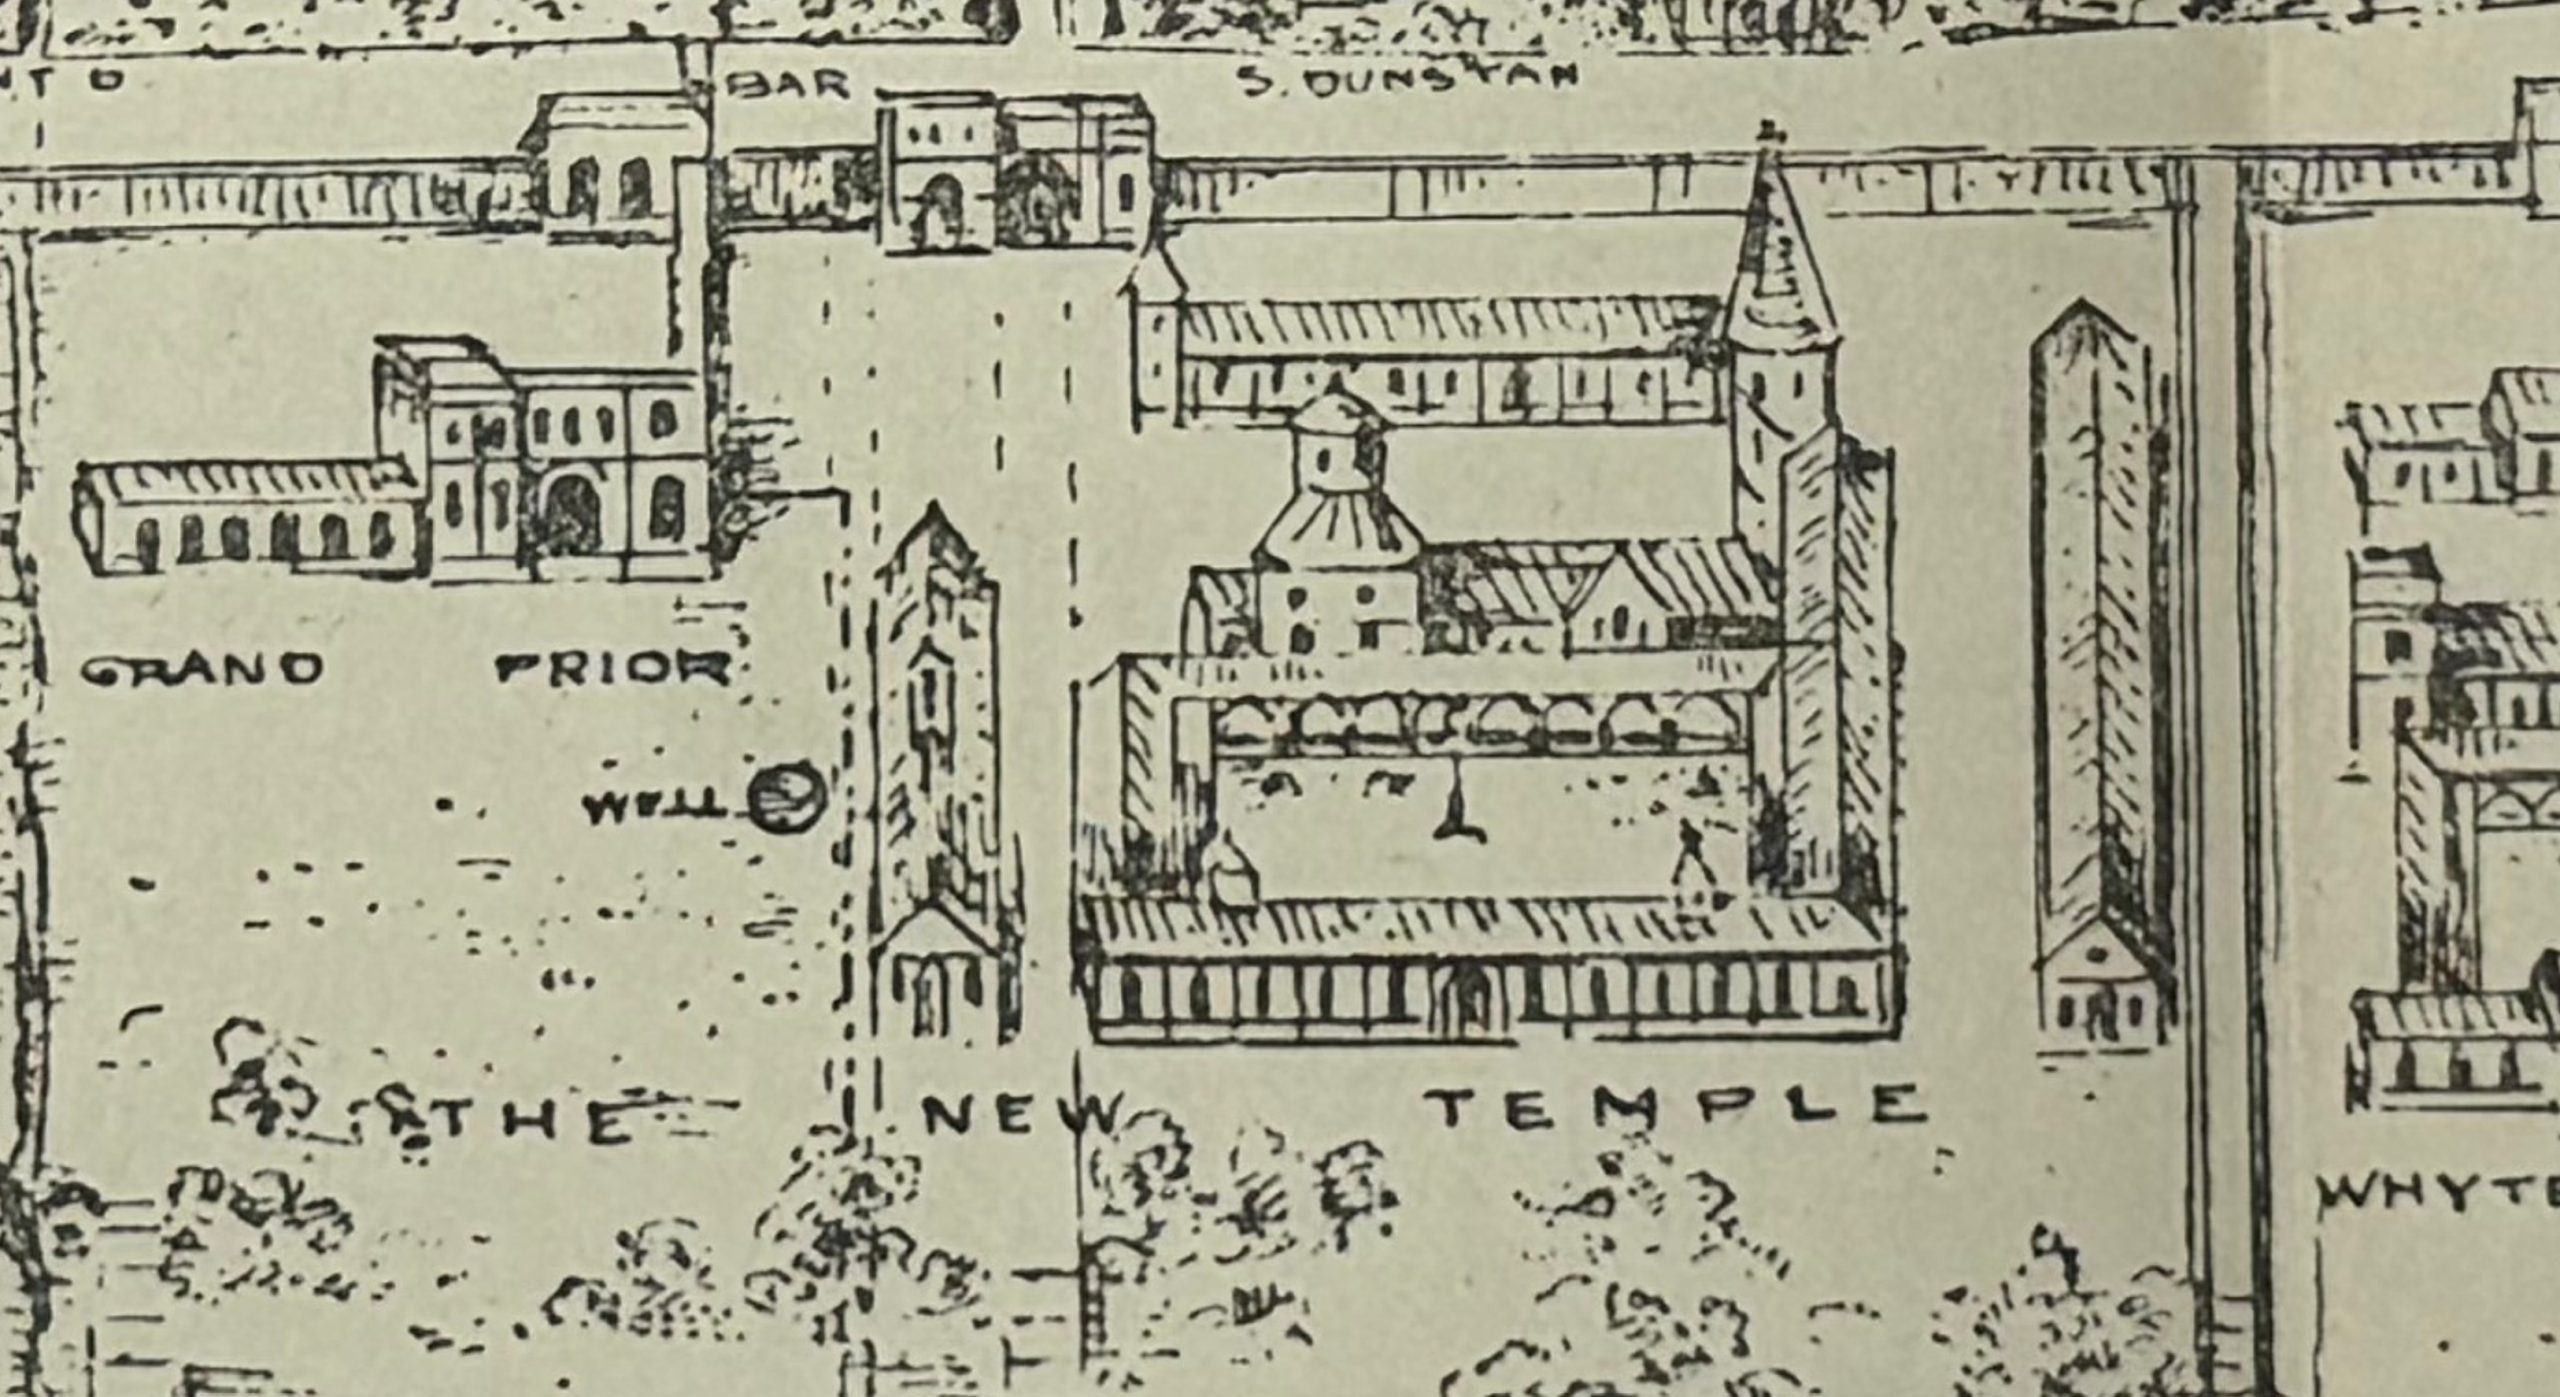
The following extract shows the distinct round tower of the Temple Church within the New Temple:
To the lower right of the map is a feature named Montficquet’s Castle (or Montfitchett Castle in the key):
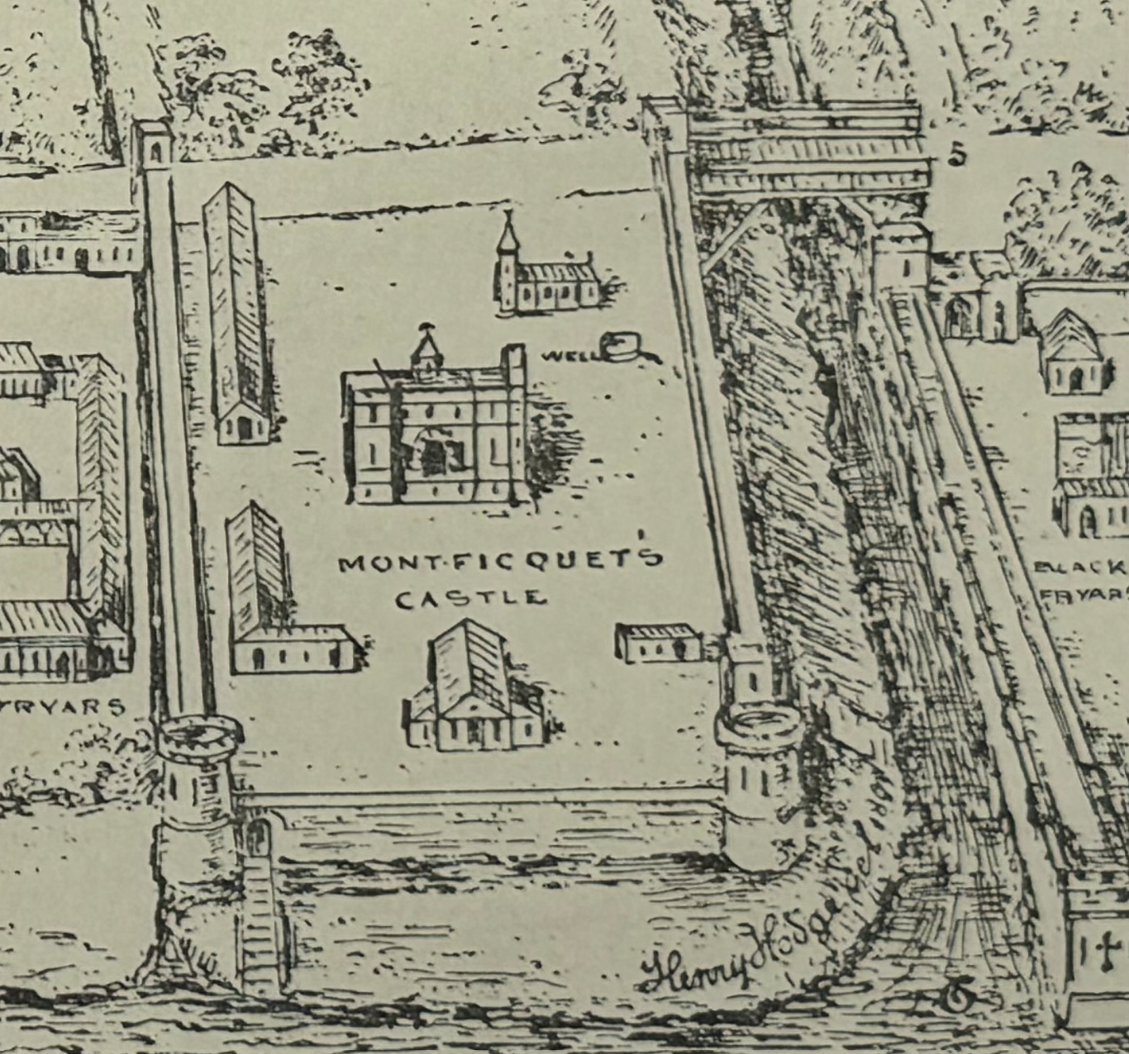
The location of this “castle” is really confusing. Nearly all references to this castle mainly refer to it being a Tower, and across the Fleet in the Ward of Castle Baynard. So to the east side of the Fleet, not the western side as shown in the map.
In a Dictionary of London, Henry Harben refers to Montficquet as follows: “Montfiquit (Tower of) – Near the Wall of London, next to Castle Baynard, in the Ward of Castle Baynard, afterwards included in the precinct of Blackfriars.
Earliest mention (12th century): Land in parish of St. Martin de Ludgate in the corner opposite the land of the Dean of St. Paul’s. Stow says the castle was built by the Baron of Mountfiquit, who came over with William the Conqueror, not far distant from Baynard’s Castle.”
The inclusion of Montficquet’s Castle to the west of the Fleet shows that you need to be really careful when using historical sources, including maps. This is key when maps created centuries after the landscape they are attempting to portray. They do in general present a good representation of the area, but individual features need to be checked and verified.
With this caution in mind, a folding map in a book is a wonderful addition, and helps to tell the story of a place and how significantly London has changed. From the fields, footpaths and hamlets that are now under the streets and buildings of Islington, the rapid expansion of Marylebone, to the detail within the streets, such as the St. Giles Workhouse, after development.