The Impact of the M25 was the title of a 1982 report from the Standing Conference on London and South East Regional Planning.
I am sure that drivers have long had a love / hate relationship with the M25. When it is flowing well, it is a fast and efficient way around London, to reach different entry points to the city, or main roads and motorways spreading away from the city. At other times, it can be a car park, with a lane closure or accident quickly leading to miles of slow moving and stationary traffic.
The M25 is the latest in a series of attempts at moving traffic around the city. From plans in the 1940s by the City of London to circle the City with dual carriageways that became Upper and Lower Thames Street and London Wall, to the north and south circular, to the M25.
There is also a perception that London begins at the M25, and indeed with the recent expansion of the ULEZ zone, in some places such as near Waltham Abbey to the north, the ULEZ zone is up against the M25, as it is in the east, where to the east of Upminster the zone crosses the M25 to cover a small area of land around North Ockenden.
The M25 is closer to the centre of London in the north and extends further away around the southern stretch of the motorway. The following map shows the M25 as a complete ring around London ( © OpenStreetMap contributors):

The M25 is only there because of London. It was built to provide a route around the city without having to travel through built up and congested areas, and to offer a way for lorries and cars traveling from, for example, the midlands to the channel port at Dover, a fast route between the motorways that spread out from London.
However the M25, as indeed with any new road, has an impact far beyond the original intentions of improving traffic flow.
It will result in developments that aim to take advantage of the new road, it will open up areas for regeneration, it will generate new levels of traffic, and it will have an impact on the natural environment of the places through which the road is built.
Investigating the potential impact of the M25 was the aim of the 1982 report, to see what impact on the south-east this major new infrastructure project would have in the years ahead.
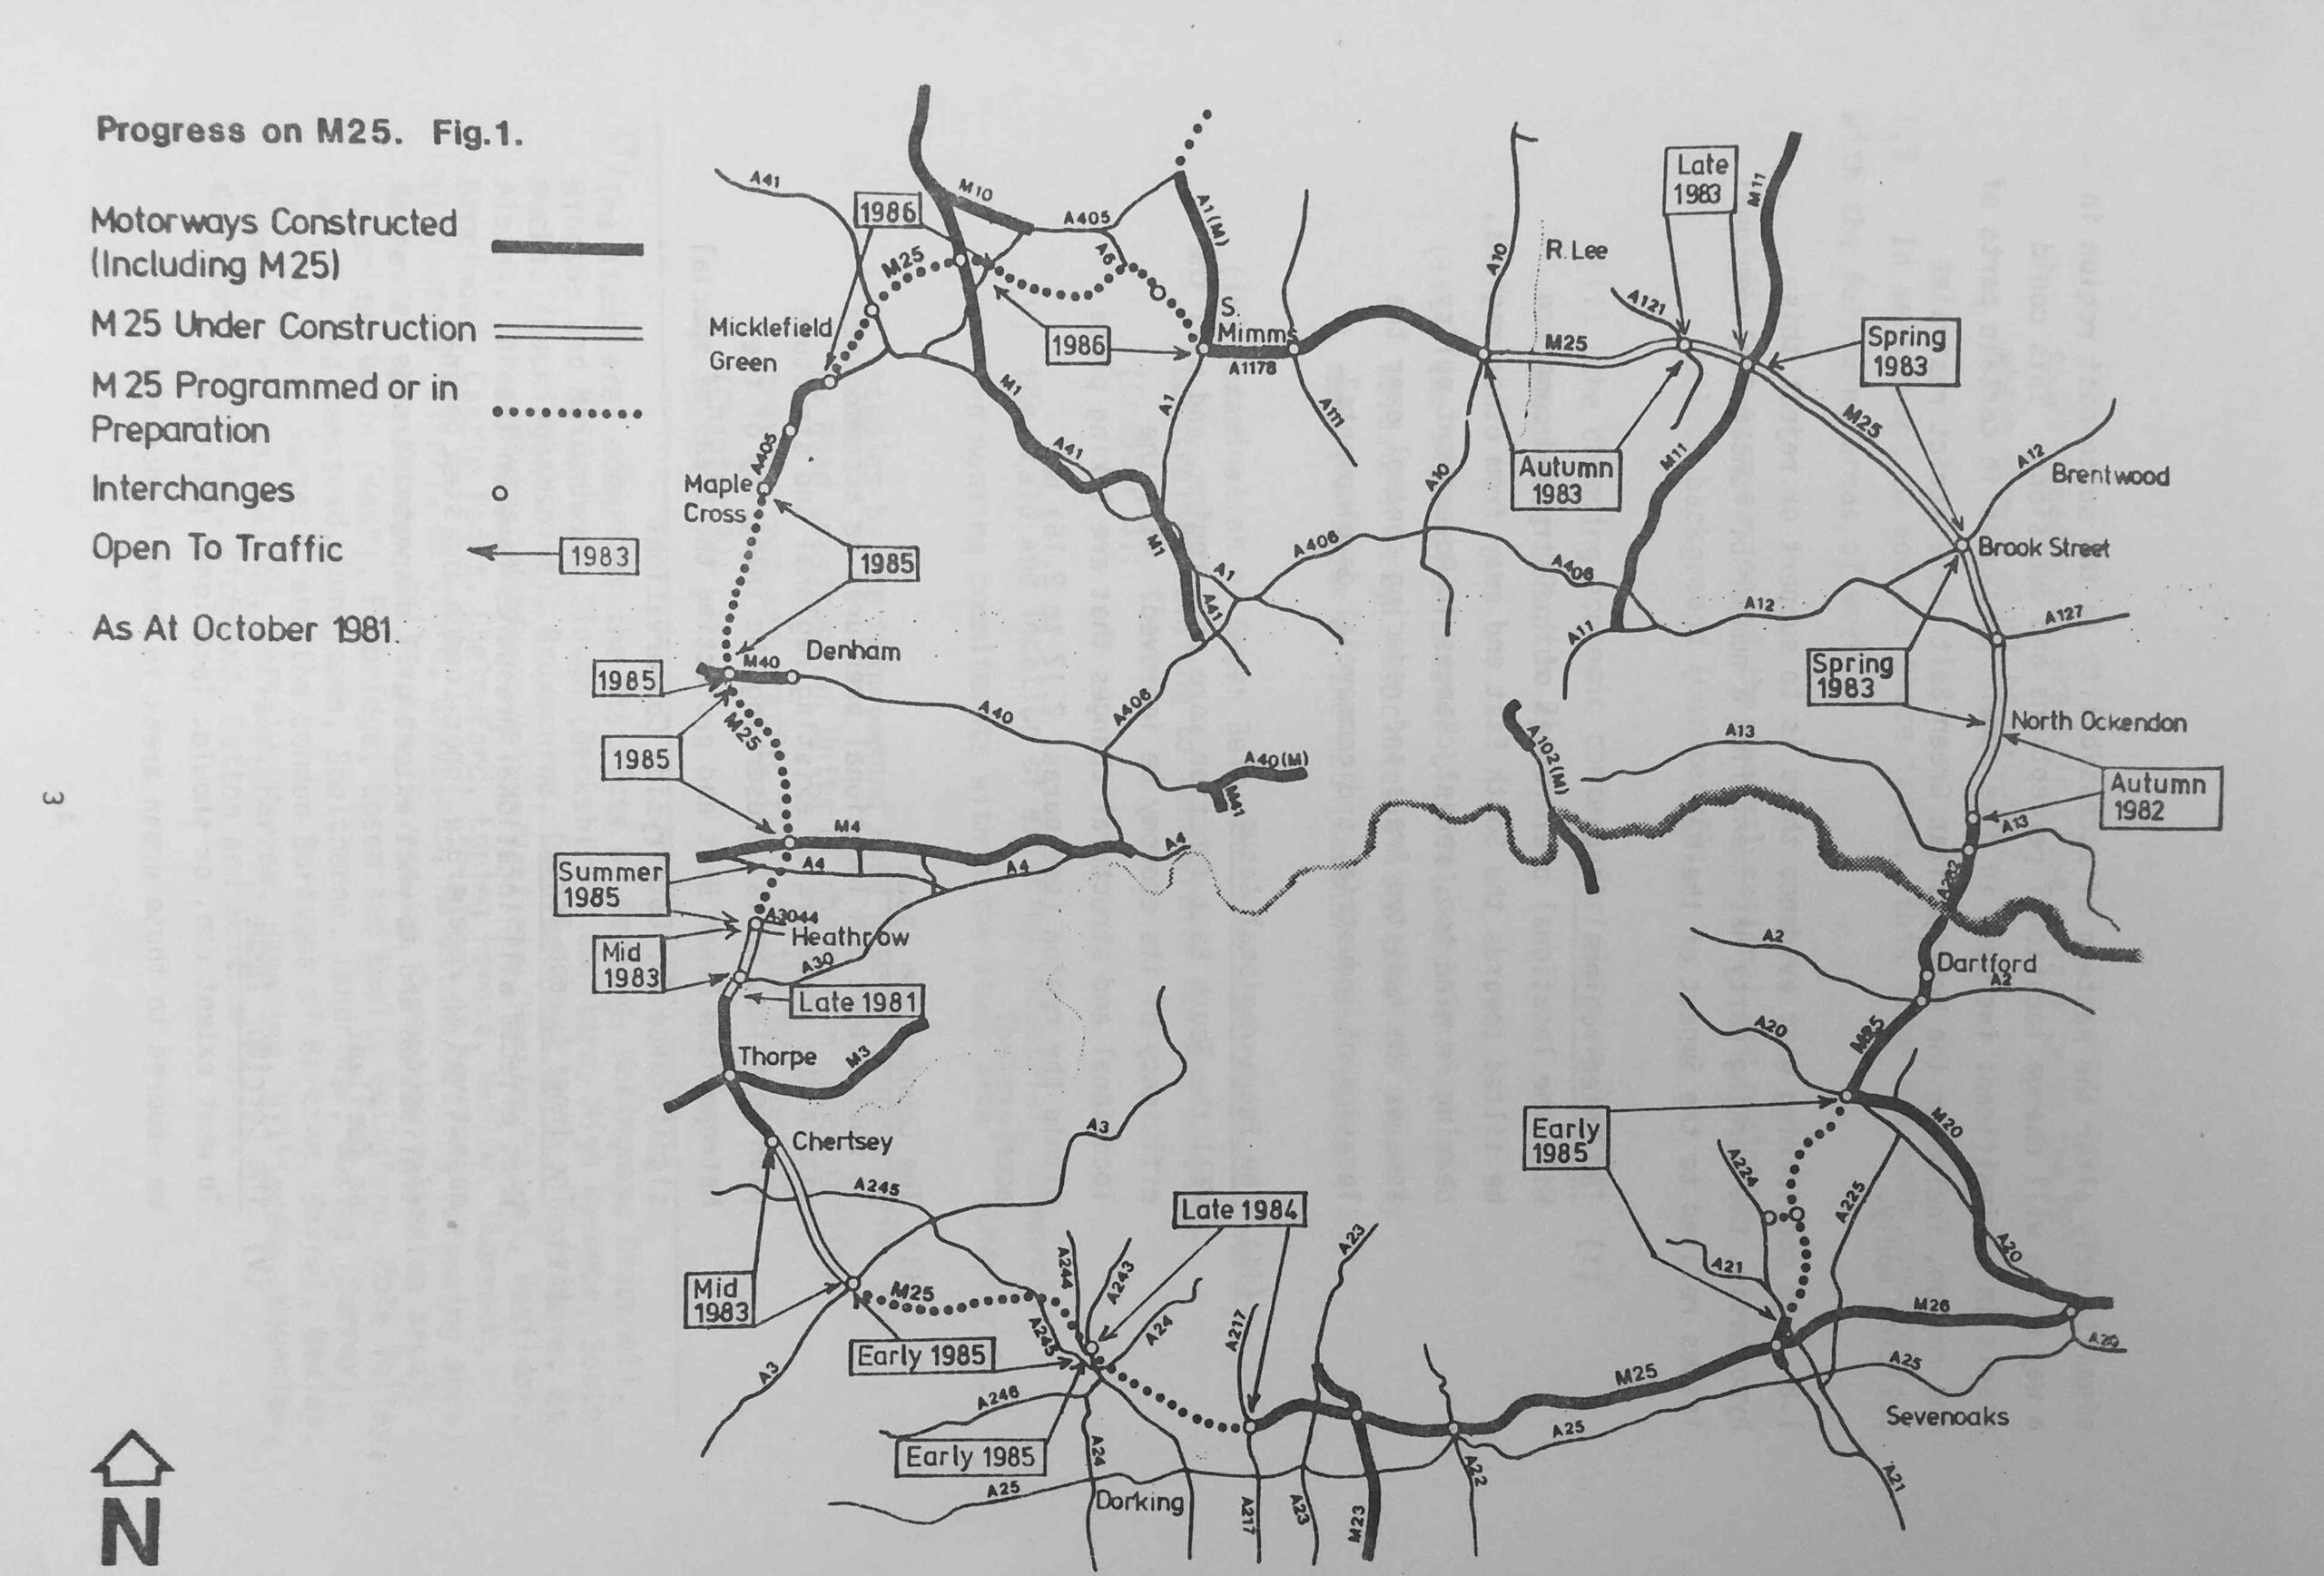
At the time of the report, the M25 was under construction, and the following map shows the expected completion dates of individual sections of the motorway from 1982 to 1986:
For nearly all post-war planning, the car and lorry were central to transport planning. This had started in the 1930s, and planning for post-war reconstruction in the 1940s expected a significant increase in personal car ownership and use for both work and pleasure purposes.
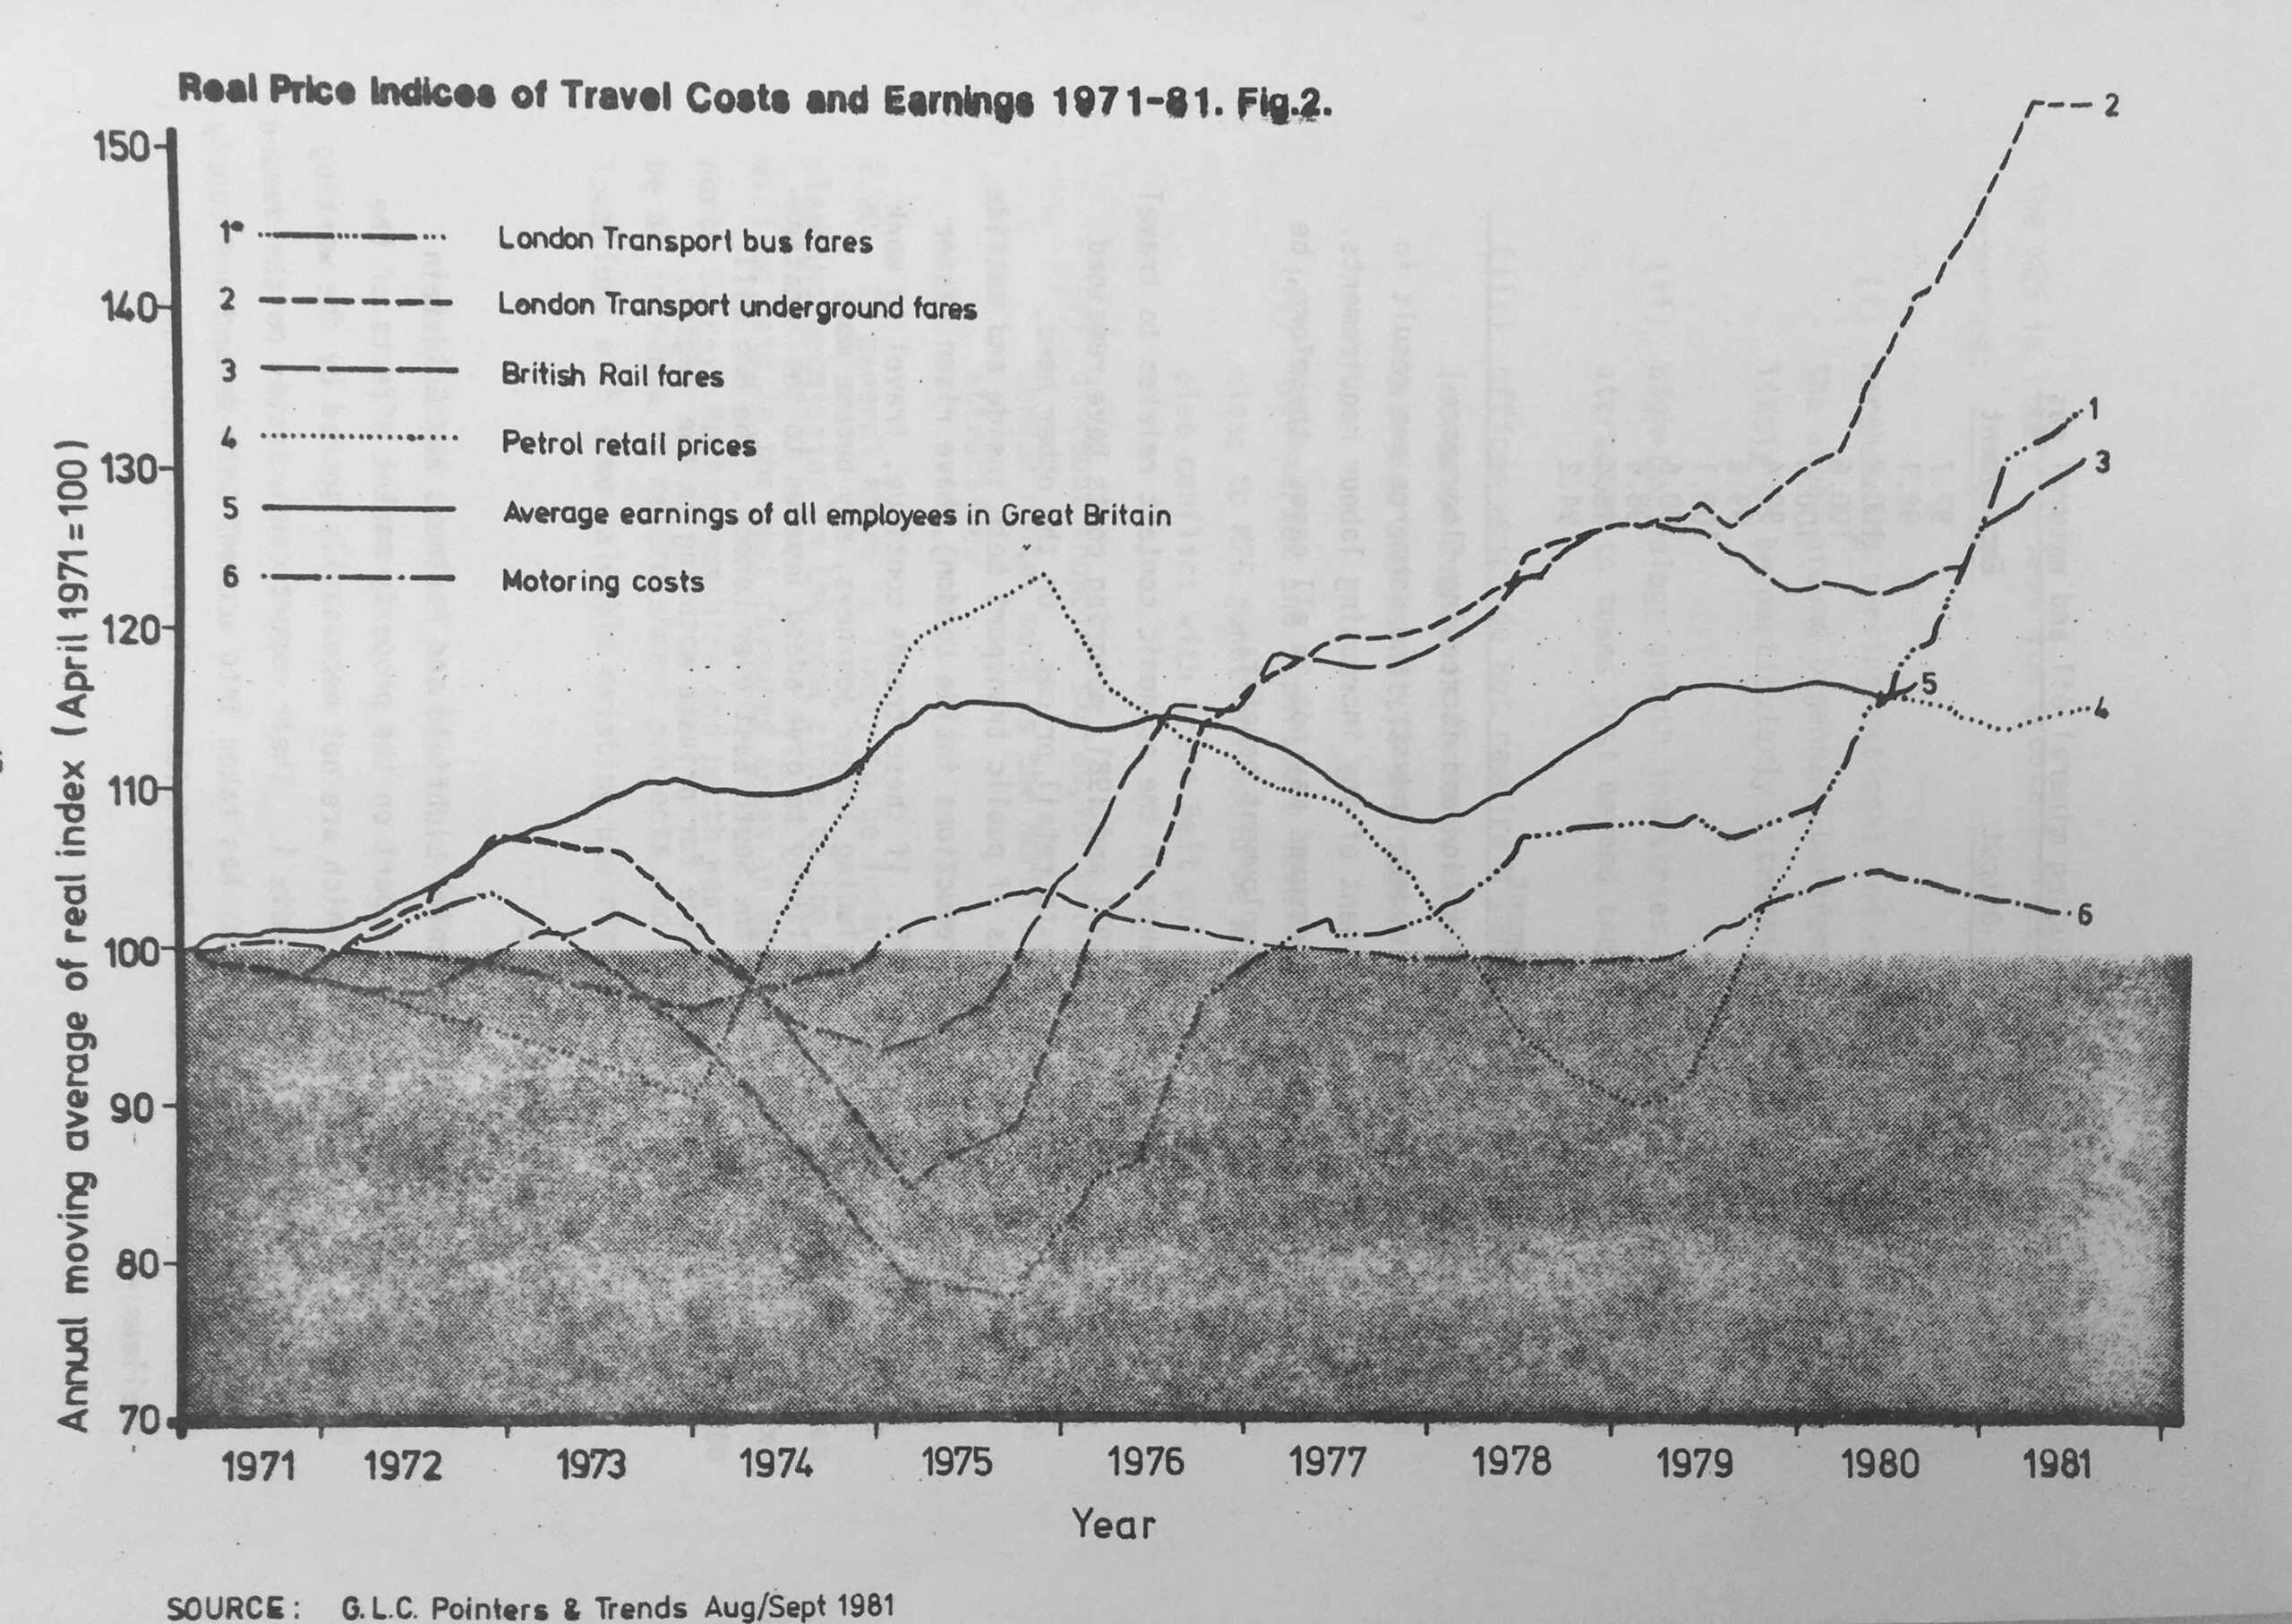
The cost of car travel would also gradually reduce compared to other forms of transport, and the report included the following graph, which shows that between 1971 and 1981, the costs of London Transport bus fares (1) and underground fares (2) had risen far more than both average earnings (5) and motoring costs (6):
The report identified five major development implications that the M25 would result in:
- warehousing serving national and regional markets, for which the areas around Dagenham, Dartford, Grays and Redbridge are likely to be attractive;
- high-technology growth industries; which are likely to be attracted to towns just beyond the Green belt;
- offices which do not require a central London location. Increased demand in Romford, Croydon, Orpington, Hounslow, Uxbridge and Barnet is envisaged;
- hypermarket and superstore developments for which locations close to M25 junctions would be most attractive, but would also conflict with Green Belt policy;
- discount shopping stores, for which locations on major cross London routes such as the North Circular Road are likely to be attractive.
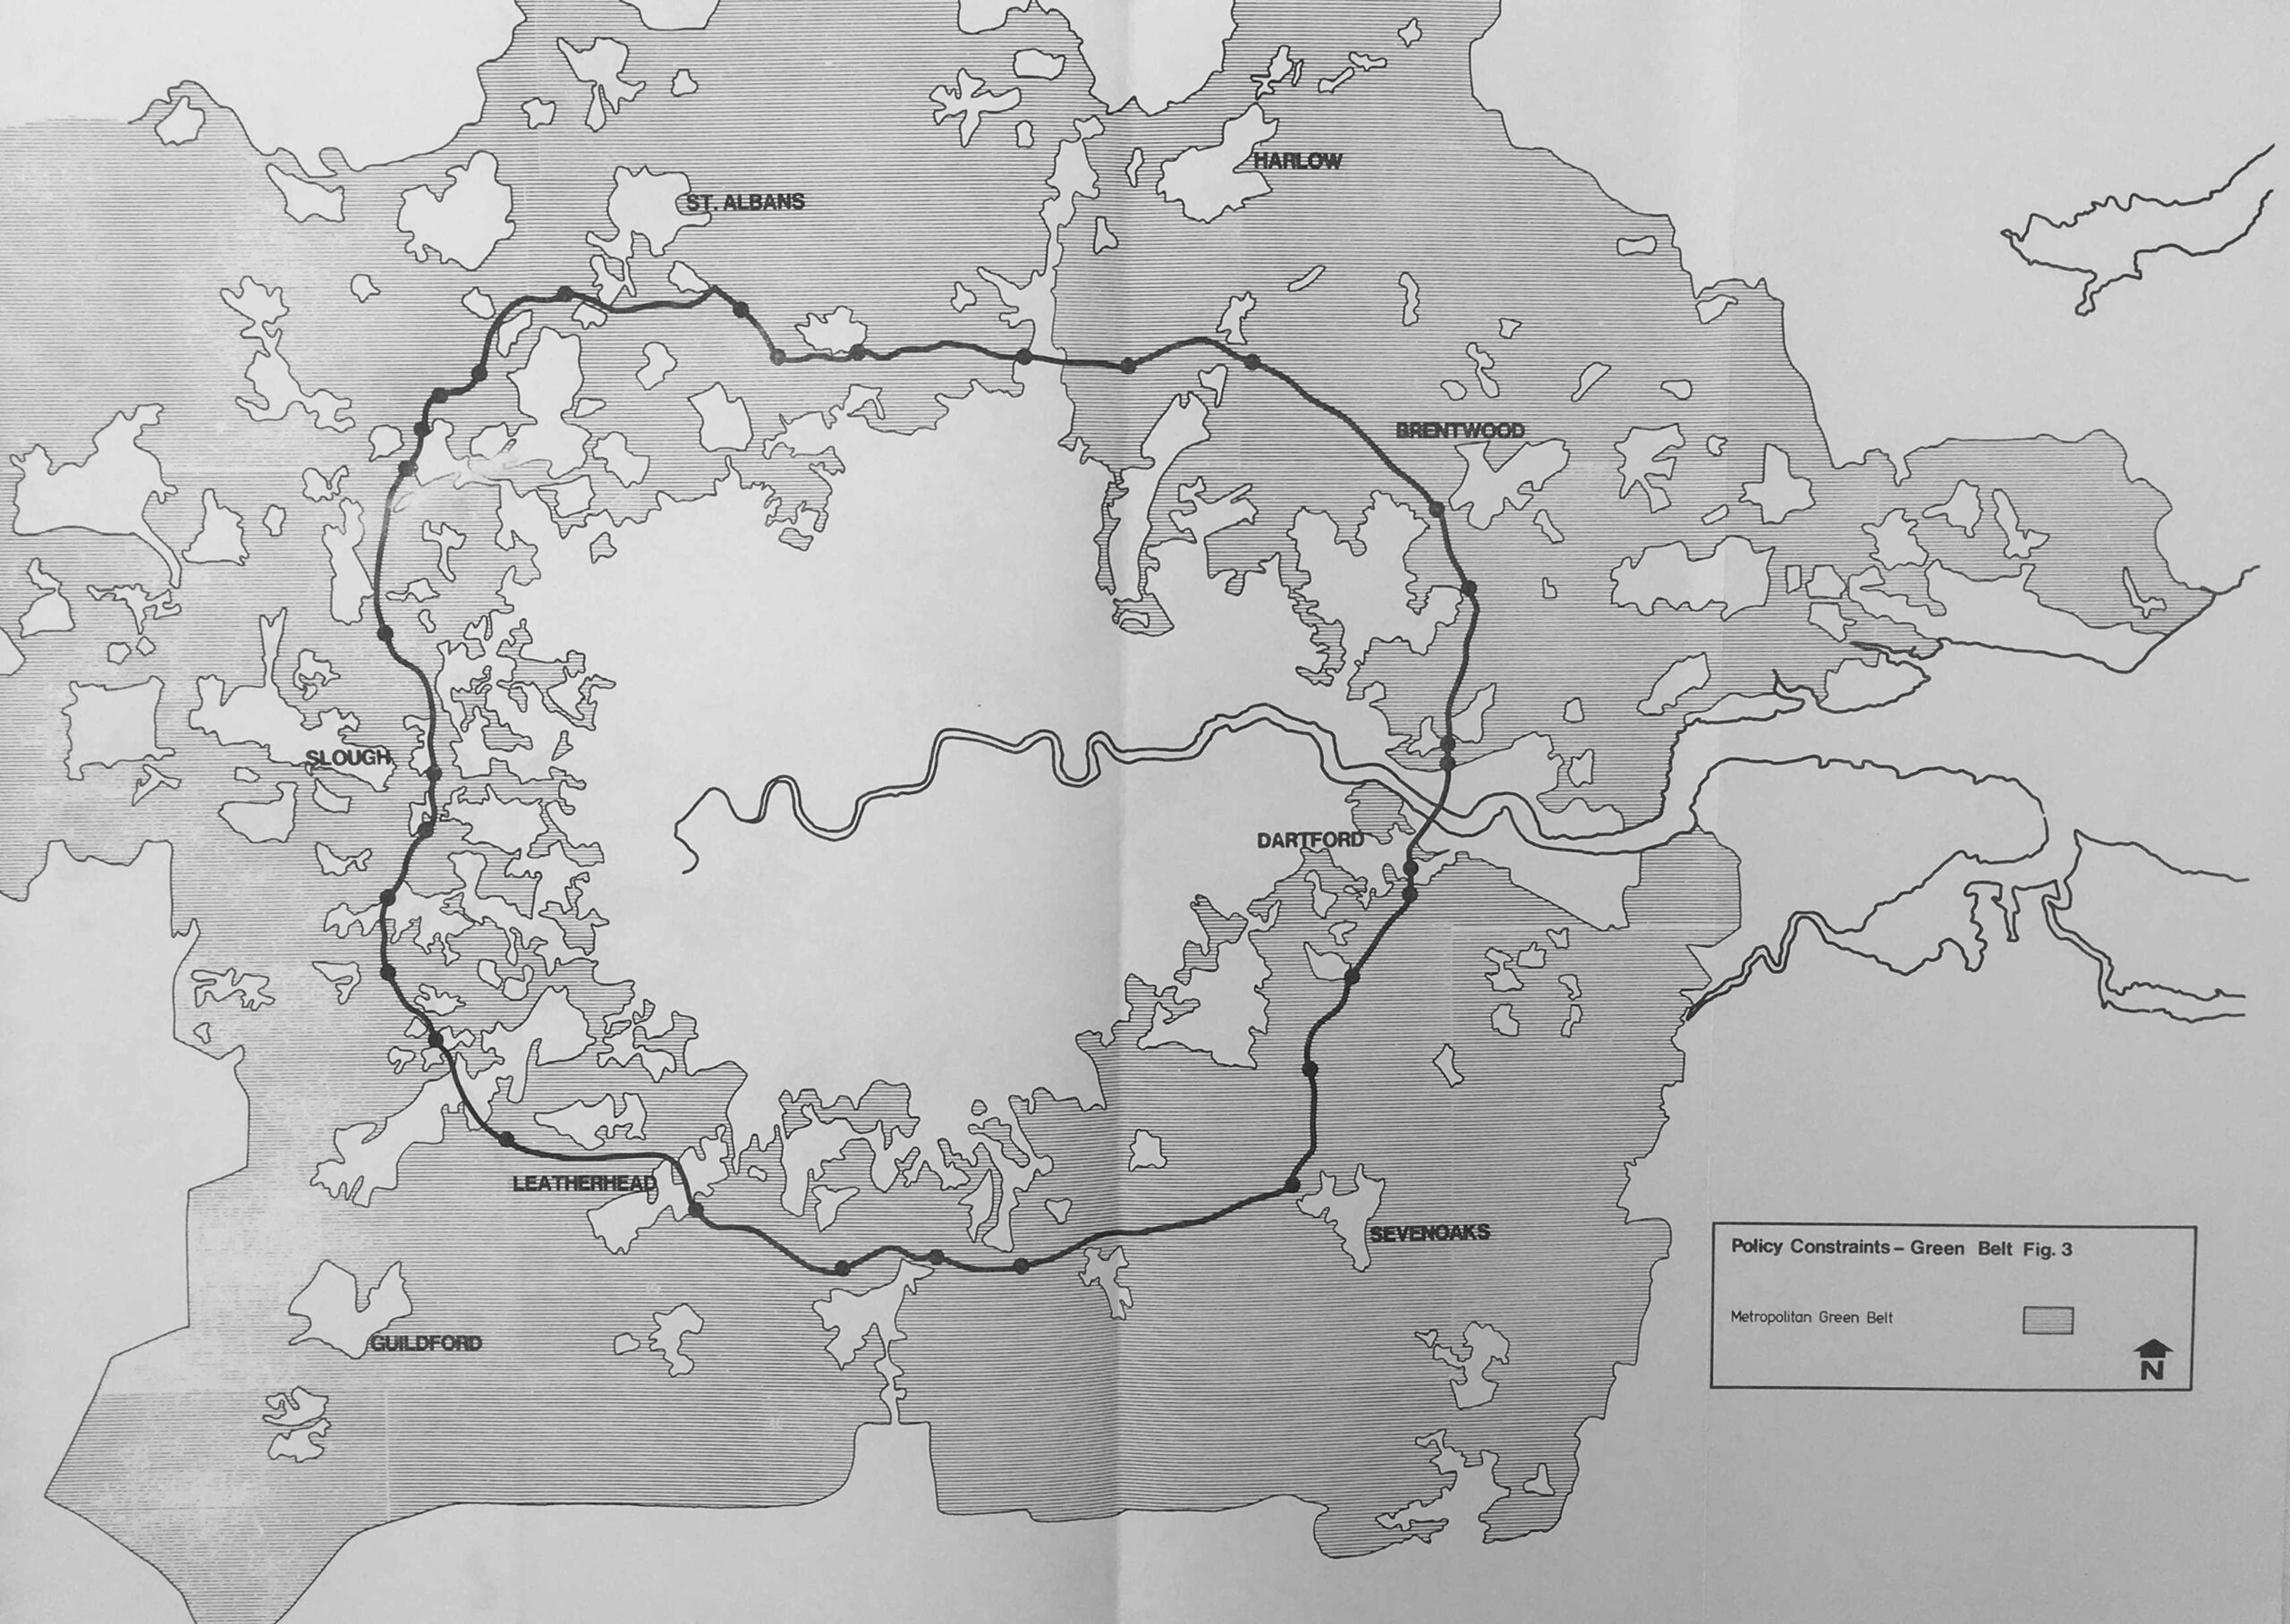
Much of the route of the M25 was through Green Belt, and the use of land close to the new motorway, would result in planning problems, and increase the value of land where development was permitted.
The route of the M25 through the Green Belt is shown in the following map:
Although there were a few very small exceptions, the M25 did not pass through Grade 1 and 2 agricultural land, although the report identified large areas of the highest quality land in east Hertfordshire, Essex, and north-west Kent, as shown in the following map:
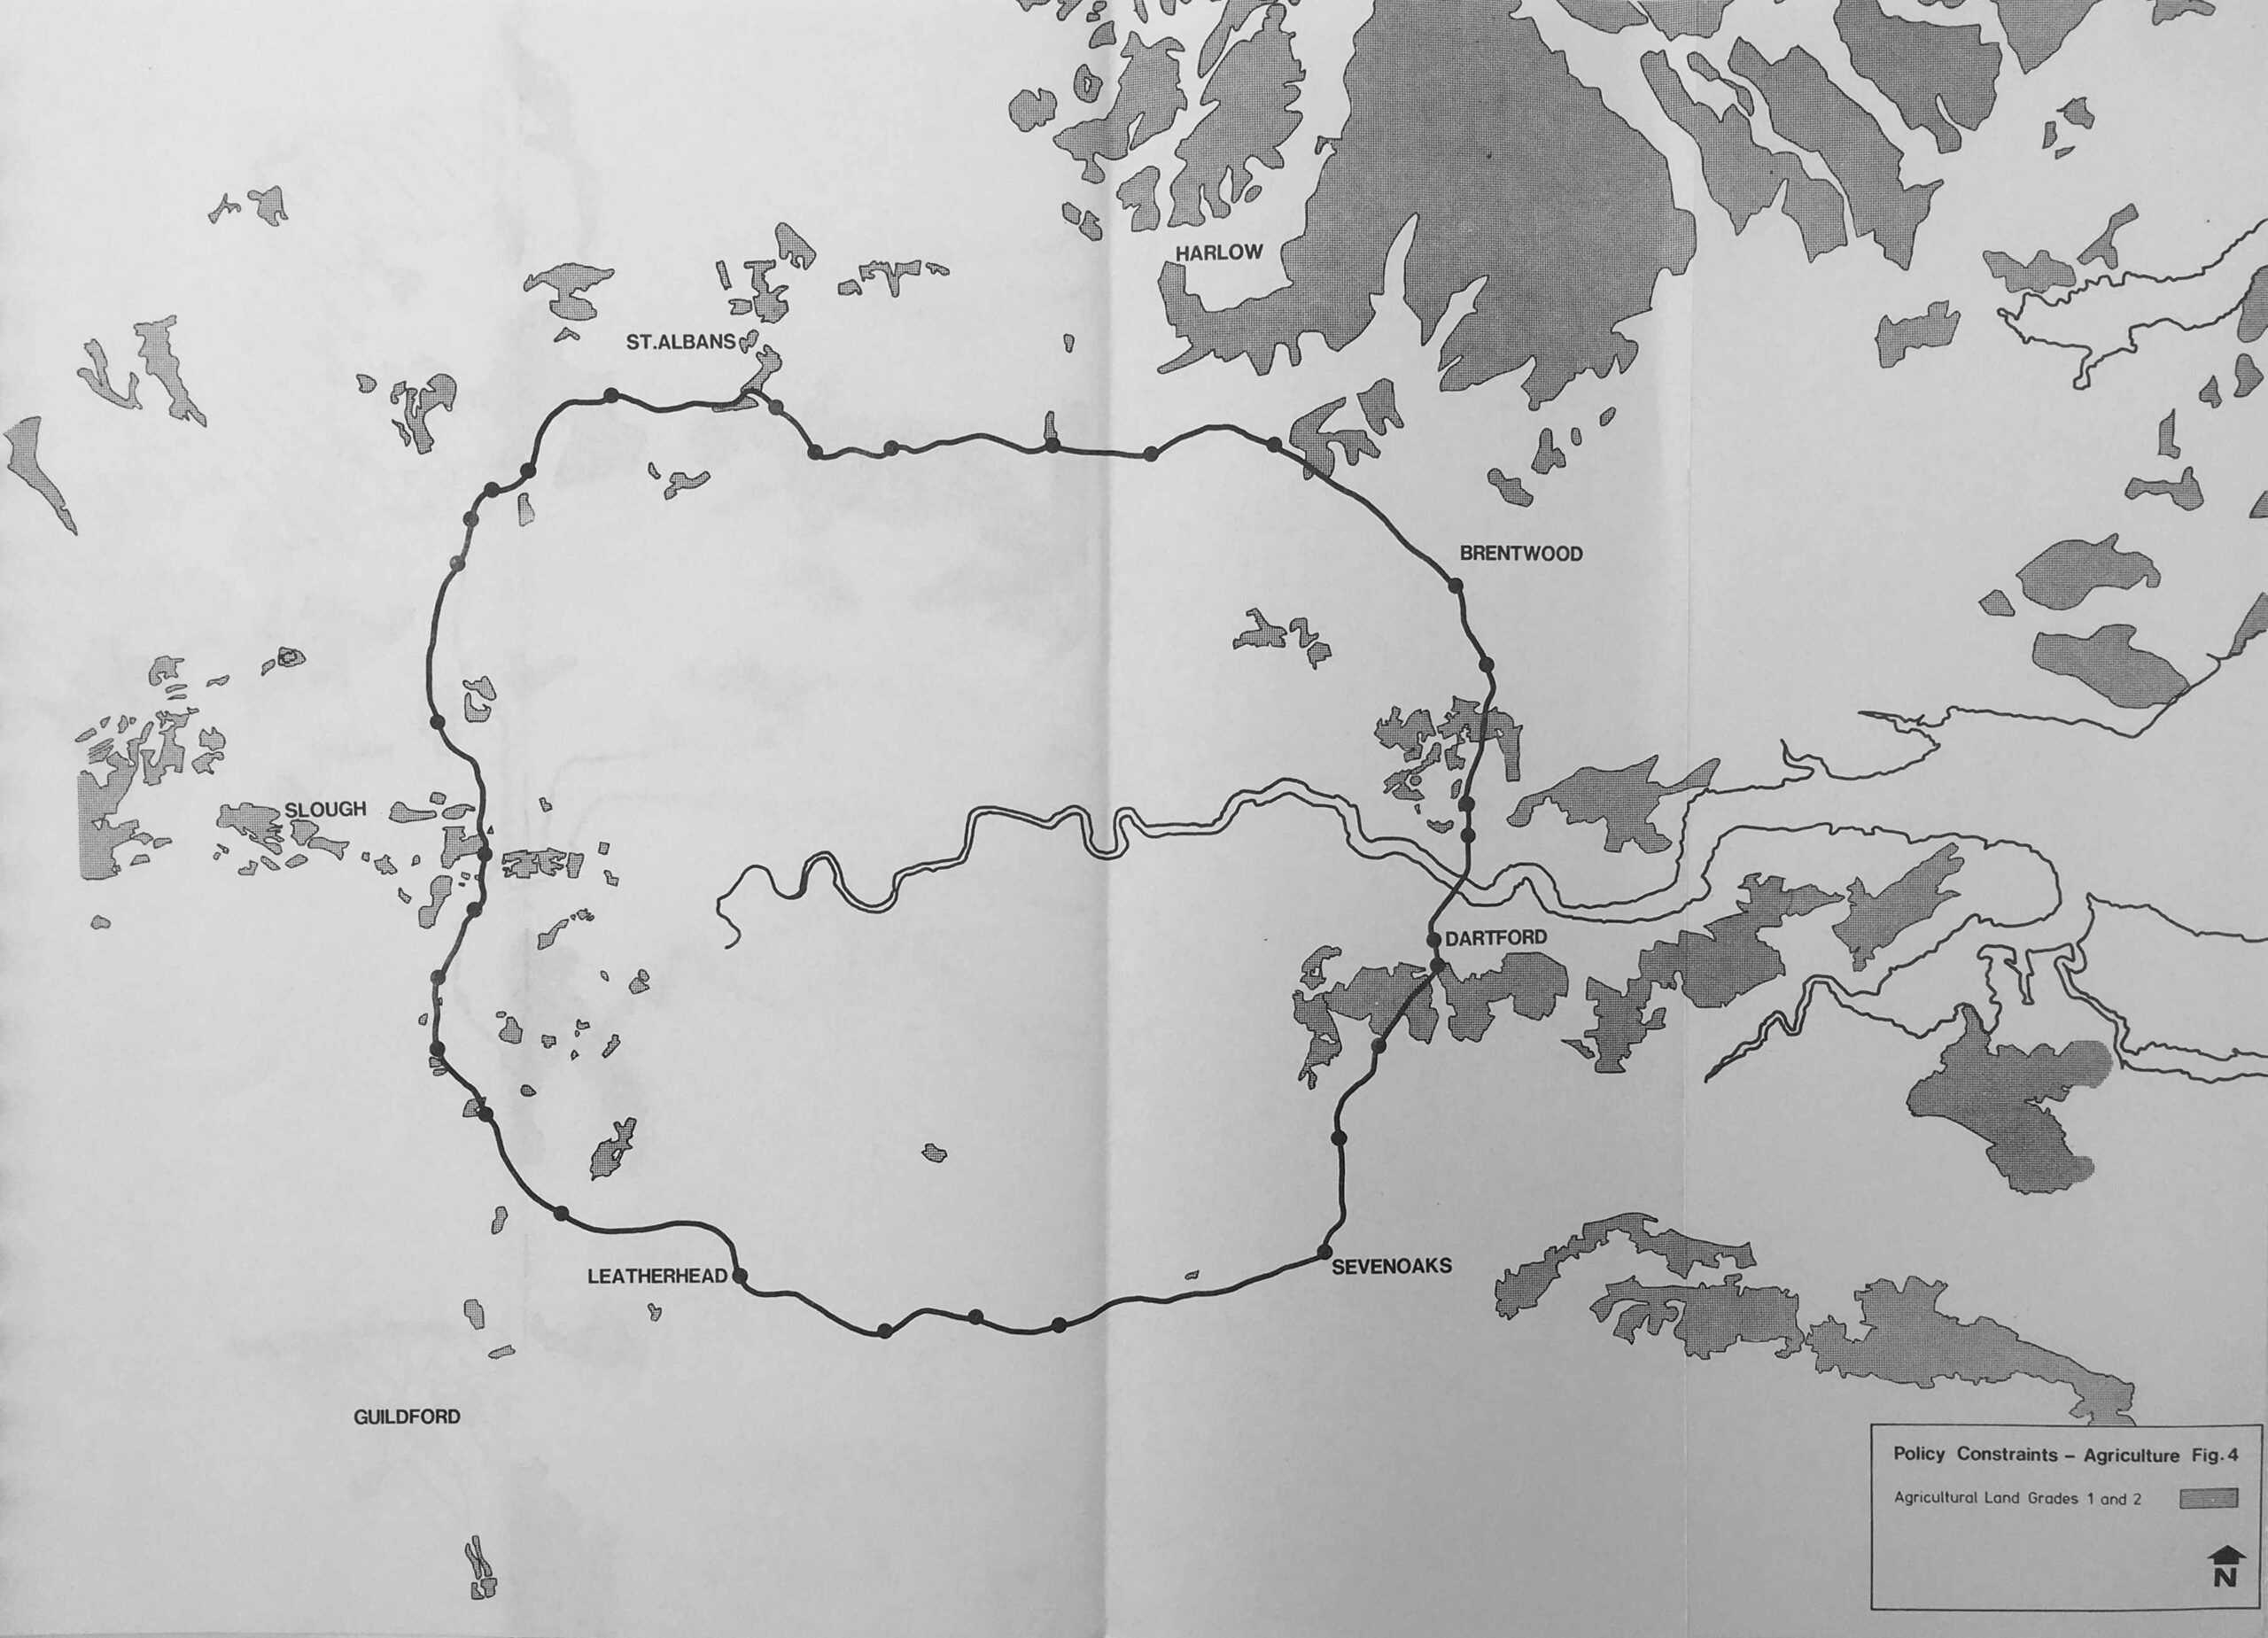
Being close to the M25 could result in development pressures to these areas of high grade agricultural land, and these, along with the Green Belt were considered landscape constraints on where additional development could take place, and where proposals for development would threaten the natural environment and the production of food.
As well as agricultural land, a trip around the M25 provides an insight into the underlying geology of the land surrounding London. From the heathlands as you exit the M25 onto the M3, the flat, open lands of Essex as you exit onto the A13 and A127, and the chalk hills around the south of the M25.
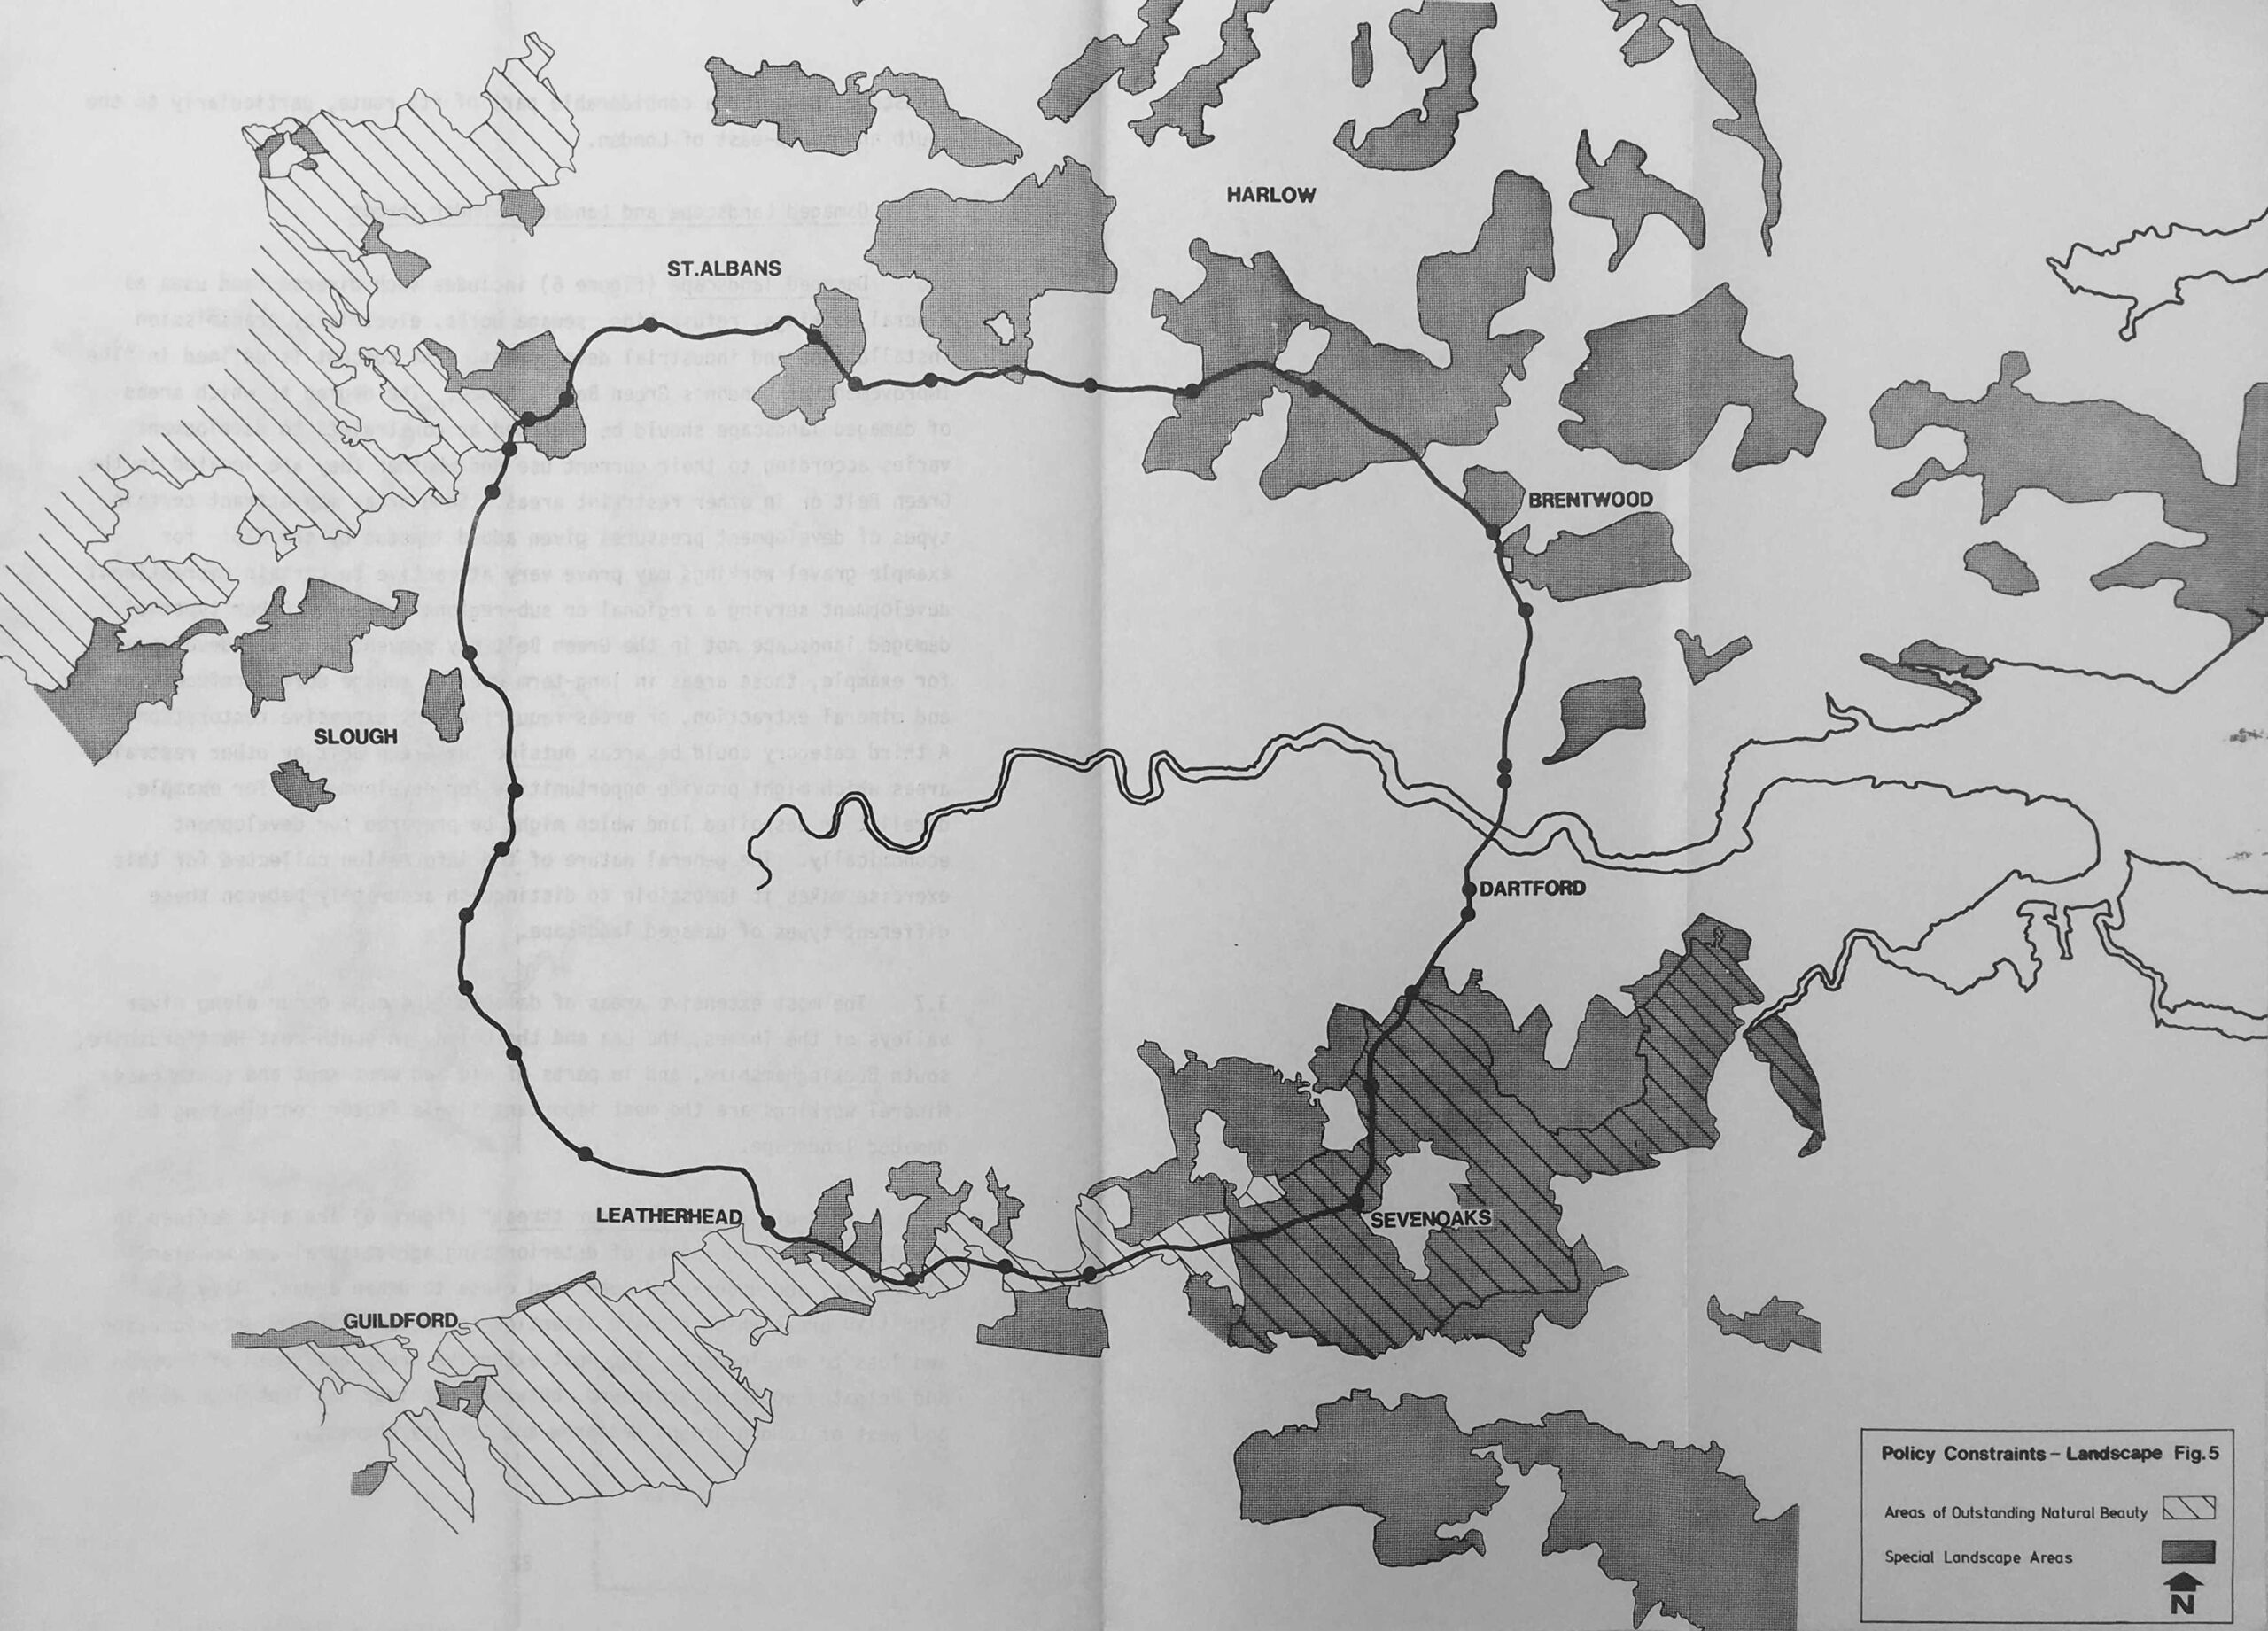
Green Belt and agricultural land added to the policy constraints for land development around the M25, with Areas of Outstanding Natural Beauty and Special Landscape Areas also needing to be considered. The scope of these are shown in the following map from the report:
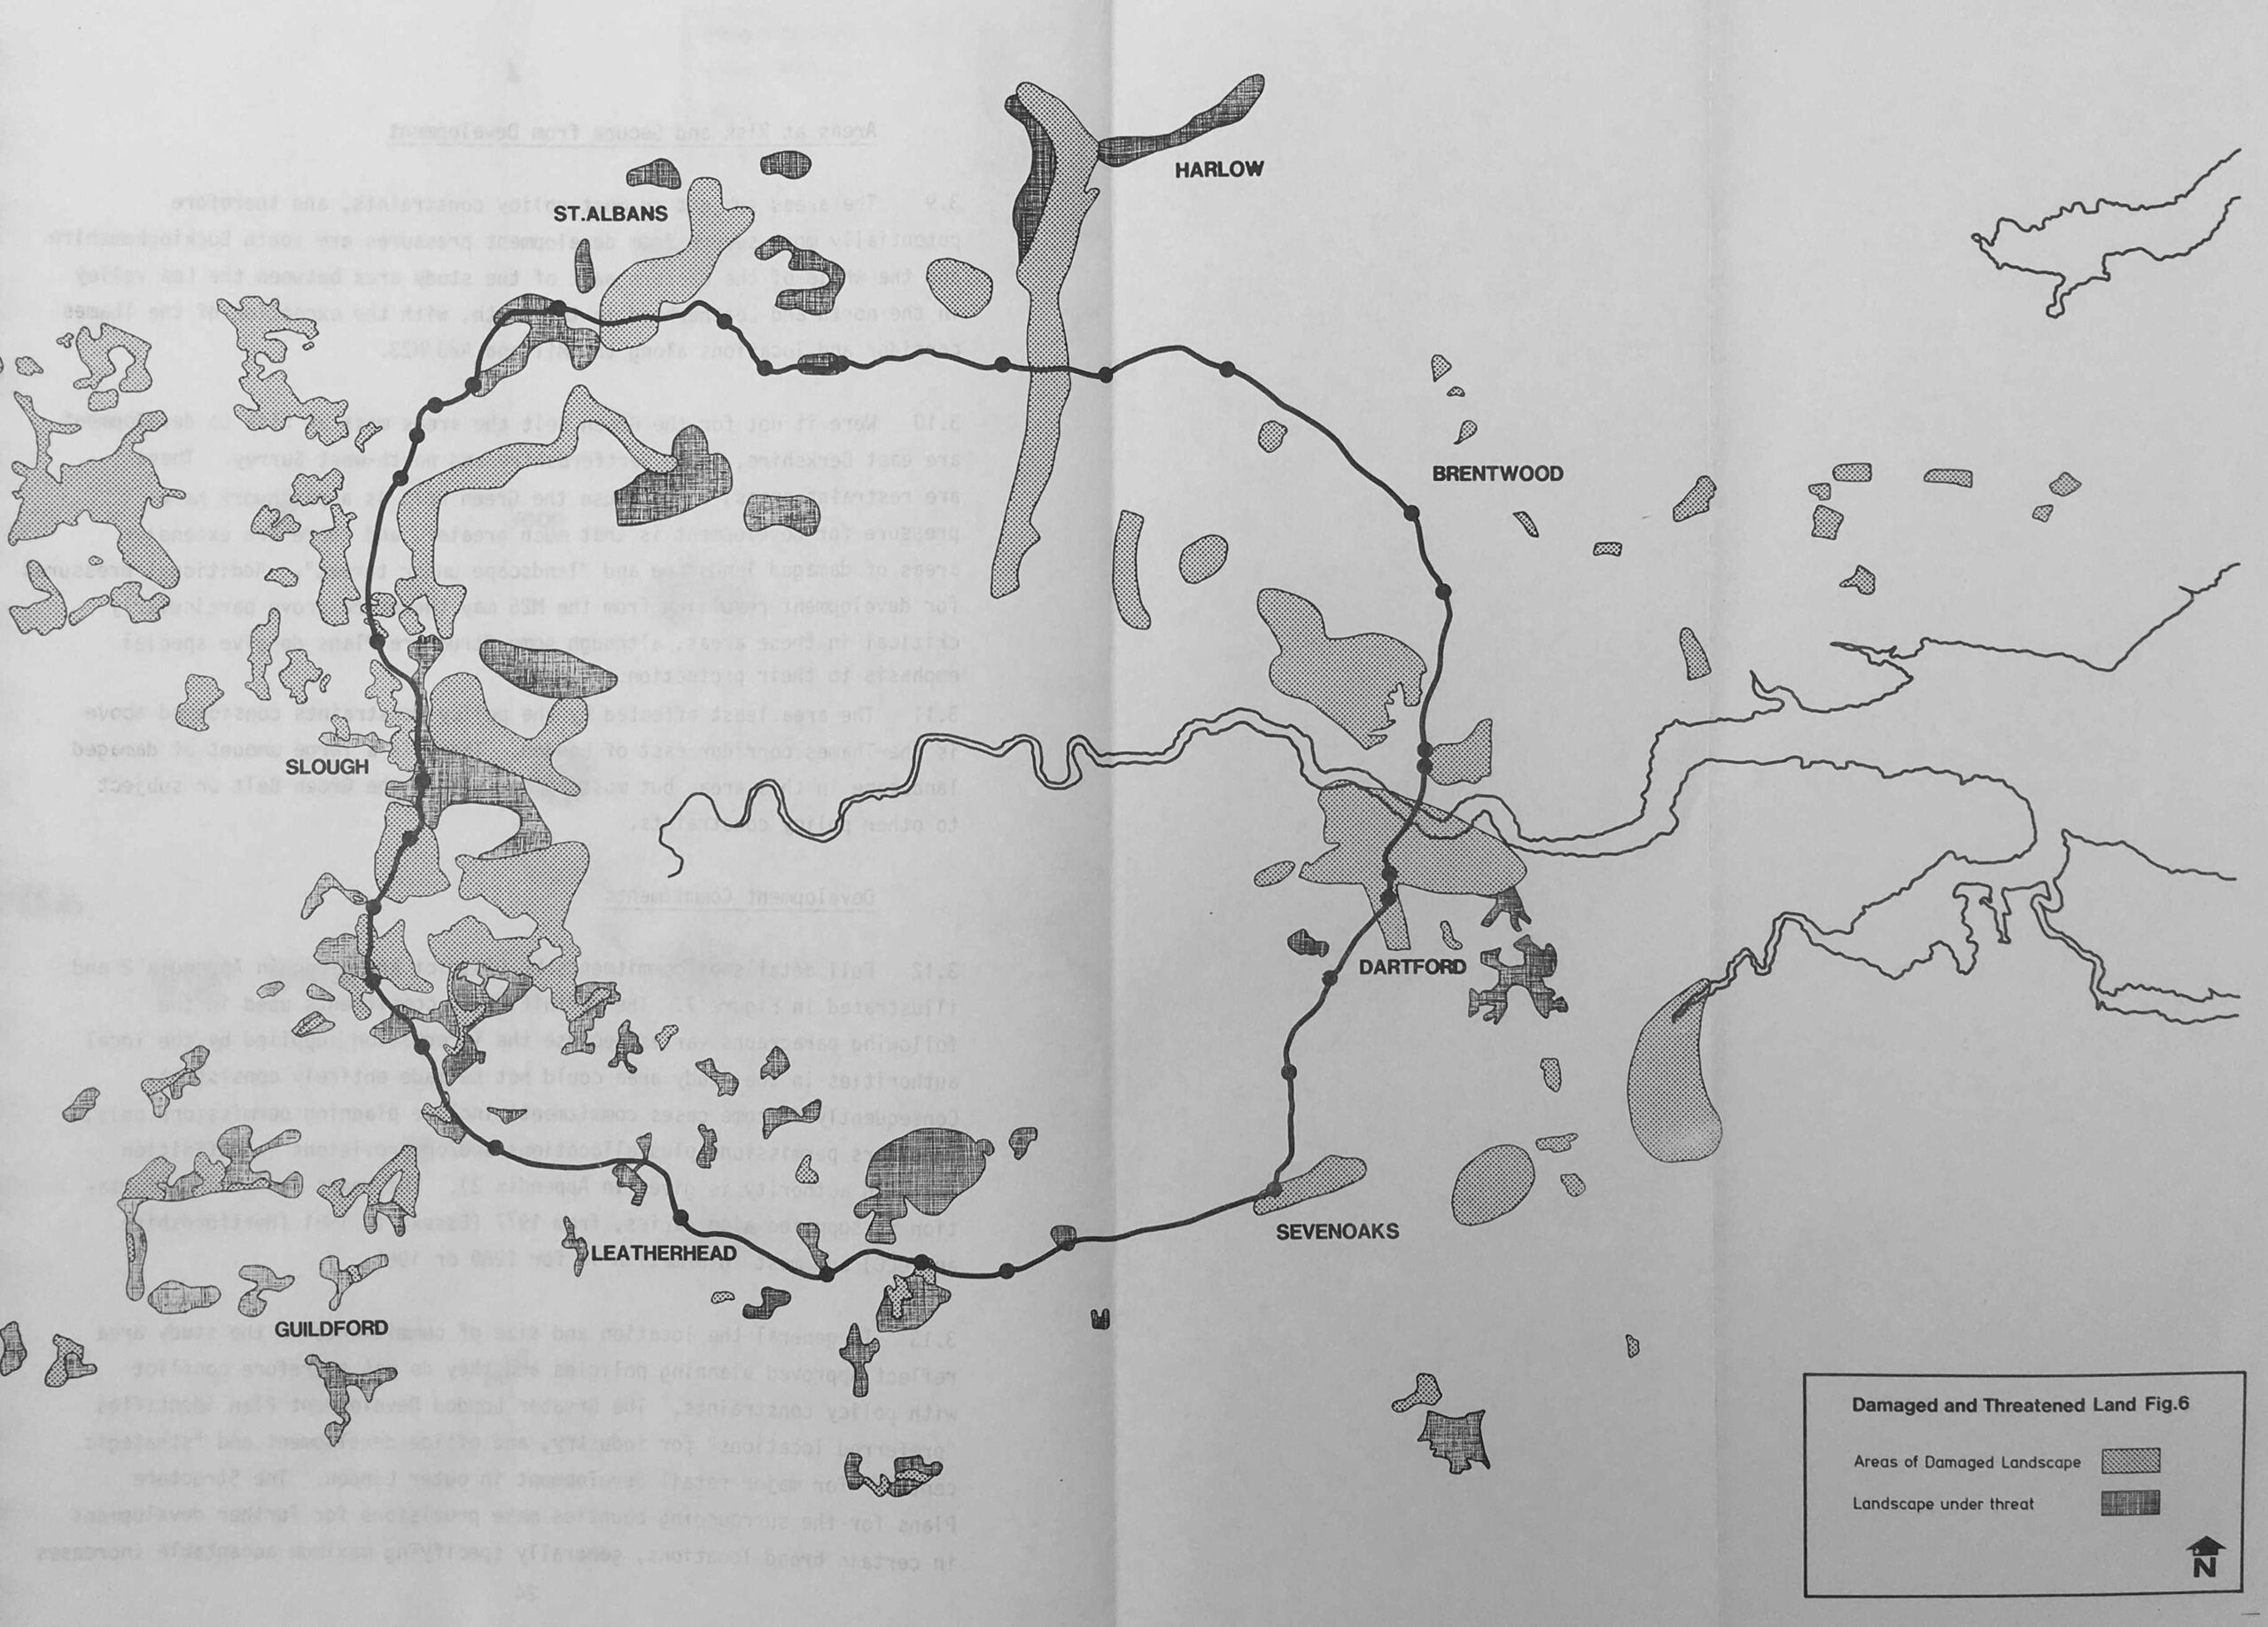
As well as natural and agricultural areas that were protected, there were also what the report classified as “Damaged Landscapes” which was land that had, or was being used as mineral workings, refuse tips, sewage works, electricity transmission installations and industrial development.
The report identified that some of these damaged landscapes, such as gravel working could be used for other purpose, such as recreational uses, but cautioned that areas used for refuse tips, mineral workings and sewage works would require very expensive restoration works.
The report also included “landscape under threat” which included deteriorating agricultural and woodland, as well as under-used open land close to urban areas (it is interesting that land always needs to be “used” and cannot just be left).
The areas of land included in these two categories are shown in the following map:
I well remember some of these “damaged landscapes”. As a child, an outing to Kent required a drive through the Dartford Tunnel, (which was built before the M25). On the approach to the tunnel from Essex, there were chalk quarries and cement factories on either side of the road.
These places were always coated in a thick grey dust, and I found a couple of photos on the excellent Geograph site showing the cement industry in West Thurrock:
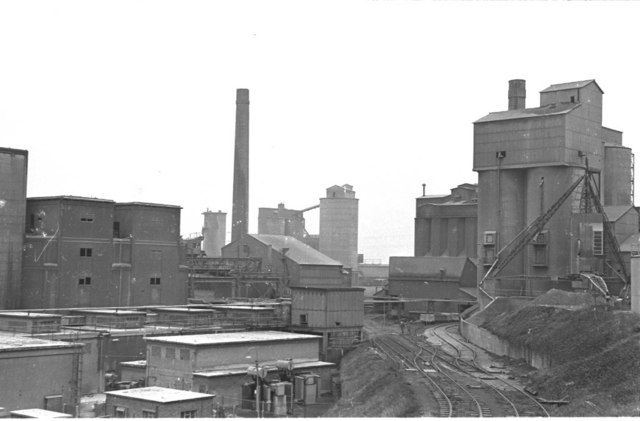
cc-by-sa/2.0 – © Pierre Terre – geograph.org.uk/p/134125
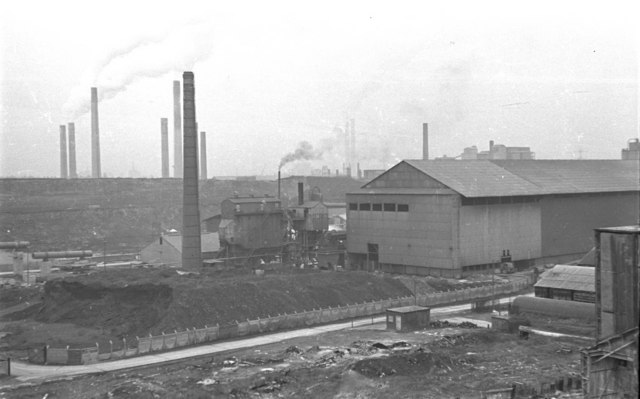
cc-by-sa/2.0 – © Pierre Terre – geograph.org.uk/p/134155
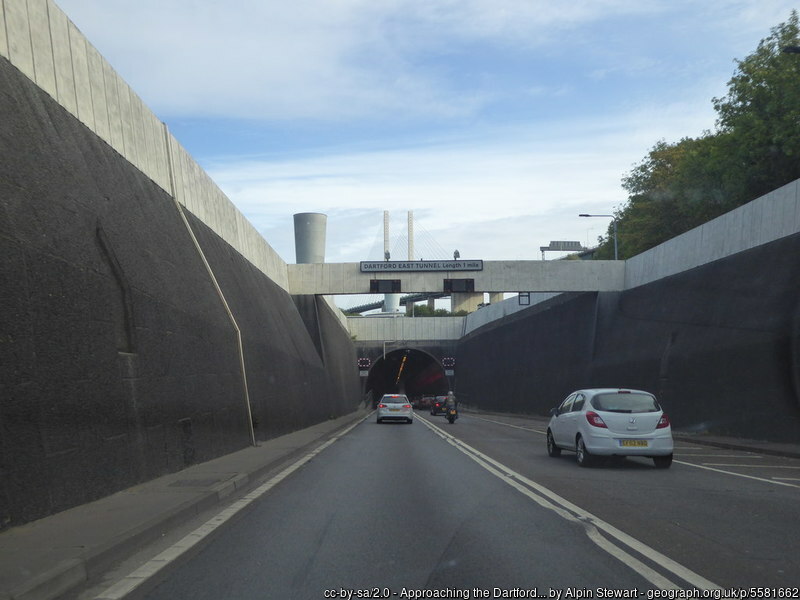
The nearby Dartford Tunnels (now the Dartford Crossing with the addition of the bridge), is a major part of the M25, although not being officially part of it as the crossing still carries the designation of A282.
The first Dartford Tunnel was planned in the 1930s, and construction work did start, but was soon halted by the outbreak of the Second World War.
Work recommenced in 1959, and the first tunnel opened four years later in 1963. This was a single tunnel with two carriageways to carry traffic in both directions under the river. Crossing through the tunnel required the payment of a toll.
Traffic through the tunnel increased significantly and a second tunnel was planned, a key upgrade given that the M25 was also bang planned.
Money to fund the project was in short supply in the early 1970s, however funding was granted from the European Economic Community, allowing construction of the second tunnel to start in 1974, opening to traffic in 1980, with one tunnel being used for traffic from north to south, and the other tunnel used for south to north traffic.
Entrance to one of the Dartford Tunnels:
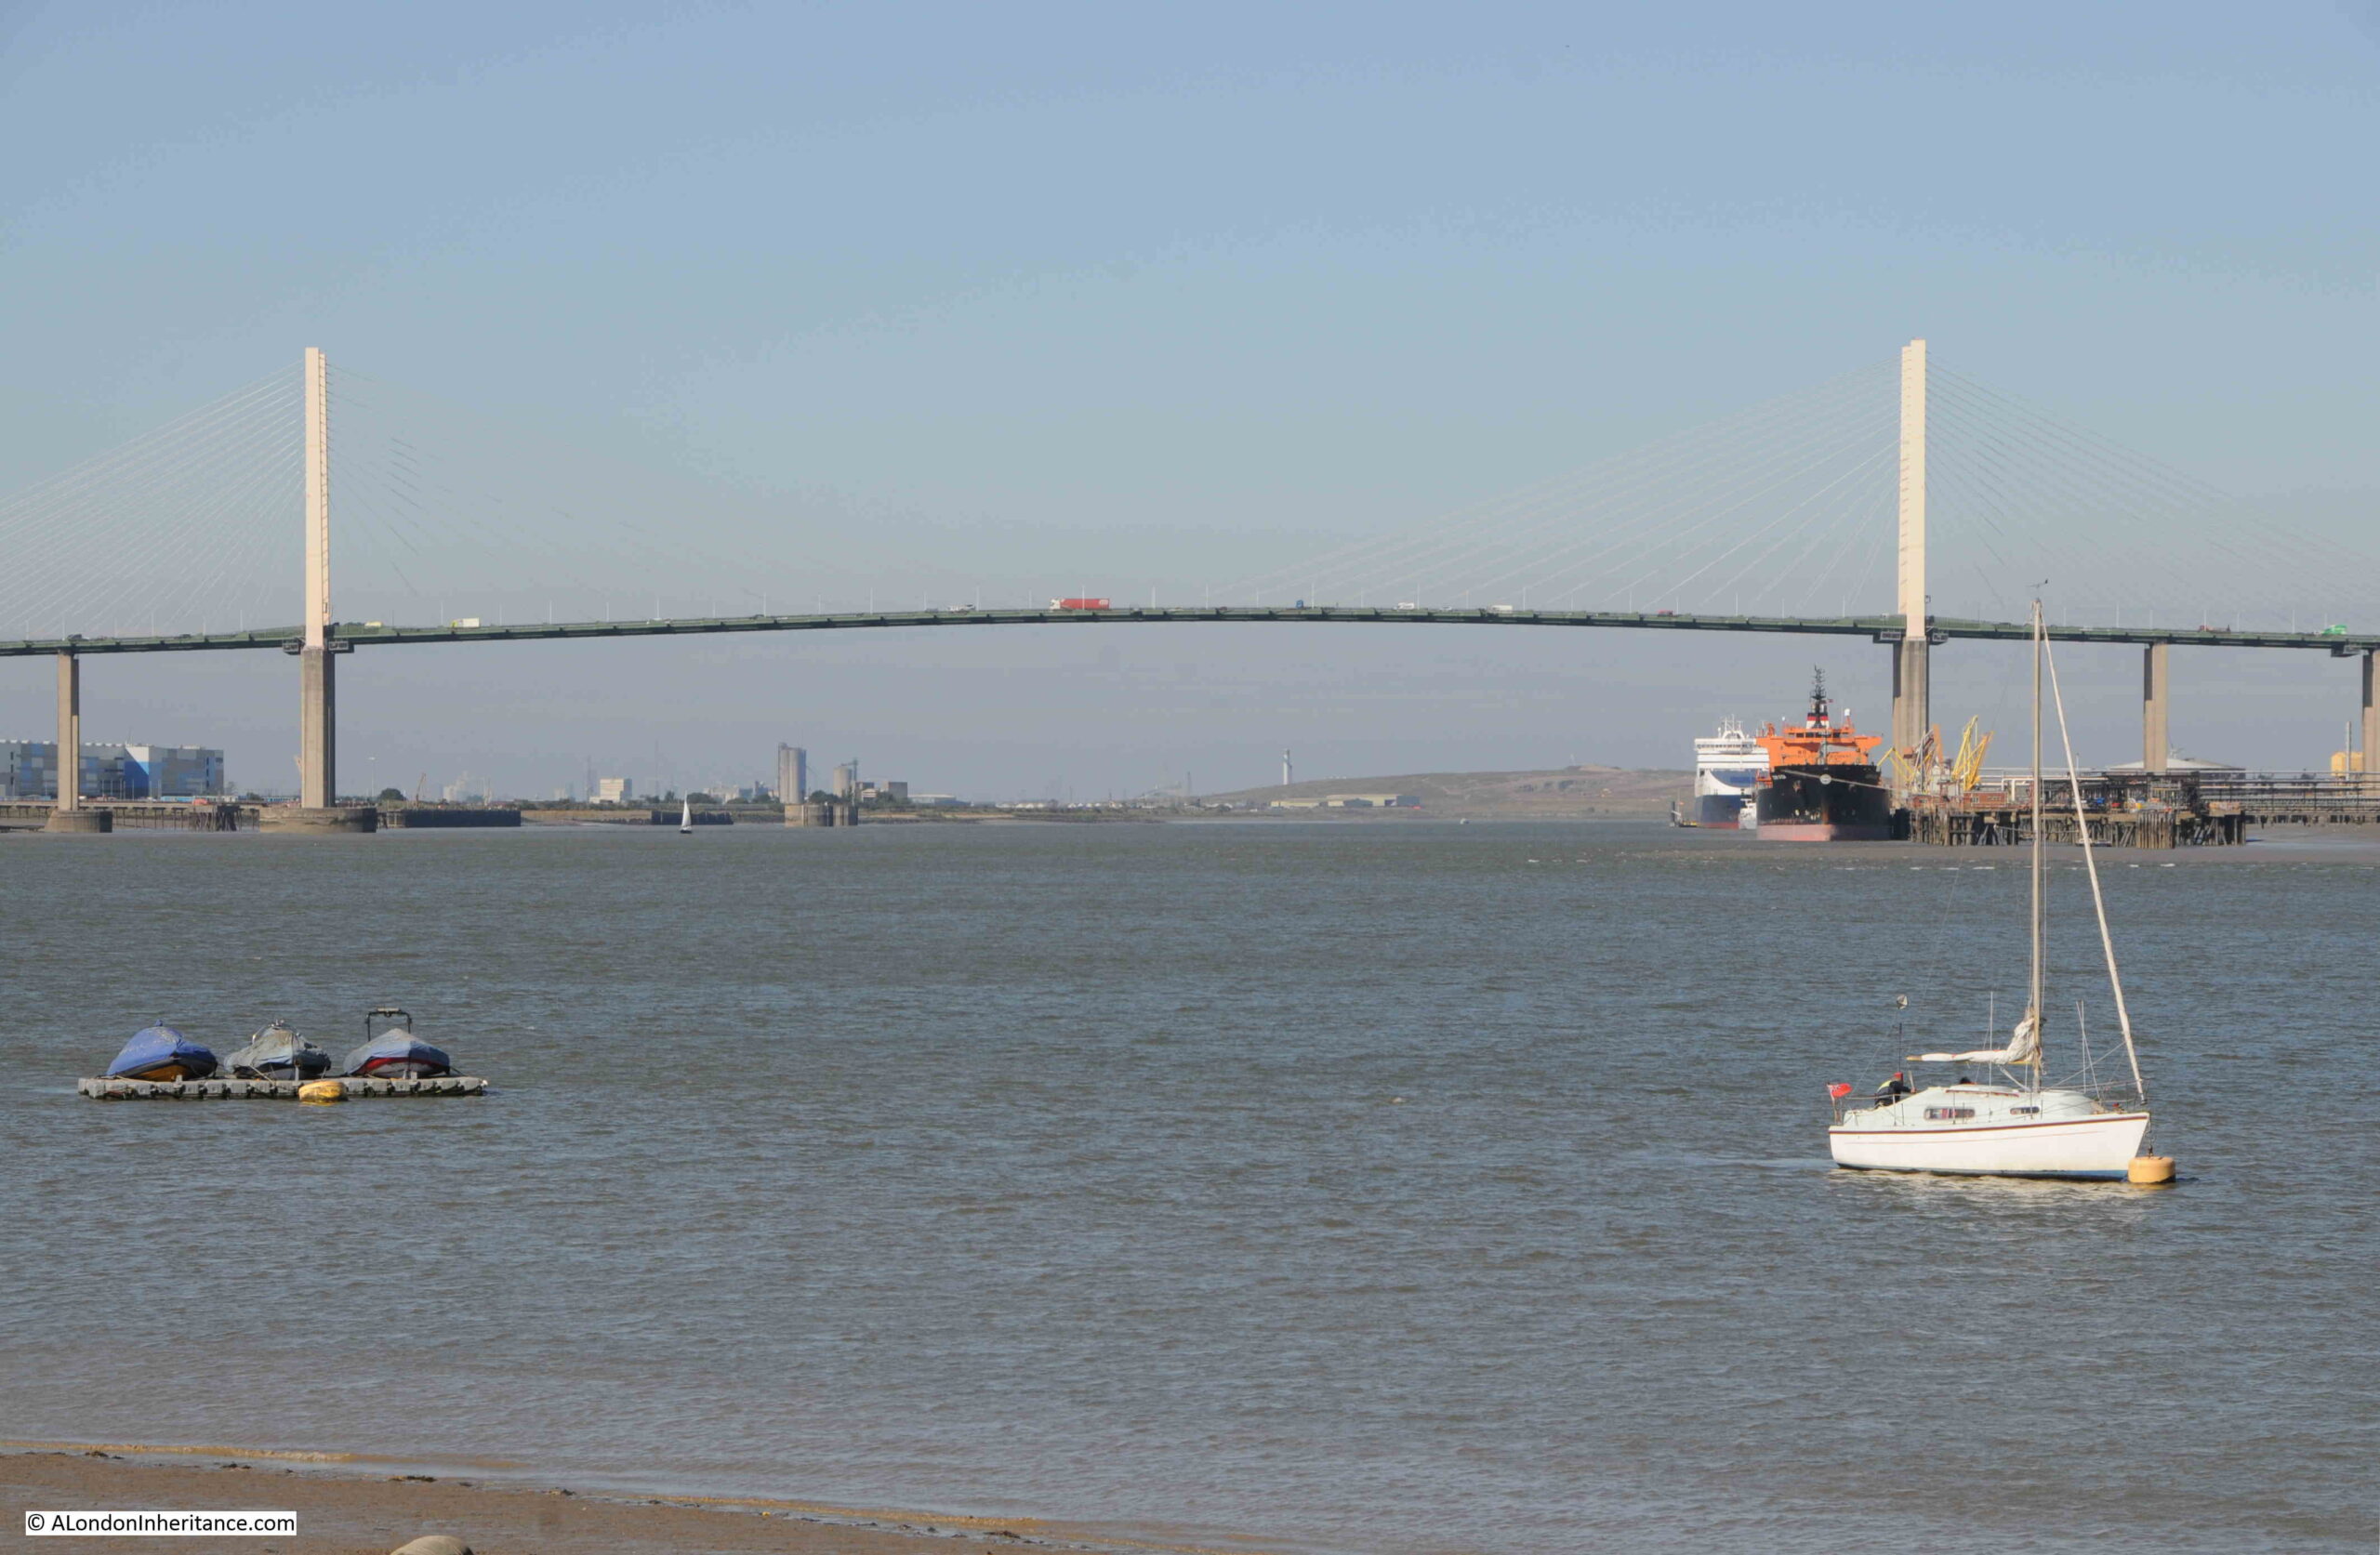
Even the two tunnels were insufficient for the increasing volumes of traffic once the M25 had opened, and starting in the late 1980s, construction started on the Queen Elizabeth II bridge, which opened in 1991.
The bridge now takes traffic running from north to south, with the two tunnels carrying traffic from south to north.
View of the Queen Elizabeth II bridge from near the Swanscombe Peninsula:
A journey across the Dartford Crossing, whether through the tunnels or across the bridge has always attracted a toll, which was originally used to cover the costs of construction. Toll booths once collected payment, however there have now been replaced by automatic number plate recognition, and online payment.
I found some figures for the tolls dating from the financial year 2016 – 2017, when the crossing generated almost £205 million, with £92 million coming from fines for unpaid fees, with a further £42 million of unpaid fines being written off as being unenforceable.
The latest traffic figures from National Highways shows that the Dartford Crossing carries more than 180,000 on its busiest days, with the highest amount recorded of 206,713 vehicles, on the 20th of February 2018.
The report tried to identify areas where there were a major development commitment. This data was dependent on local authorities, who provided data from different time periods and different classifications of development, but the plan attempted to identify the main sites and types of proposed developments:
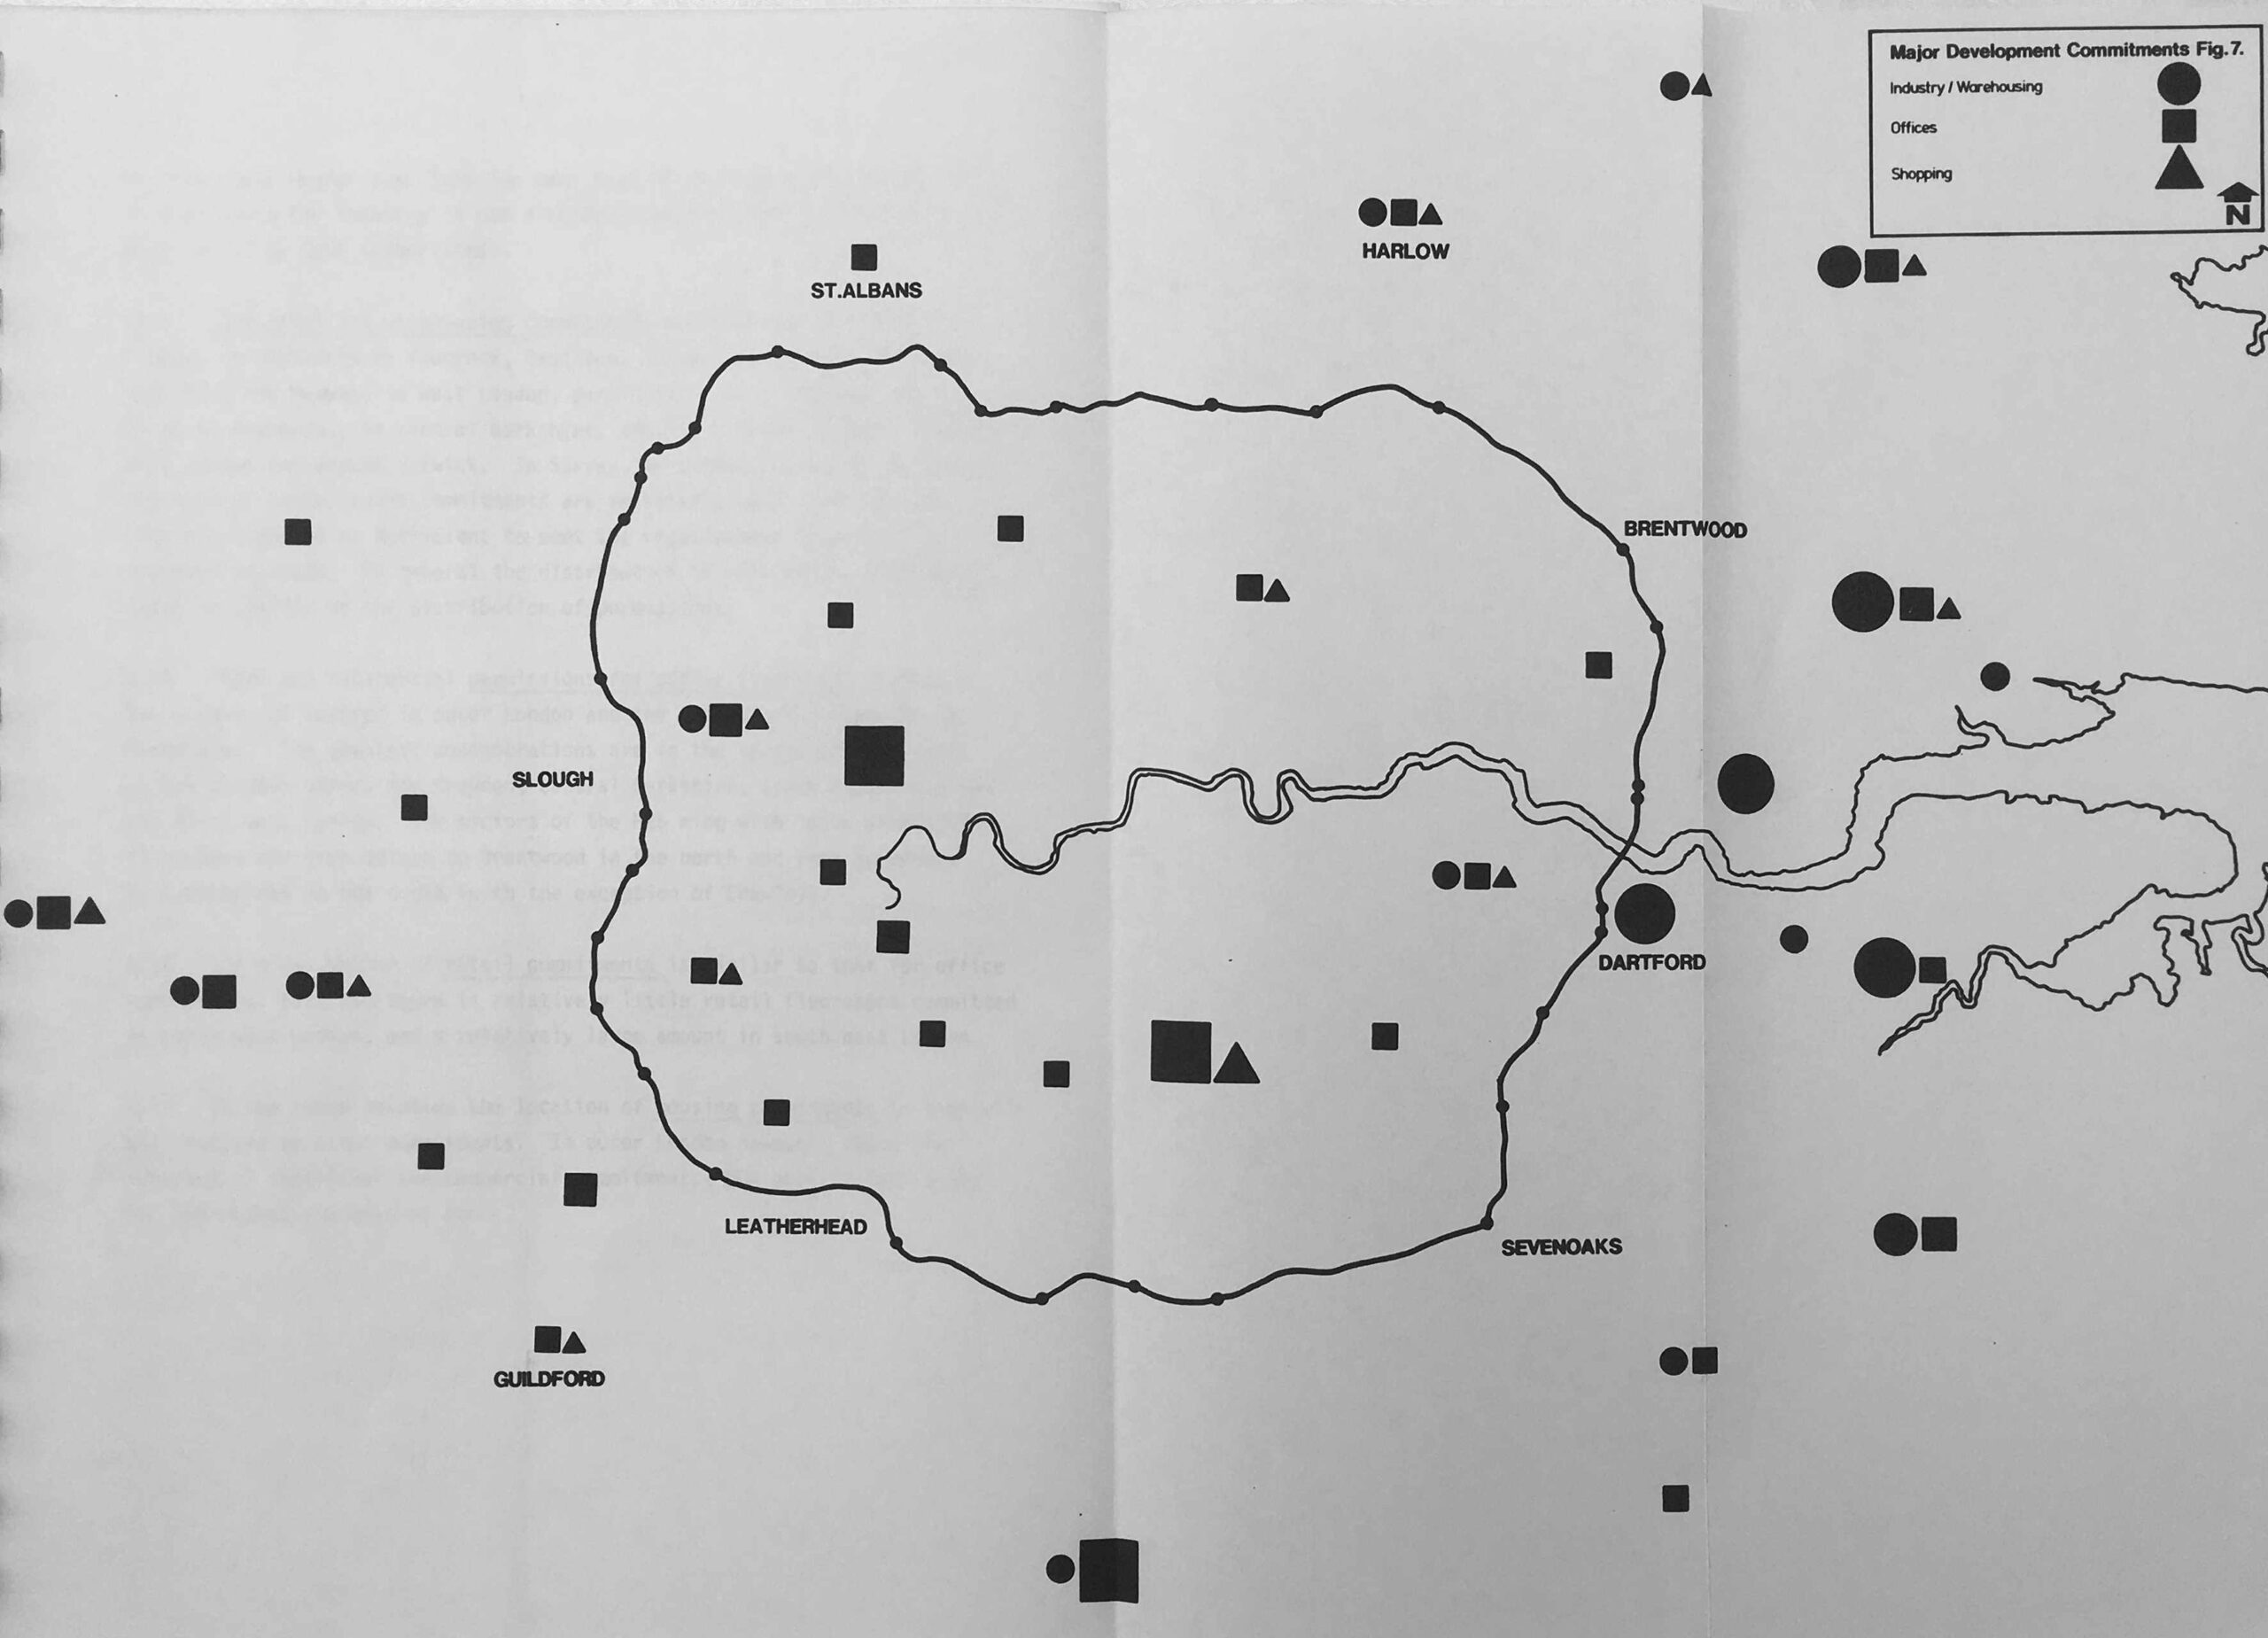
Taking one area as an example, to the east, around the river crossing, large circles are shown to north and south of the river for industry and warehousing, with no identification of any planned shopping developments (shown as a small triangle in the above map).
This would change very quickly, with the Lakeside Shopping Centre being built in an old chalk quarry in the second half of the 1980s, in West Thurrock on the north side of the river, and the Bluewater Shopping Centre being built in the second half of the 1990s, again in a former chalk quarry, on the south side of the river.
The M25 provided a wide catchment area for these two shopping centres.
The area around the Dartford Crossing continues to be developed. The old oil and coal fired Littlebrook Power Station complex on the south side of the river next to the Dartford Cross has been demolished in recent years, and the area is now subject to major redevelopment with large numbers of warehouses which take advantage of easy access to the M25.
The M25 has also helped with the expansion of passenger numbers to London’s main airports, with both the M25, and motorways radiating out such as the M23 and M1 opening up large catchment areas for Heathrow, Gatwick and Luton airports.
Whilst the M25 has helped these airports attract passengers, the M25 has caused problems with any possible expansion of Heathrow, with the motorway being in the way of a number of possible options for an additional runway.
At the time of the report, there was an inquiry into the proposal to site London’s third airport at Stansted, and the report was sure that the M25 would have a positive impact on the development of Stansted, but would lead to greater pressures for development in the surrounding areas.
The report identified that the impact of the M25 would be major development pressures on many areas bordering the M25, whether retail, such as at Lakeside and Bluewater, warehousing and offices and residential developments.
As well as providing a simplified route around London, and between the major routes heading out of, and into London, the report highlighted the expected significant time savings.
The diagram below shows expected time savings based on a 1980 GLC Department of Planning and Transportation paper:
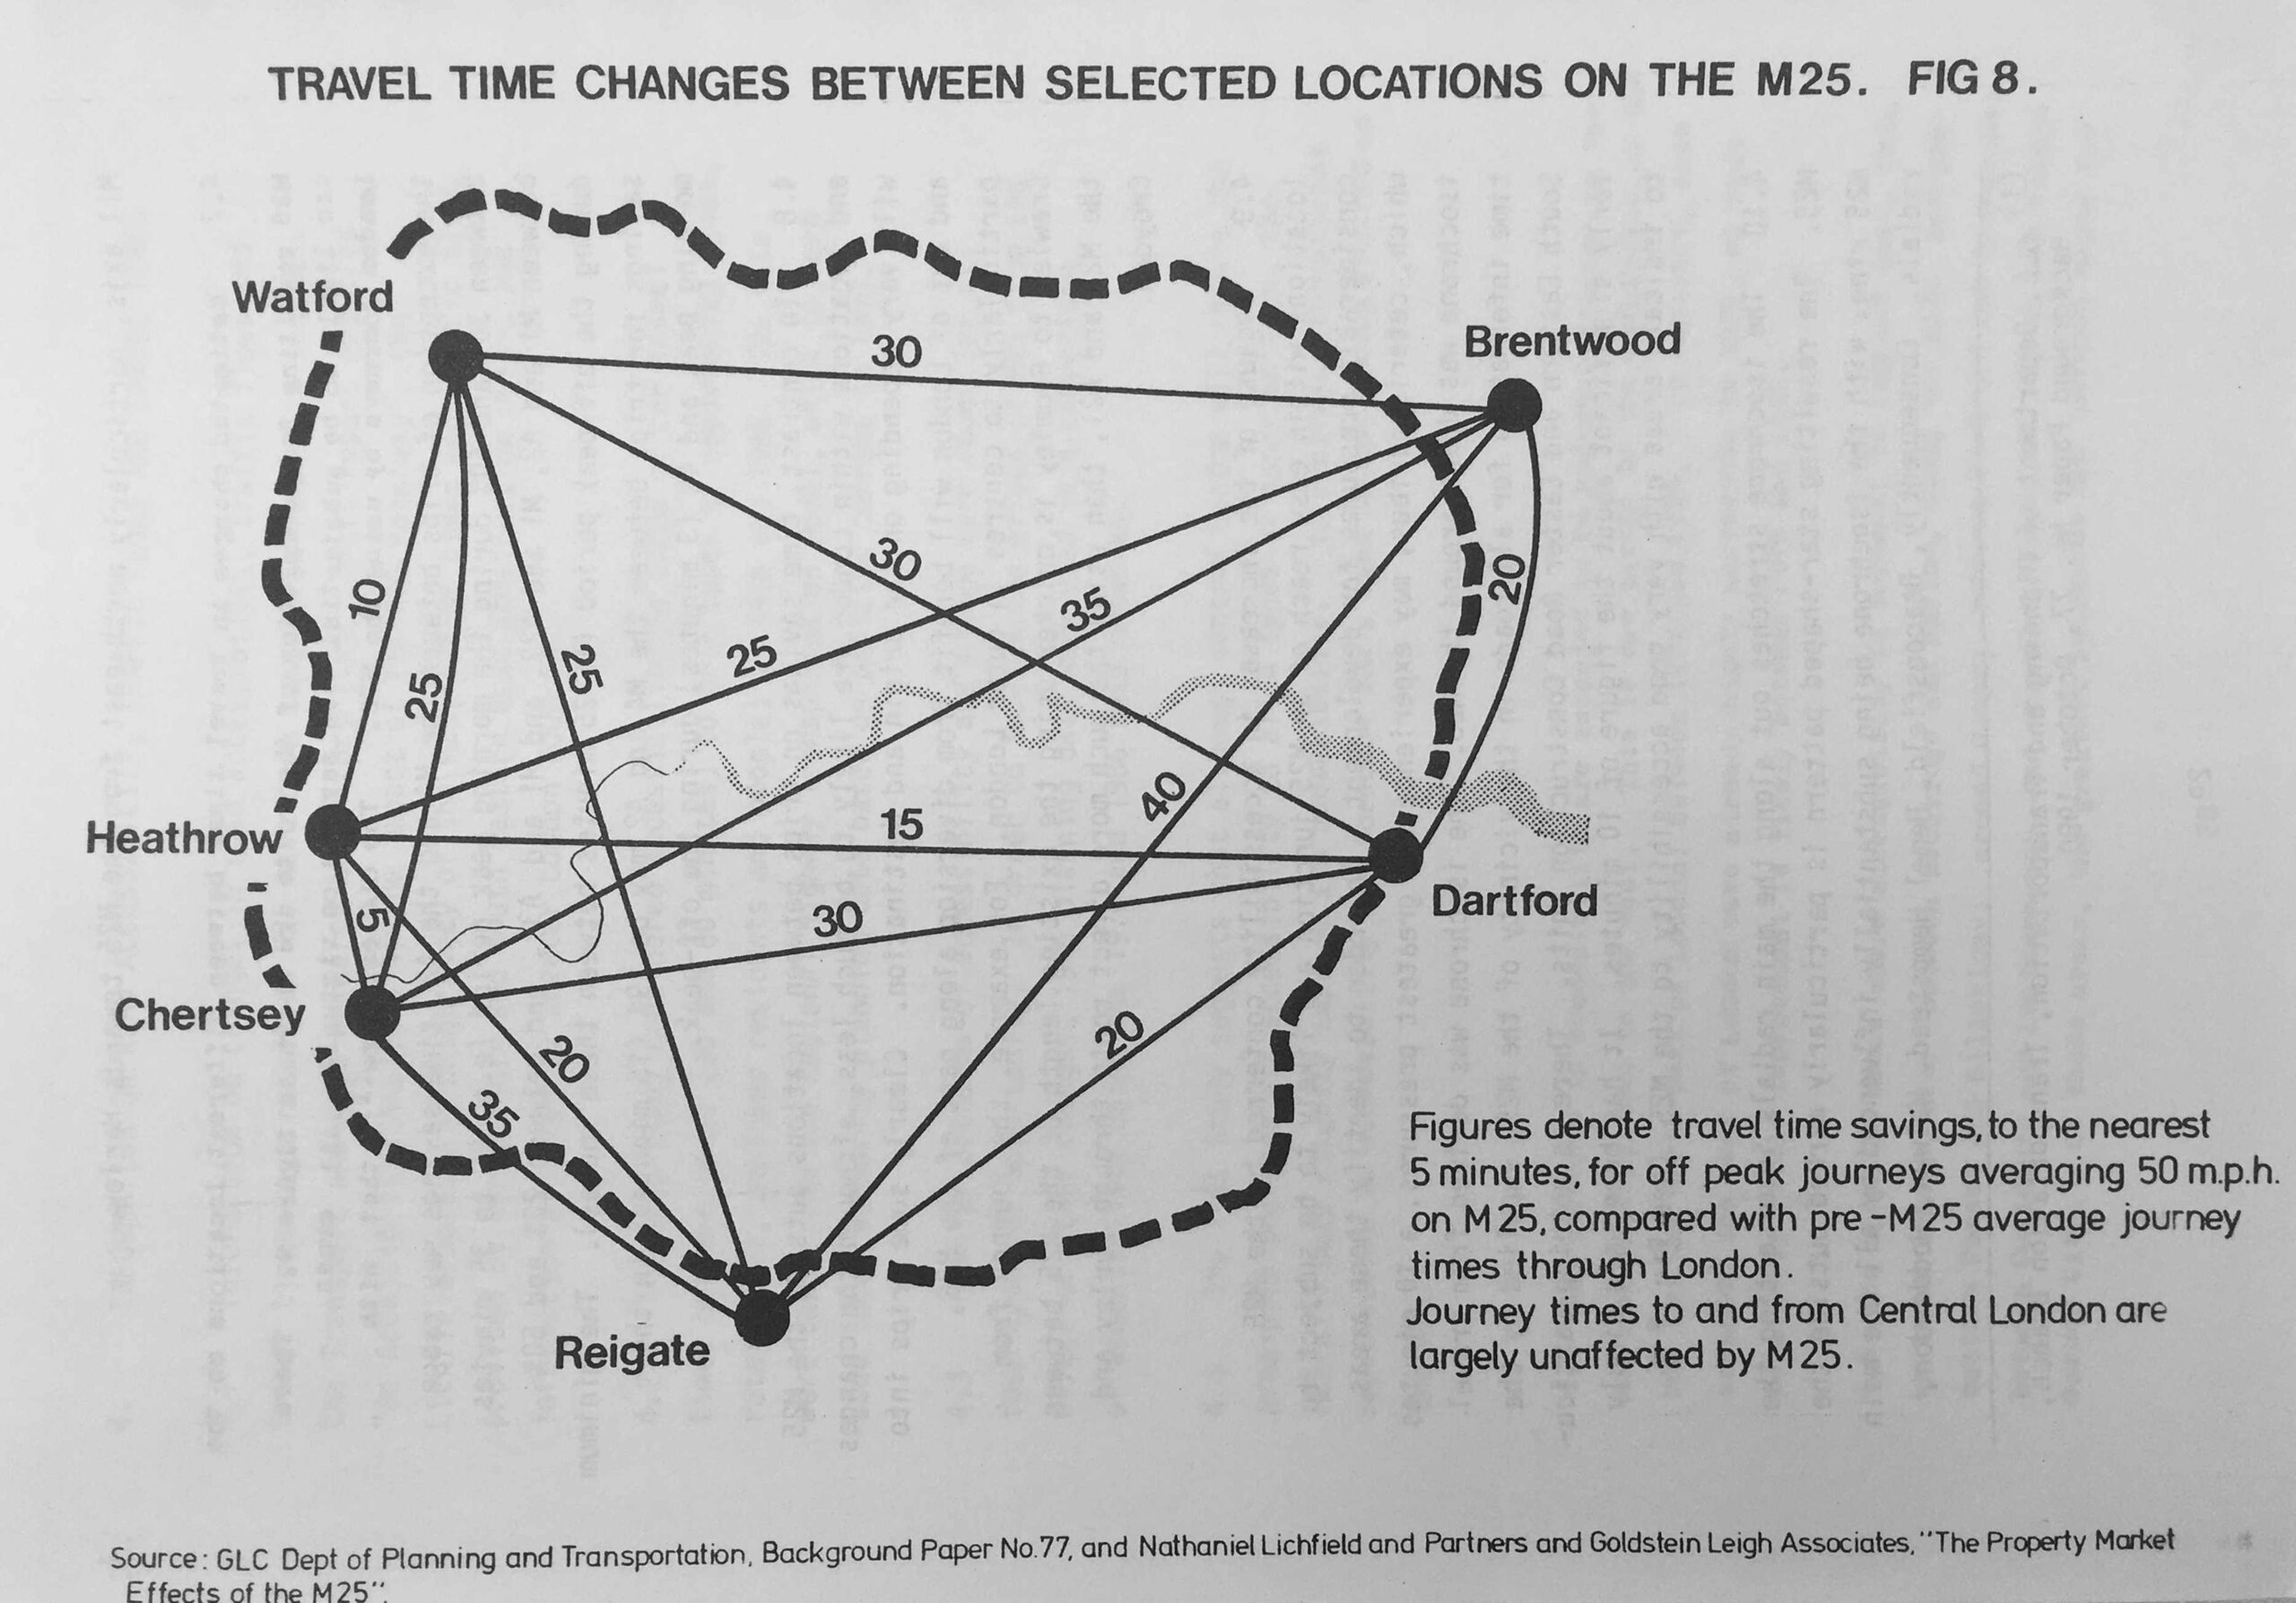
As an example, the diagram shows an expected time saving of 25 minutes between Brentwood in Essex and Heathrow, making flights from the airport a much easier option for those living in Essex. It would be interesting to see if these time savings were still achievable.
The extent of the impact of the M25 is shown in the following map, The M25 is the dark line circling the city. The inner and outer lines show the area within 10 minutes of the M25:
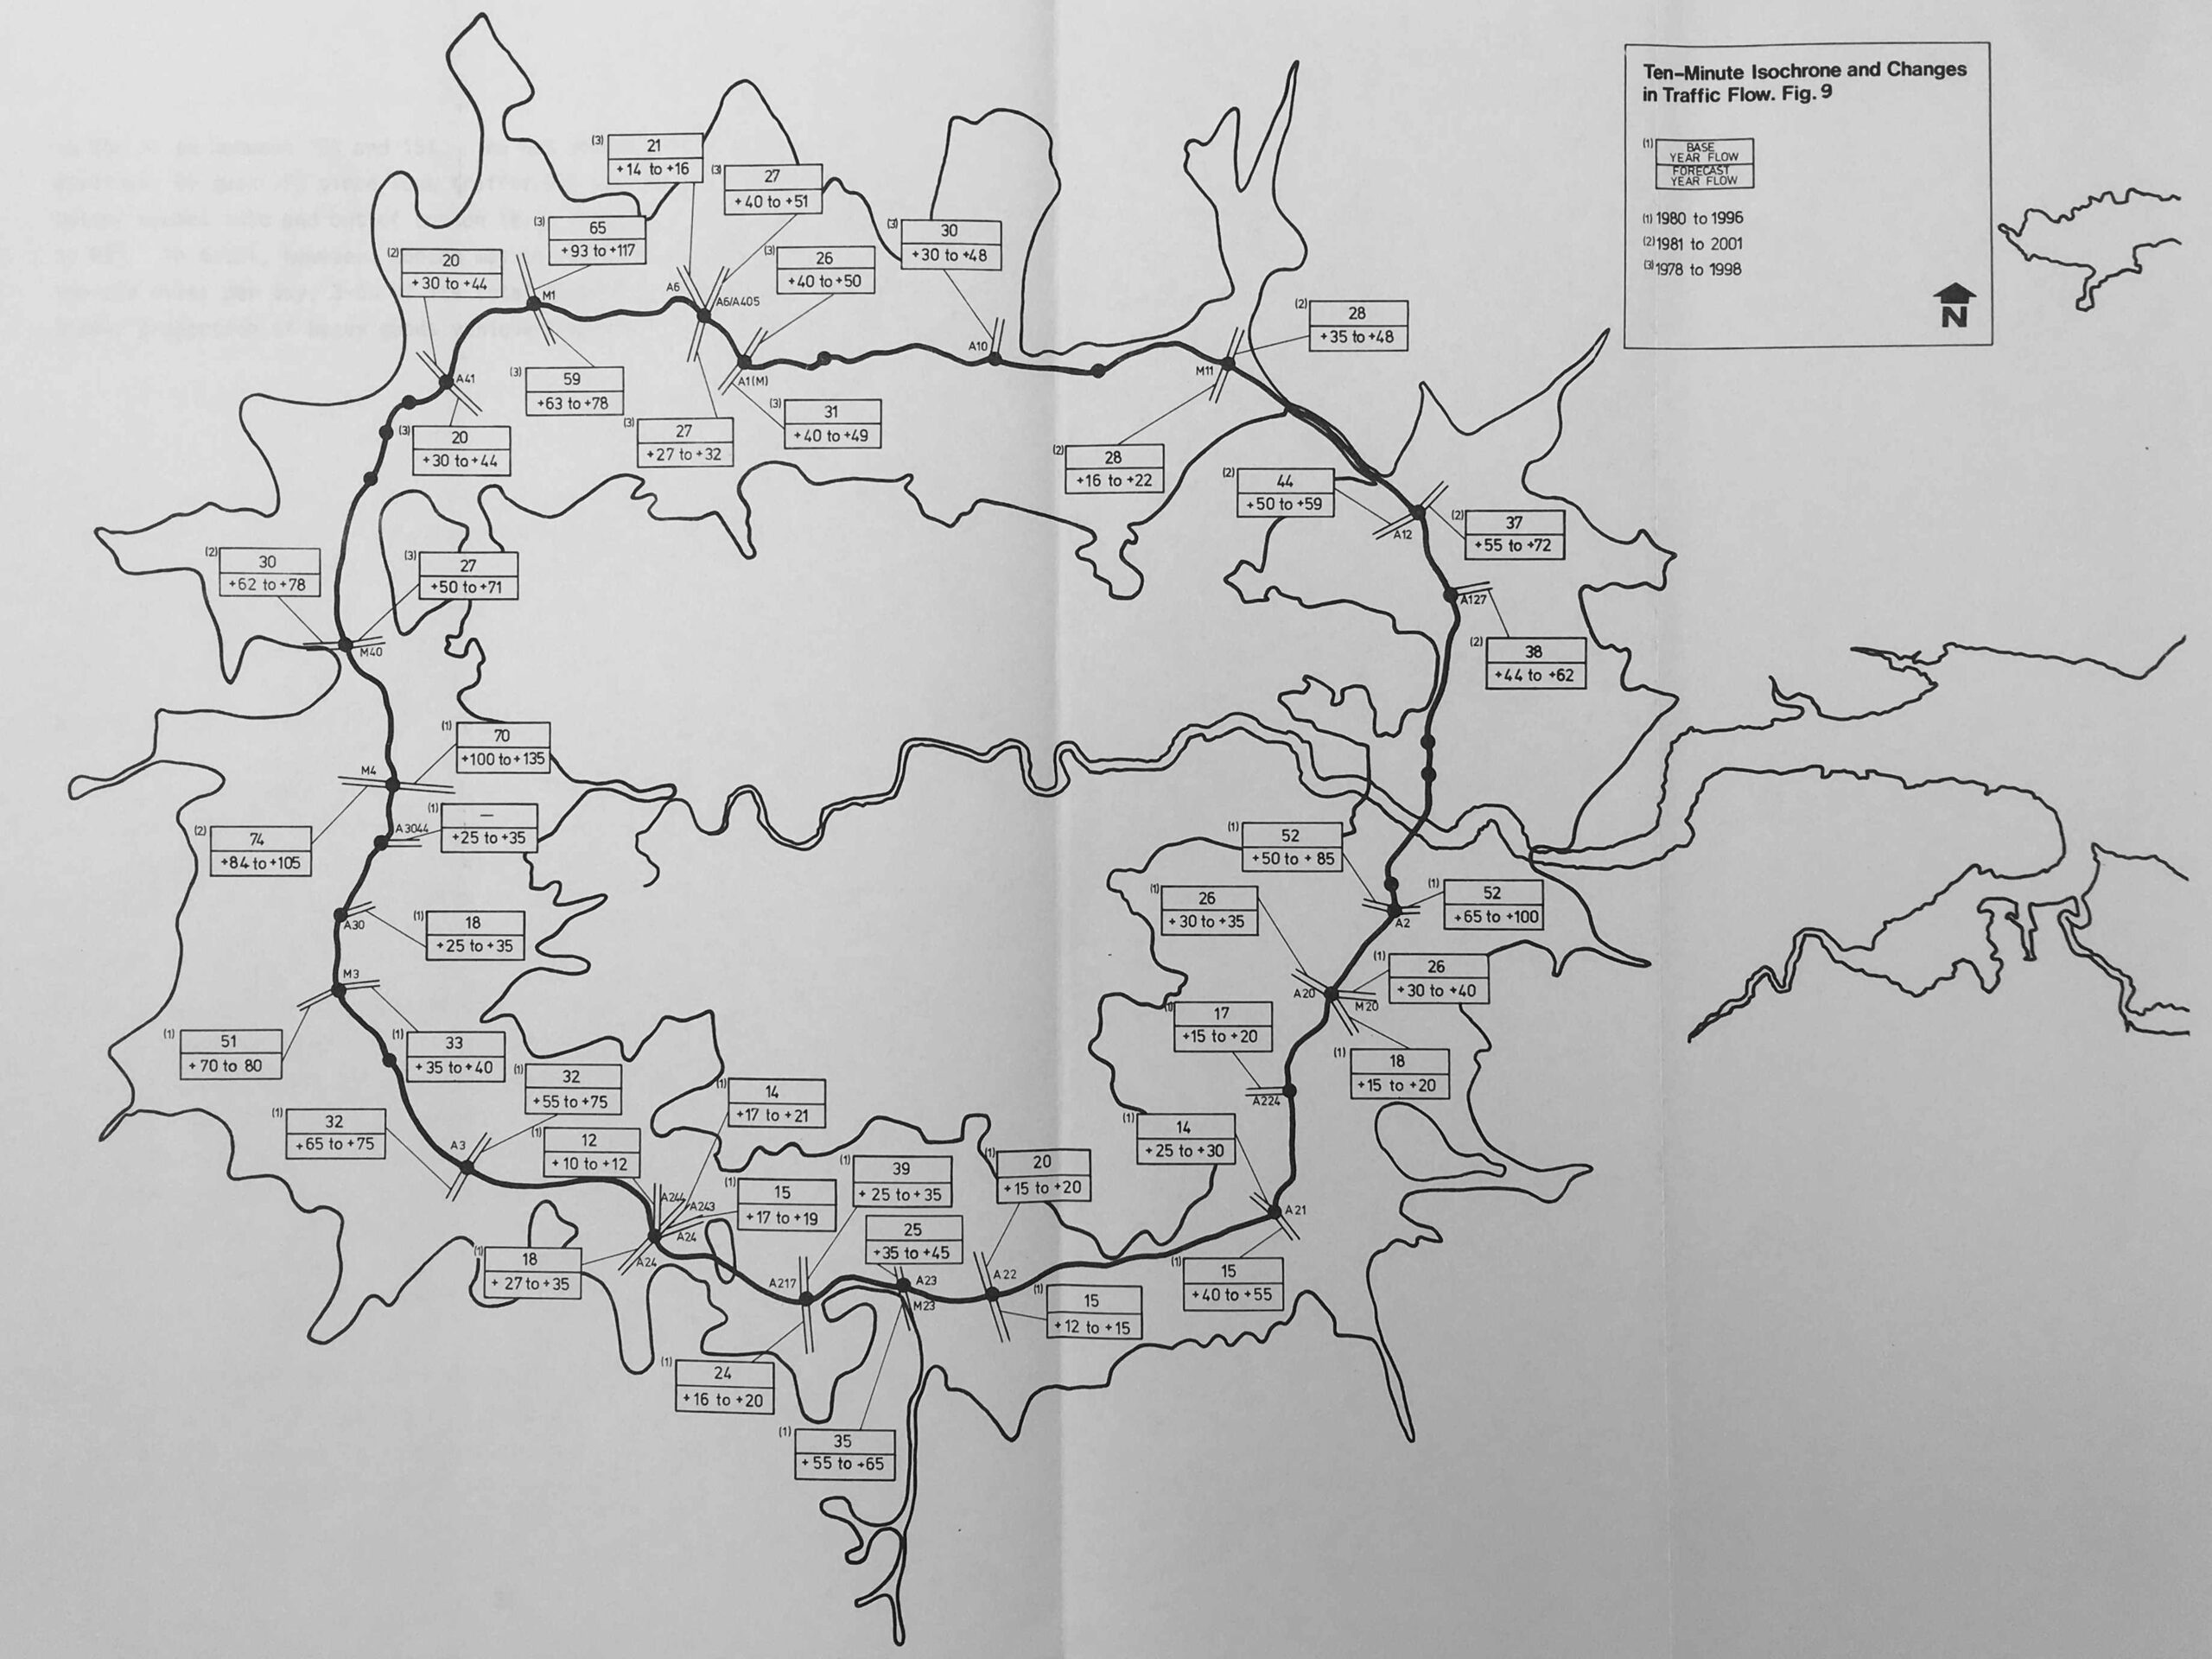
The report mentions that 10 minutes was an arbitrary figure, but was chosen to illustrate just how much of the wider area surrounding London was within a very short time of travel to and from the motorway.
The overall view on Development Pressures and Opportunities was summarised in the following diagram:
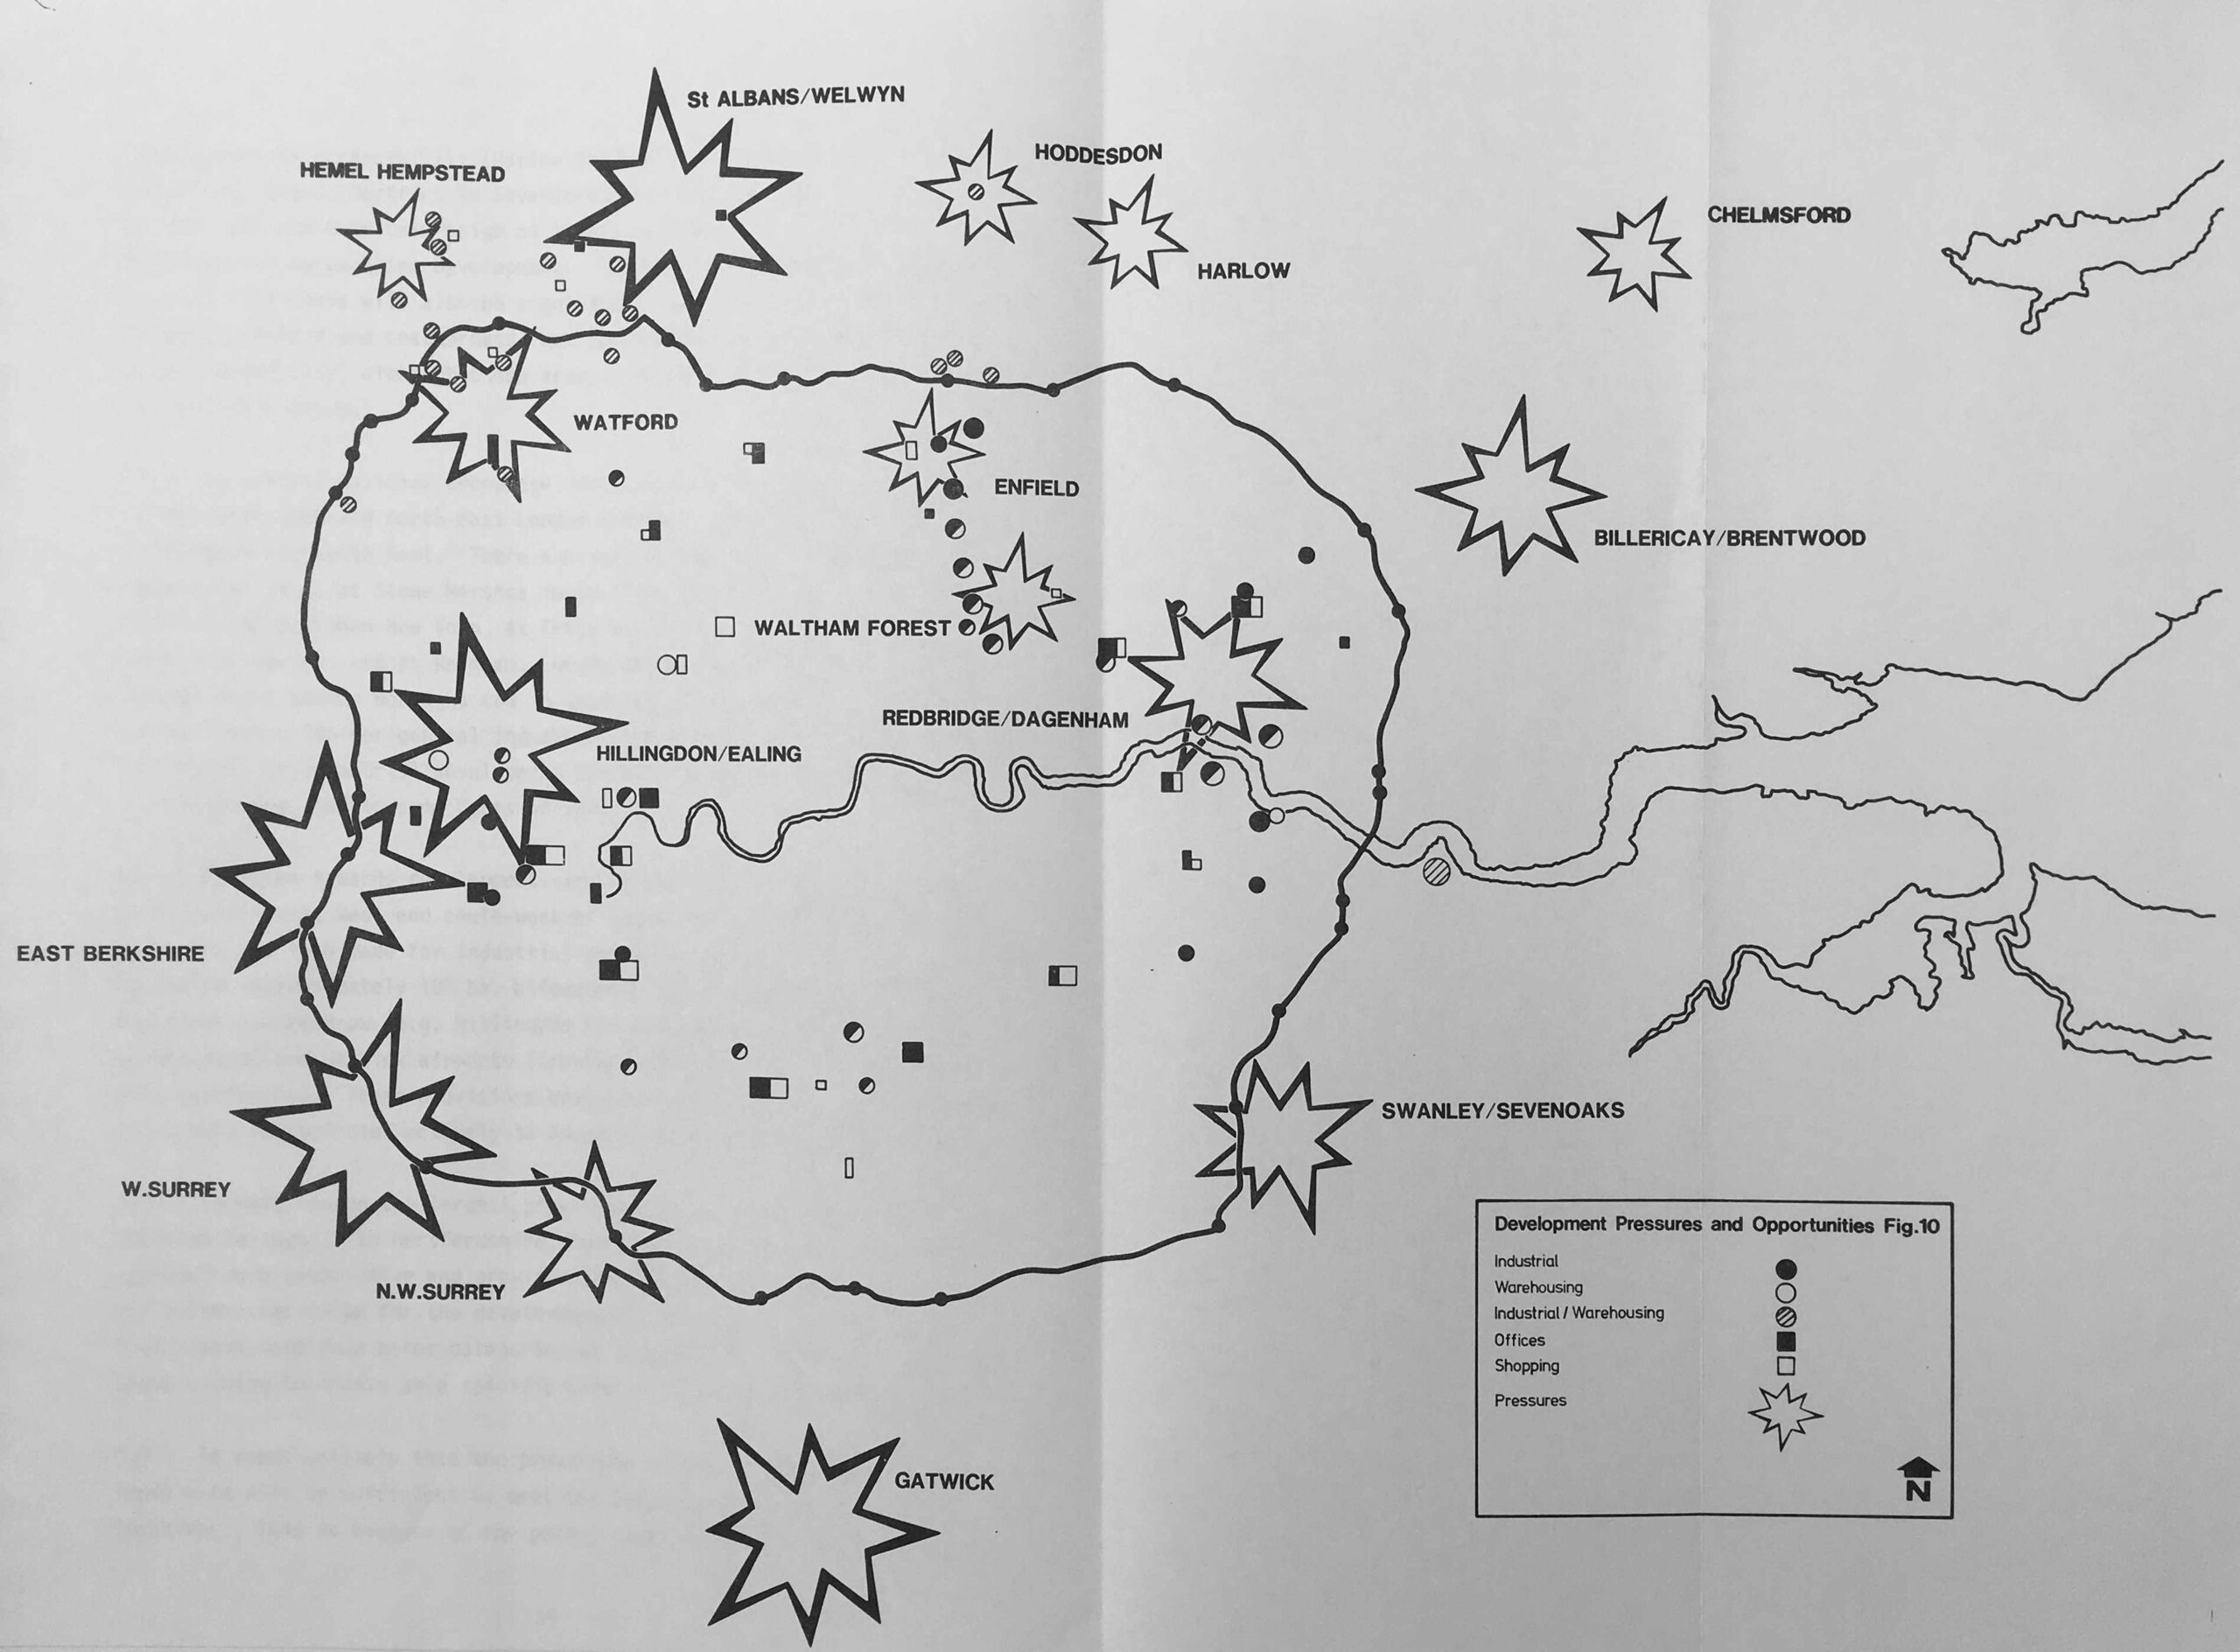
The diagram highlighted that the impact of the M25 would result in development pressures to places such as Chelmsford in Essex, as well as places much closer to the M25.
These pressures were despite limited development opportunities in many areas, with the Greater London Development Plan identifying that there were “no preferred industrial locations” in outer north-west London.
There was one area where development was encouraged, and it was expected that the M25 would help with opening up the area and attracting developers. This was the area to the east of the City, starting in the Docklands and spanning both sides of the river out to Basildon on the north and Medway on the south side of the river, as shown in the following diagram:
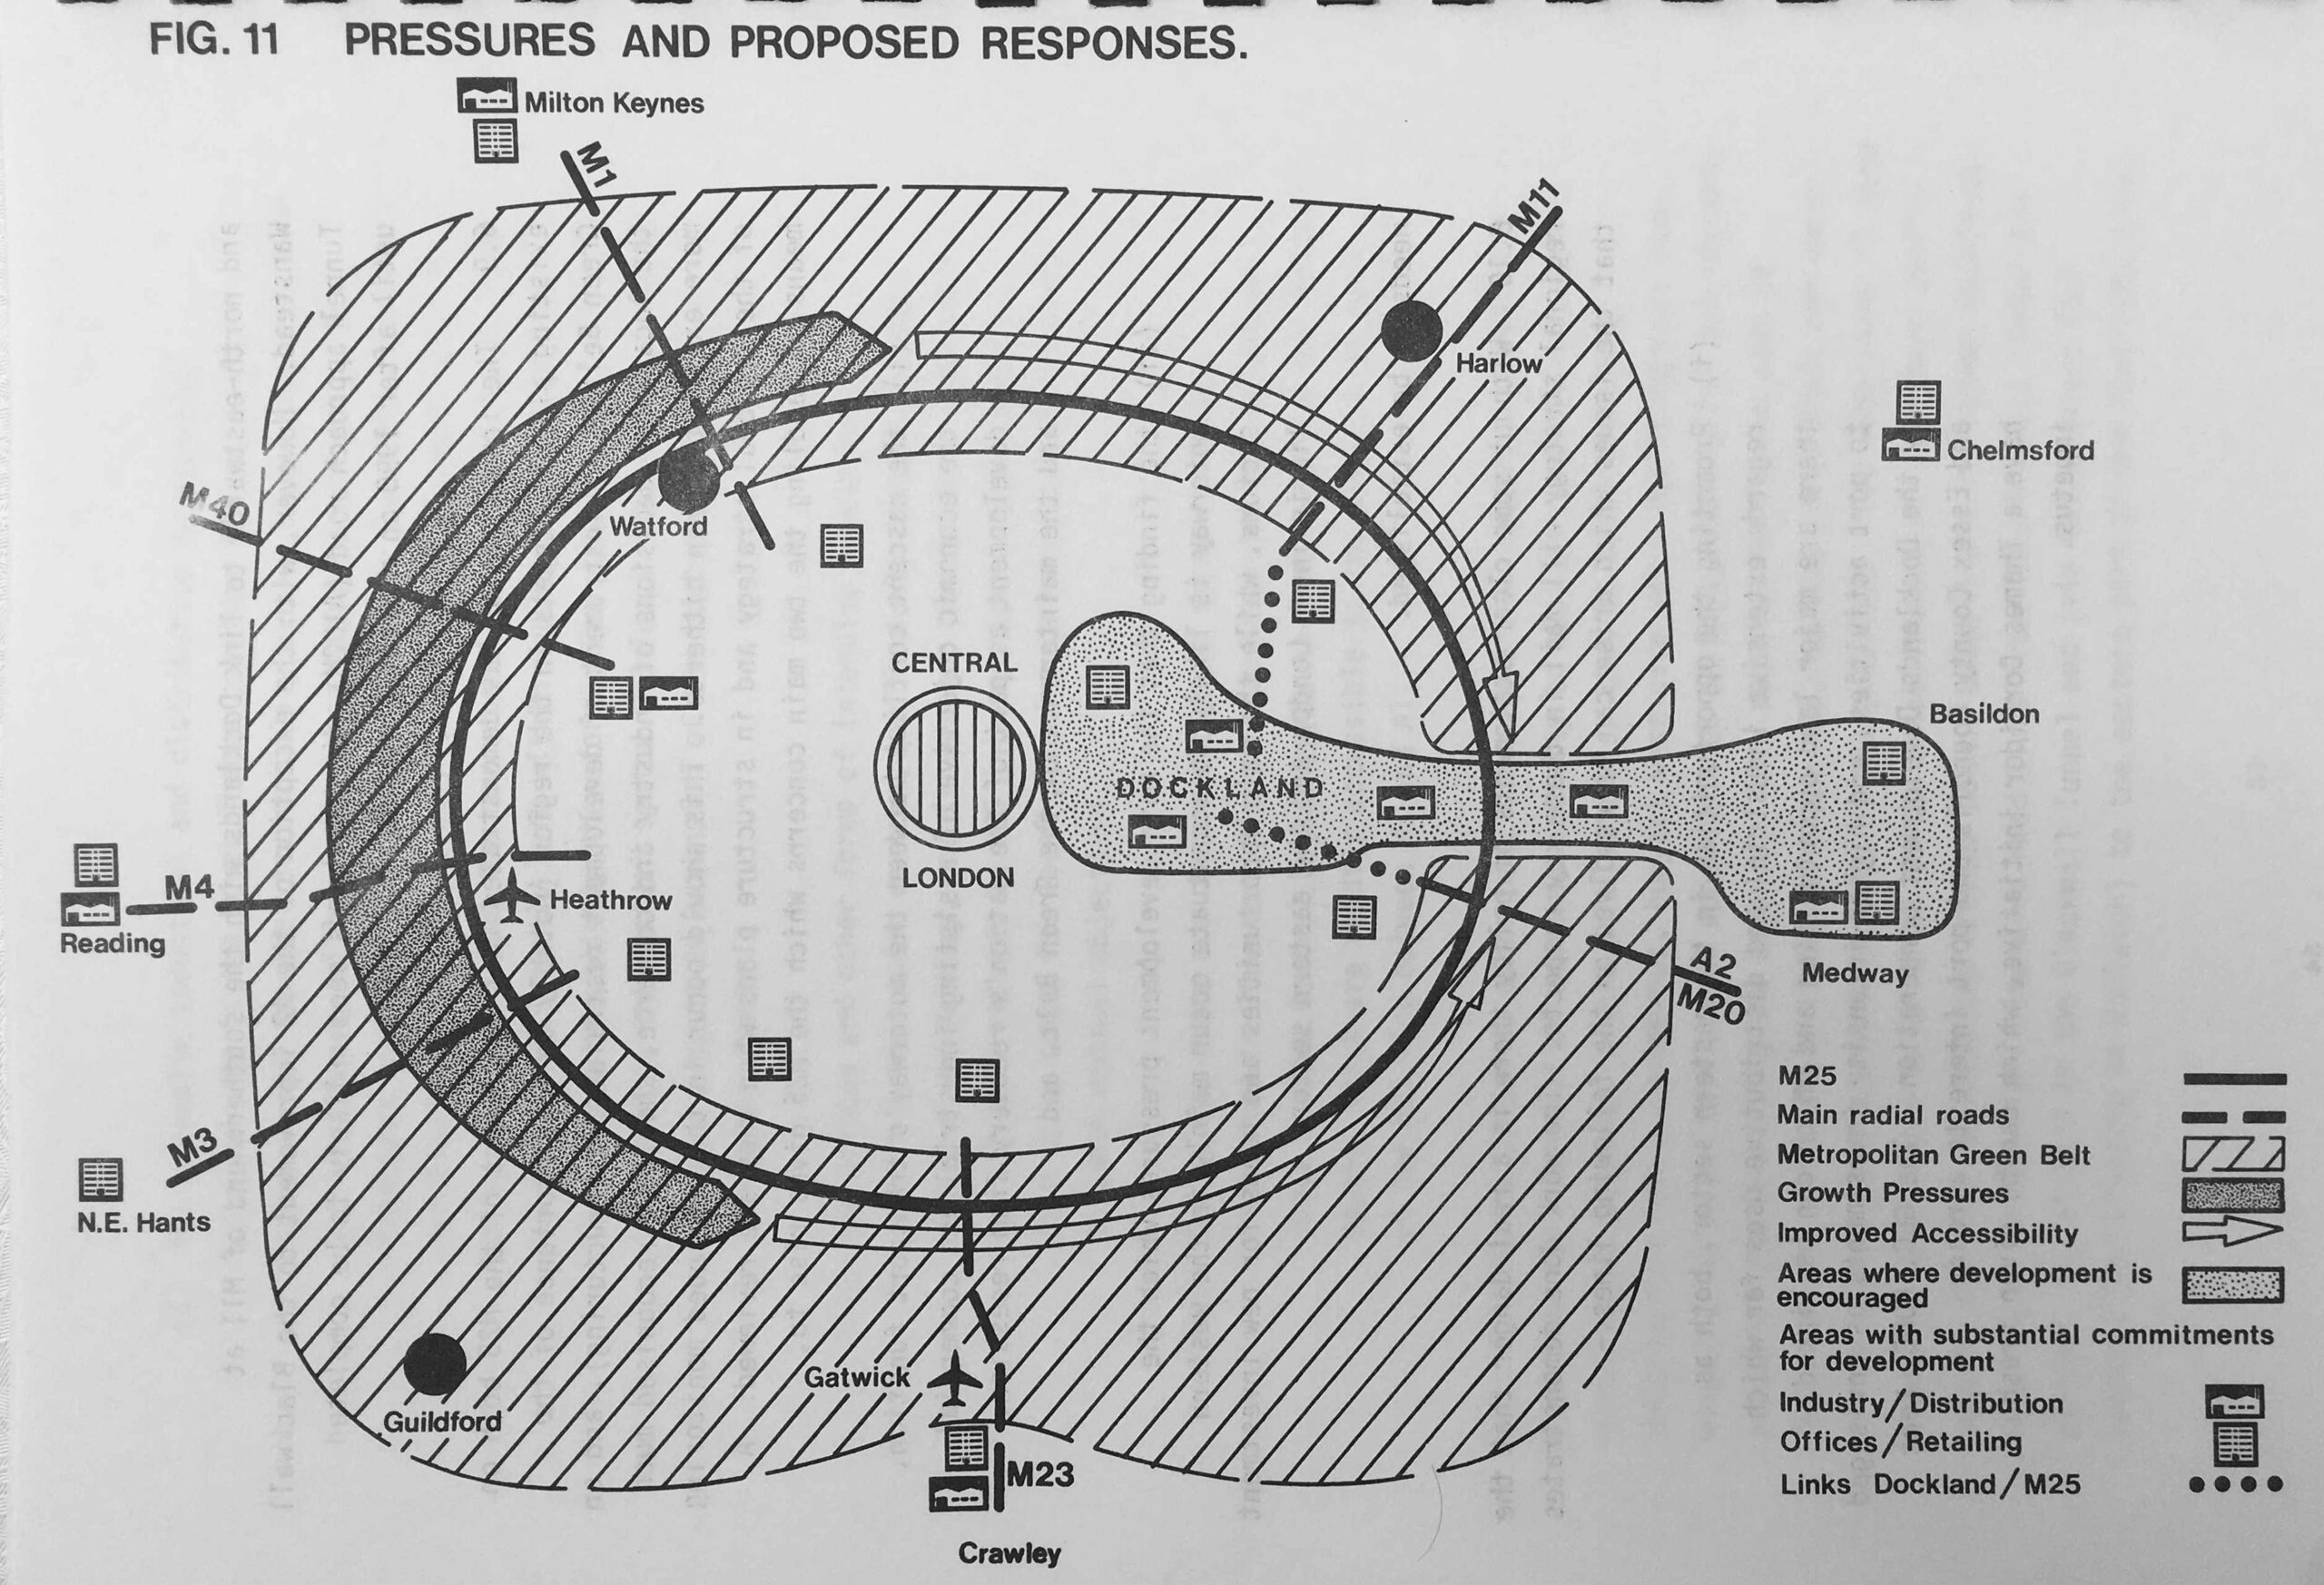
It was hoped that this area to the east of the City would ease the development pressures in the area from Watford in the north, down to near Gatwick, with the arrows on either side of the motorway in the diagram both pointing away from the area in the west, to the Docklands / Basildon / Medway area in the east.
Following completion of the M25, use of the motorway has expanded rapidly.
The Department for Transport has a number of automatic traffic counters located around the M25, and on many other major routes.
I took one of the counters which is located just east of the Holmsdale Tunnel on the M25, just by Waltham Cross as an example, and on an average day in the year 2000, there were 108,038 vehicles of all types travelling on both sides of the M25.
In 2022, this had grown to 142,242, over a 31% increase in traffic, and the 2022 average was still slightly below the pre-pandemic 2019 average of 146,475.
The 2022 number consisted of 298 two wheeled motor vehicles, 54 buses and coaches, 86,334 cars and taxis, 35,561 light goods vehicles and 19,995 heavy goods vehicles.
Whether this rate of increase continues remains to be seen. If it does, the M25 will resemble a car park with long queues more frequently than it does now.
The M25 is the busiest motorway in the country, and carries a large percentage of the country’s road traffic. The Department for Transport also provide traffic volumes for the five busiest road sections in the UK motorway network. Four of these are on the M25:
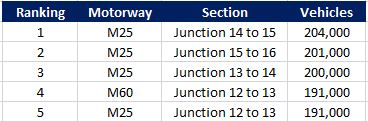
The table shows that the section between the M3 and the M40, which includes the sections running west of Heathrow, is the busiest part of the M25, and has four out of the five most heavily used sections of motorway in the country.
The fourth most congested section in the country is a section of the M60, to the south west of Manchester.
The 1982 report identified many of the development pressures that the M25 would bring to the areas surrounding the new motorway. Almost 40 years after completion, the M25 is a key part of south east England’s transport infrastructure, and the volume of traffic using the motorway continues to increase.
The M25 did reduce traffic volumes on London’s roads, and roads of the surrounding towns and villages, as traffic now had a more direct route to travel around, into or out of the city, however I suspect that with the general increase in traffic volumes, any initial reduction has probably been replaced by an increase.
Whether this continues to increase, whether the transition to electric vehicles will result in a change to traffic volumes, whether changing working patterns will have an impact, and how the M25 will continue to impact the surrounding areas remains to be seen.
What is certain is that the M25 is another example of how London impacts a much wider area than the central city.
And for another example of the impact of London, if you travel south on the M25, look to the left a short distance along from Junction 17 (providing you are not driving), and you will see the large construction site for HS2, at the point where the tunnels start as the railway heads north under the Chilterns.
It will be interesting to see how HS2 is viewed in 40 years time – and whether it has finally reached Euston.
I went on a tour of Littlebrook on an OU course in the 90s, hearing the crackle of static under the pylons – now I know where all that concrete came from (and there was a lot). Where it has all gone now is anybody’s guess.
Fun fact: when I worked at IPCMagazines in Kings Reach Tower in the 1980s, across the corridor from
me were the offices of Ideal Home magazine. The editor, Terry Whelan, decided he was going to be the first driver to complete the circumnavigation of the M25. And this is exactly what he did. I’m not sure how many people were also there in their cars on the day the orbital motorway was opened, jostling for this accolade, but Terry came into work the next day looking very pleased with himself as he announced his achievement.
I grew up in rural Essex and Kent in the 1950`s/60`s. Areas totally unrecognisable now due to the motorways !
Reminds me of the phrase coined by Isaiah Berlin – it’s been ‘an appalling success’.
Saving 25 minutes from Brentwood to Heathrow? Well that never happened. I used to be able to get from Hornchurch to Heathrow in just over an hour by using the A13 and then through the City to Westminster, along to Chelsea and then out through Earl’s Court to Hammersmith, Chiswick and pick up the M4. I can’t use that route anymore due to cycle lanes, traffic restrictions imposed by various Mayors, etc. Last time I tried it took over two hours just to get to Chelsea! The M25 north route is ok at 2am but during the day it’s a nightmare. The best route now is the north circular to Hanger Lane, pick up the A40 to the Target then the A312, Providing there’s no accidents I can do it in an hour and a half. So much for progress.
I remember Brentwood very well before the M25 came along and destroyed a lot of green belt land. Like a lot of places around London it was ruined by this motorway but I can’t imagine how people would be able to move around now without it. There were some staggeringly stupid planning decisions implemented to build the M25, not least junction 5 where it joins the M26 and they probably decided that it was a good idea to save a few quid by only building two lanes at the junction. Madness.
Another great post by the way.
I returned to London from a spell overseas in 1986 just after the M25 was completed. I was then living at Barnet in Hertfordshire. It seemed like a breath of fresh air but it has got busier and busier over the years, despite the addition of extra lanes. I now live in Hampshire but still use it fairly regularly. I hate the concrete sections and Junction 10 with the A3 (currently being upgraded) is a nightmare! But we have learned to live with it; can’t manage without it; and will have to cope with the inevitable upgrades, which will keep on coming! It’s totally unpredictable but perhaps that’s half the fun? Another fascinating article – TY.
Another great article. I often wonder at the sense of planners and the short termism of so many infrastructure projects in the UK. Despite all the obvious outcomes such as encouraging more traffic, and further road schemes to alleviate the problems arising from them, we continue to make the same mistakes.
I often have to visit family in north Cambridgeshire, using the Dartford crossing then M25 and on to the M11. Every time I ask the question, why did they leave the M11 at two lanes north of Stanstead airport turn off?!!
Interesting that you mention shopping centres. Of course, the stretch of the M60 that you refer to is within sight of the Trafford Centre.
The construction of the M25 had a direct effect on my aunt and uncle who were the licensees of the Middlesex Arms at Bignells Corner, South Mimms. This pub was built as a road house on the A1 in 1931 and closed in 1970. It was demolished in 1973 to make way for the A1(M) and the junction that then linked it to the M25. The remains of the pub lie under the South Mimms Services.
I believe that my aunt and uncle were the last licensees of this pub before it closed in 1970. In 1969 my aunt, Hilda Griffiths, took a booking for a party of about twenty for a Saturday evening meal. When they arrived Hilda very quickly realised that these were special guests and passed around two blank menus for them to sign – Matt Busby, George Best, Bobby Charlton, Denis Law, Pat Crerand, Nobby Stiles and a number of others duly signed!
Hilda and her husband, Gordon, were at the end of their working life and probably knew the end was coming for the pub. They retired to Dorset.
Another excellent article, if you would like to have a look at how the M25 was in 1986 just have a look at the excellent ‘Withnail & I’ the section of the film when they travel to Penrith was filmed on a large section of the unopened (at that stage) M25. The production crew apparently blagged their way on to film the short part of the film, signage is clear in the film.
Again an excellent article.
It reminds of the occasion when, sitting in my office in Greek Street, W1 some years ago, our secretary came in to the room with a question:
“Which way is the M25 from here…?”
great article…..many many thanks
There is a very well known phenomenon in network theory, Braess’s paradox, that adding capacity can reduce flow.
There are plenty of real world examples where opening new roads makes congestion worse – and indeed the converse, when road closures have actually made the traffic flow better.