During 1941, even as London was still under attack and the V1 and V2 weapons were still some years in the future, plans were being devised for reconstruction in the City of London.
On Thursday 24th of July 1941 a “Common Council holden in the Mansion House in the City of London:
Resolved and Ordered, that the Improvements and Town Planning Committee be authorized to print and circulate their report when ready, in regard to the redevelopment of the City, and they be instructed to take steps to see that their Report is circulated as a private and confidential document”.
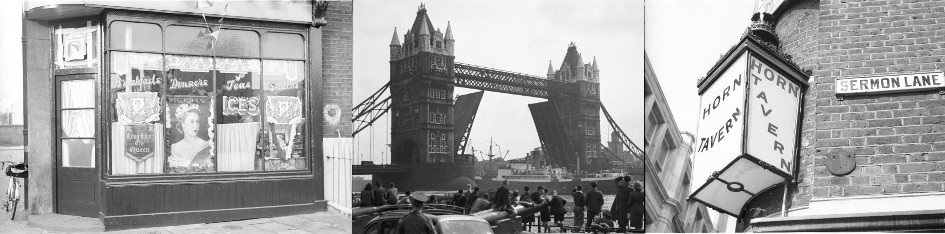
The report was published almost 3 years later on the 24th of May 1944 and makes fascinating reading. The report provides an insight into the pre-war City and documents proposals for how the City should be redeveloped after the war. Many of these proposals we can see implemented across the City today.
The report also contains a wonderful set of artists impressions of the proposed developments along with a large set of fold out colored maps showing different perspectives of the City.
There are many maps in this post. To see the map in full detail, click on the map and a larger version should open up.
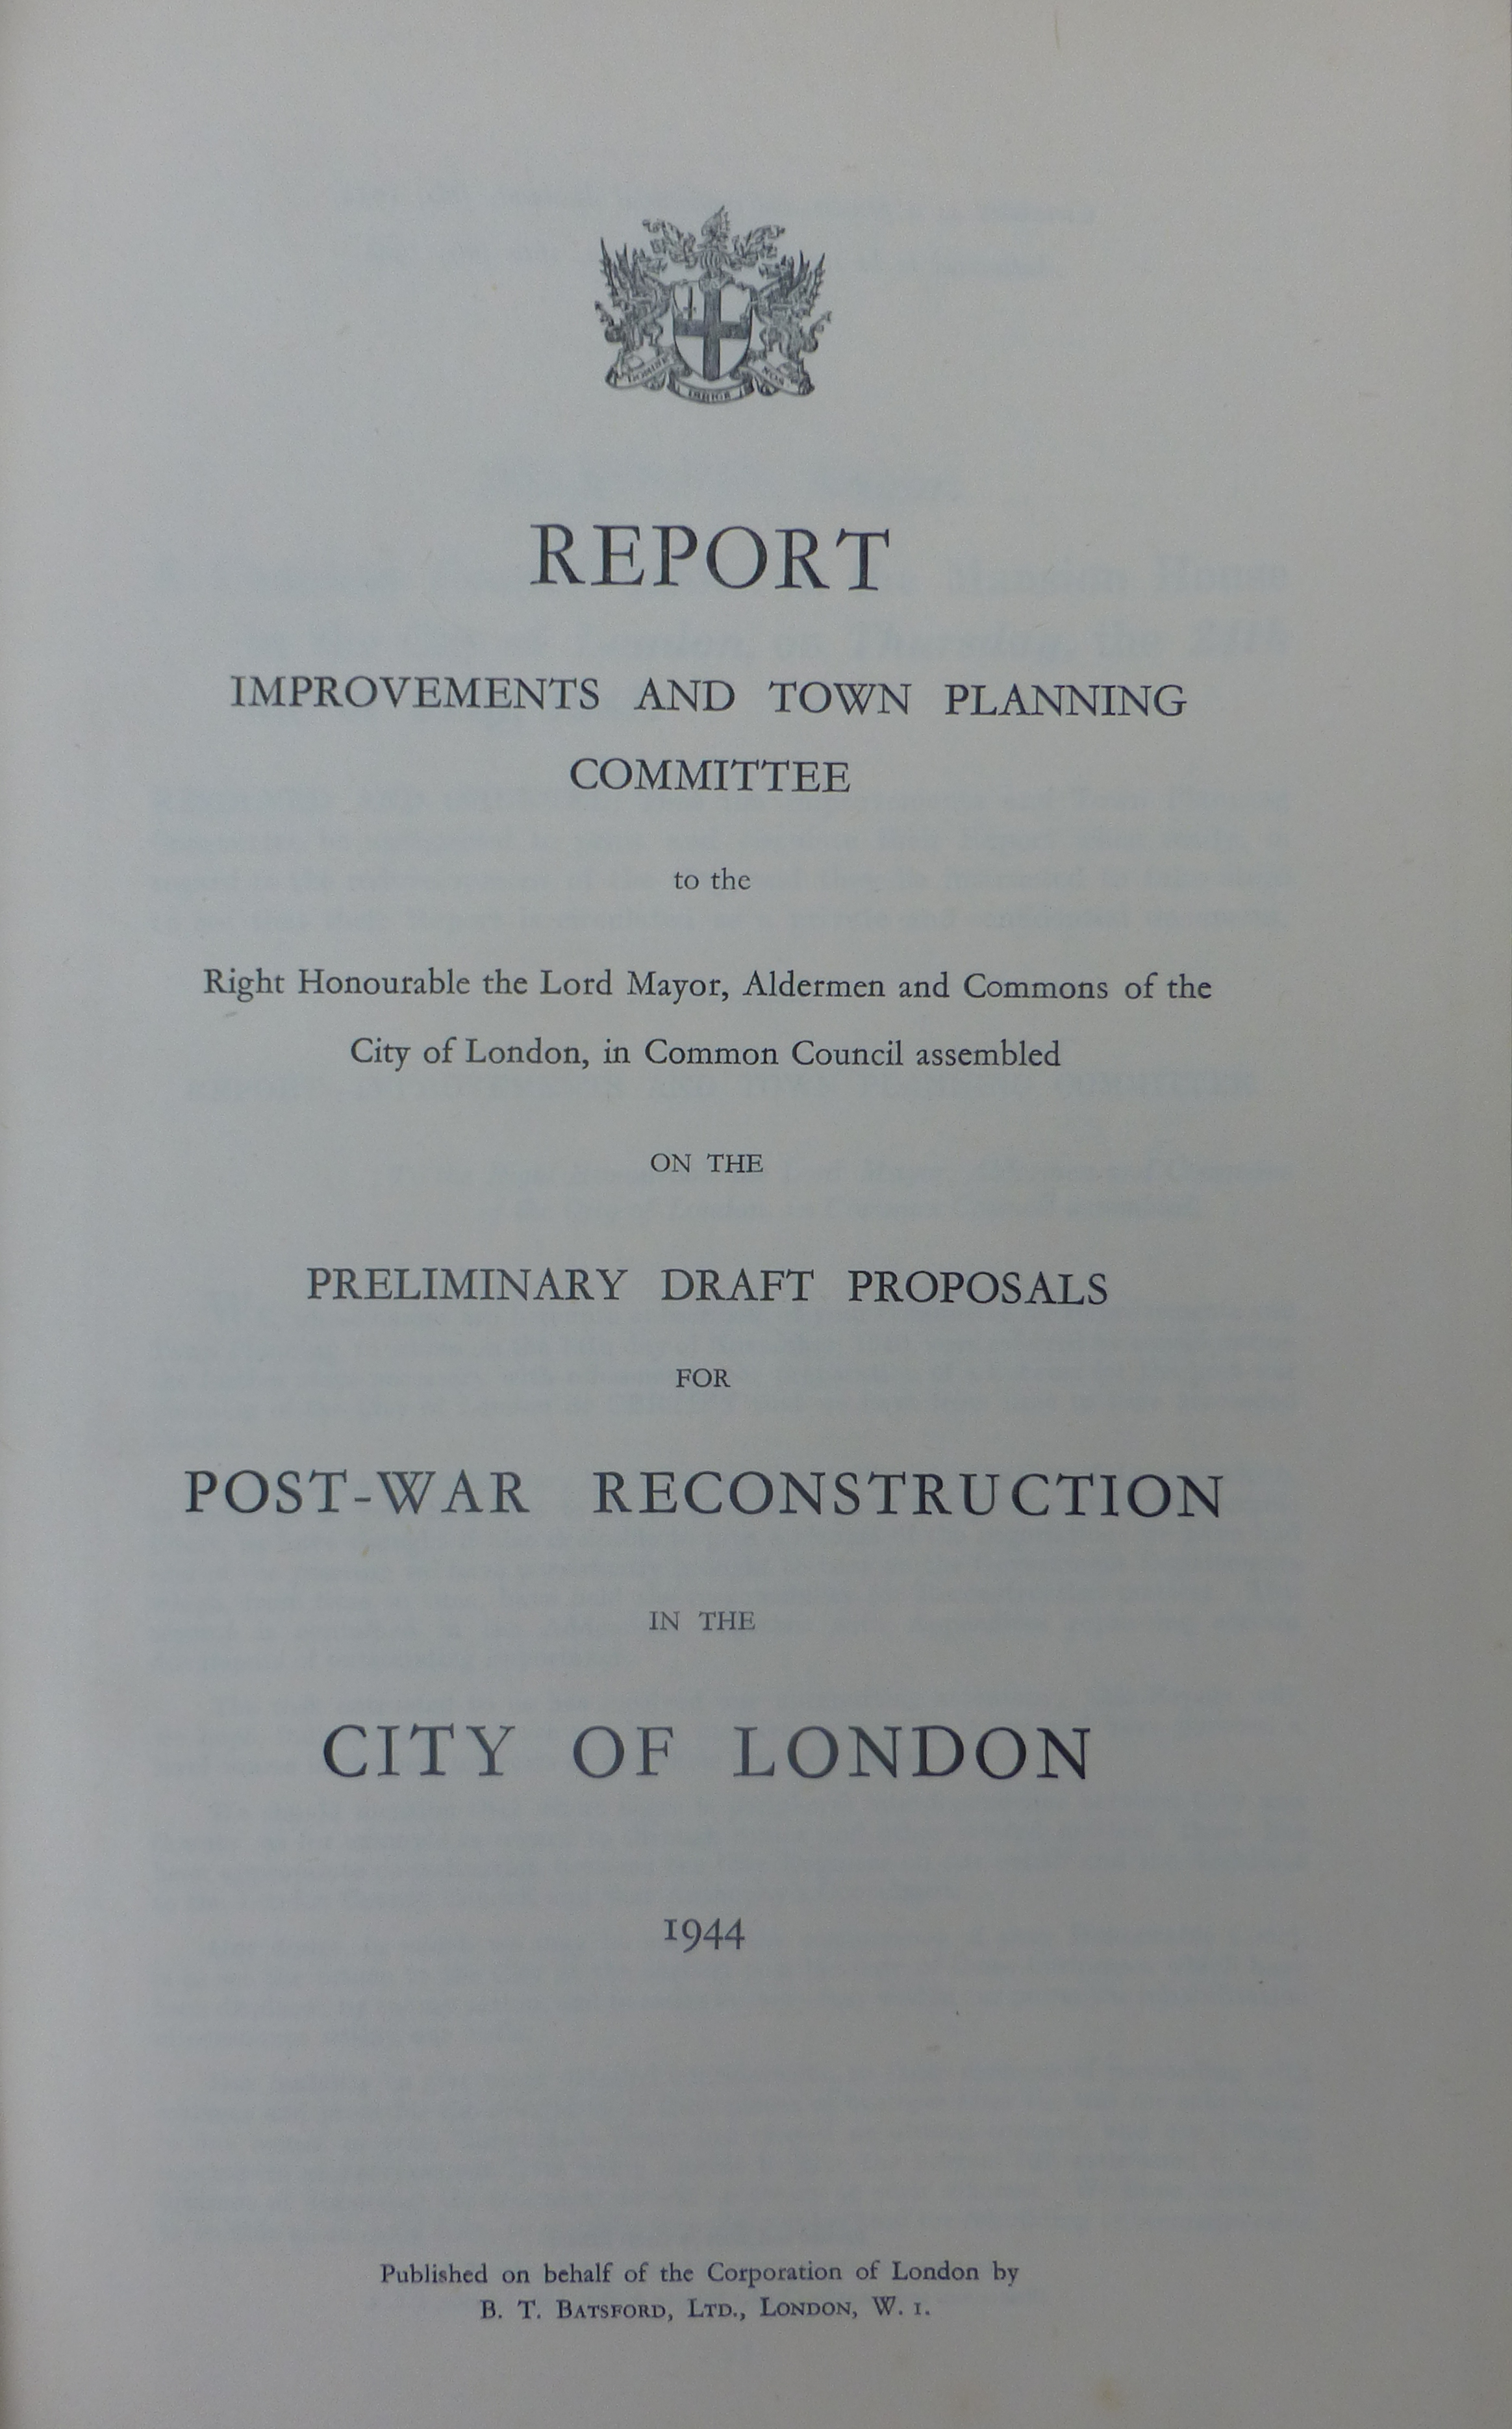
The front page of the 1944 report:
The introduction to the report records the first time that a major rebuild of the City was required, following the Great Fire of 1666 and aims to put aside the story of the rejection of Wren’s plans for rebuilding the City in a very different way:
“To the general public, the rebuilding of the City after the catastrophe of 1666 has long been represented as a “lost opportunity”. Modern research has helped to bring into clear focus both the background of the circumstances existing at the time and the realities which finally determined the course that was taken. The country was at war, and an outbreak of plaque had only recently subsided. The fire dislocated the City’s life and with it the largest single part of the trade of the nation. It was no less in the National than in the Citizen’s interests to rebuild as rapidly as possible. The Corporation – mainly through the devotion and energy of its Aldermen and members of the Court of Common Council aided by surveyors, for there were few paid officers – exerted itself to the utmost and, in the face of truly gigantic difficulties, set about rehabilitation in order that the normal course of life and business could be resumed in the shortest time. New accommodation was therefore of the utmost urgency consistent with creating a safer and healthier city and with an equitable settlement of claims (by the specially constituted Fire Court) between landlords, tenants and other interests. The Corporation had to buy land from owners for such amount of improvements as the money available allowed; both government and local coffers were low, long term finance was in its infancy and new sources of immediate revenue had to be devised mainly from taxation from which the coal dues originated. Legislation had to be obtained for powers to make or widen streets and to regulate more rigidly the construction of buildings. Materials and labour had to be secured. The Corporation set to work on an area where the streets had grown up ‘for the most part as and how they would’, and were, except perhaps in the case of the larger streets leading directly into and out of the City through the great gates in the Wall, merely footways leading to and from the houses of the citizens, winding and tortuous passages worn by the inhabitants of the houses themselves in passing backwards and forwards about their daily occupations and pursuits. Many of the streets have, in later times, been widened and straightened by the removal or setting back of the houses that encroached in the main line of the street. Much of this widening and straightening process was effected by the Fire of London of 1666, which swept away the old land marks and compelled the rebuilding of the greater part of the City, and although no comprehensive scheme was carried out at the time, and the streets were rebuilt for the most part on their old sites, yet they were rebuilt as streets with some definite line of frontage and not as the footways to and from individual houses.”
It is interesting to compare the rebuilding of London after the Great Fire with that after the last war. There were many of the same challenges:
- money was in short supply
- materials and labour needed to be secured and there were many competing demands for a country that needed to manufacturer and export to bring in money
- there was an urgent need to provide accommodation for the citizens of London and to get day to day business running as quickly as possible
Much of London was rebuilt after the Great Fire using the same street layout as before the fire. There were a number of developments in the following centuries with the 19th century seeing many of the larger, city wide developments being completed.
The first map in the report highlights the street improvements made in the City of London during the 19th century.
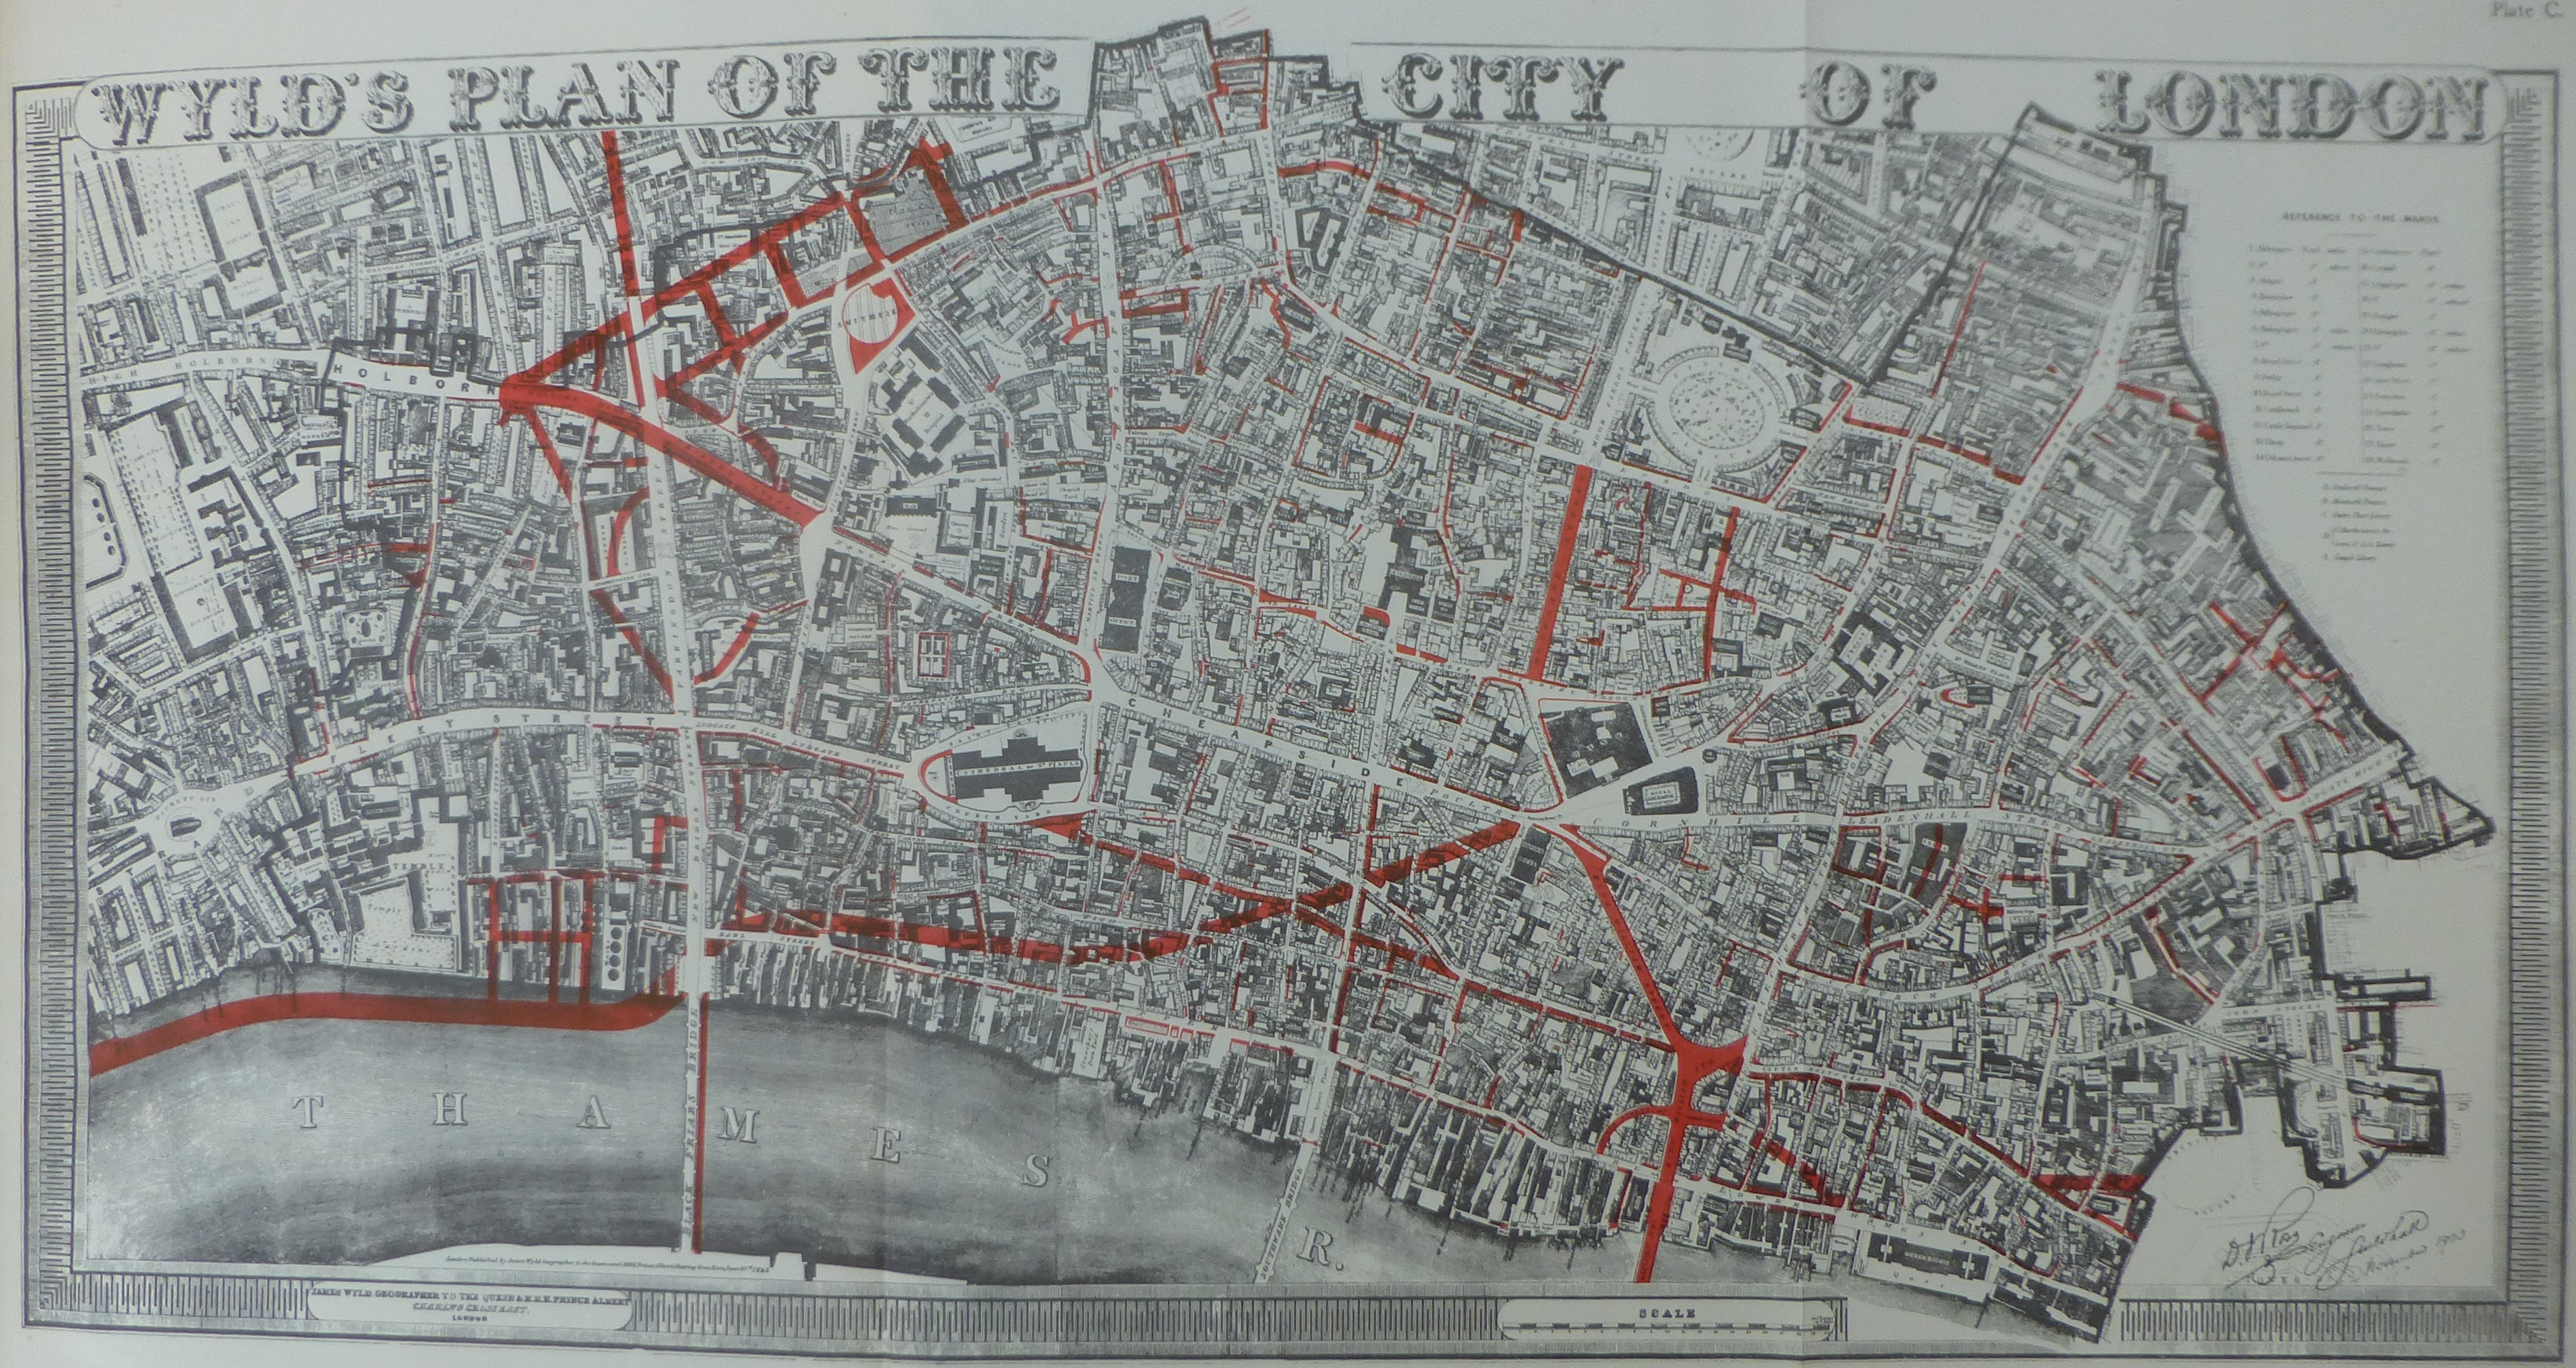
The report states that “This plan was submitted with the evidence of the Corporation of London before the Royal Commission on London Traffic, 1905 when it was stated that the street improvements carried out between 1851 and 1902 and financed out of Rates involved an expenditure of over £5,600,000 gross and £3,800,000 net, of which almost £3,000,000 was paid out of the City’s Consolidated Rate, the remainder being met mainly by contributions from the Metropolitan Board of Works (later the London County Council). Other similar works in the City during the same period involved an outlay of over £3,000,000 including Holborn Viaduct, Blackfriars and Tower Bridges.
The parts coloured in red on the plan indicate new streets and widenings of existing streets made during the 19th century including those completed during the first half of that period at a cost of over £2,500,000. The baseplate is from Wyld’s Plan, 1842, by the date of which the new London Bridge, King William Street, Moorgate and some other improvements were already executed.”
The map clearly shows how Queen Victoria Street cut through so many streets and buildings leading from the Bank down to the new Embankment which runs along the river’s edge at lower left.
The first of the artist impressions from the report shows the preliminary proposals for the reconstruction of the City of London and is titled “Bird’s-Eye General View From The South”.

The text states that “This view indicates the general effect of the main proposals described in the Report . Outstanding features are the Embankment continuing from Blackfriars to London Bridge and thence as a wide inland street to Tower Hill so that the Upper Pool continues as a part of the Port; the ring route from the Tower round the north of the City to Holborn, with major junctions where intersected by the principal existing radial roads into the County; the environment of St. Paul’s Cathedral; and the open space exposing the London Wall bastions of the Church of St. Giles, Cripplegate.”
The detail on the map is fascinating. The City churches are shown with their steeples raised above the surrounding buildings.
The next artist impression shows a view from the north-west with the proposed northern arm of the ring route between Holborn Circus and Aldersgate Street. This did not get built, if it had, the large roundabout shown to the left would occupy the space outside the Barbican Underground Station and the roundabout would have cut Aldersgate Street in two.

The report provides some fascinating information covering the changes in London’s population. The following table covers the period from 1801 to 1935:
| Year | Population (in thousands) | City of London as a % of Greater London | |||
| Greater London | Administrative County of London | City of London | |||
| Residential | Day | ||||
| 1801 | 1,115 | 959 | 129 | ||
| 1851 | 2,681 | 2,363 | 128 | ||
| 1861 | 3,223 | 2,808 | 112 | ||
| 1866 | 3,555 | 3,038 | 93 | 170 | 4.8 |
| 1871 | 3,886 | 3,261 | 75 | 200 | 5.1 |
| 1881 | 4,767 | 3,830 | 51 | 261 | 5.5 |
| 1891 | 5,634 | 4,228 | 38 | 301 | 5.3 |
| 1901 | 6,581 | 4,536 | 27 | 332 | 5.0 |
| 1911 | 7,251 | 4,522 | 20 | 364 | 5.0 |
| 1921 | 7,480 | 4,485 | 14 | 437 | 5.8 |
| 1931 | 8,204 | 4,397 | 11 | 482 | 5.9 |
| 1935 | 8,475 | 4,185 | 10 | 500 | 5.9 |
The table shows that whilst the population of Greater London was increasing, the residential population of the City of London was decreasing with only 10,000 residents by 1935. As today, the population of the City is significantly different during the day due to the vast number of workers who travel in from the rest of Greater London and beyond.
For comparison, the 2011 census reported 7,400 residents in the City of London and according to the latest Business Register and Employment Survey (October 2015), the total employment figure for the City of London is 414,600. Assuming that the day population in the above table is mainly additional people coming into the City to work, numbers have therefore dropped, probably reflecting the move of many financial businesses to Canary Wharf.
Looking to the future and whether the day population of the City could grow beyond 500,000 the report states that this could probably only occur if:
1) The amount of business transacted and the methods of administration practiced required the employment of such numbers of people in close proximity
2) The public transport could convey such numbers speedily and cheaply from their widely distributed homes to the centre.
3) The ratio of persons in the London area employed in the City increased much beyond previous proportions or the total population of London increased considerably against the general sense of the findings of the Barlow Report
I doubt that many of today’s commuters into London would consider we have a public transport system that conveys them speedily and cheaply into central London.
The Barlow Report of 1940 was charged with looking into issues such as the geographical distribution of industrial workers and reported that it was not in the National Interest that a quarter or even a larger proportion of the population of Great Britain should be concentrated within twenty to thirty miles or so of Central London. A similar issue today with the widely held concern about concentration of population and economic activity within the wider London area.
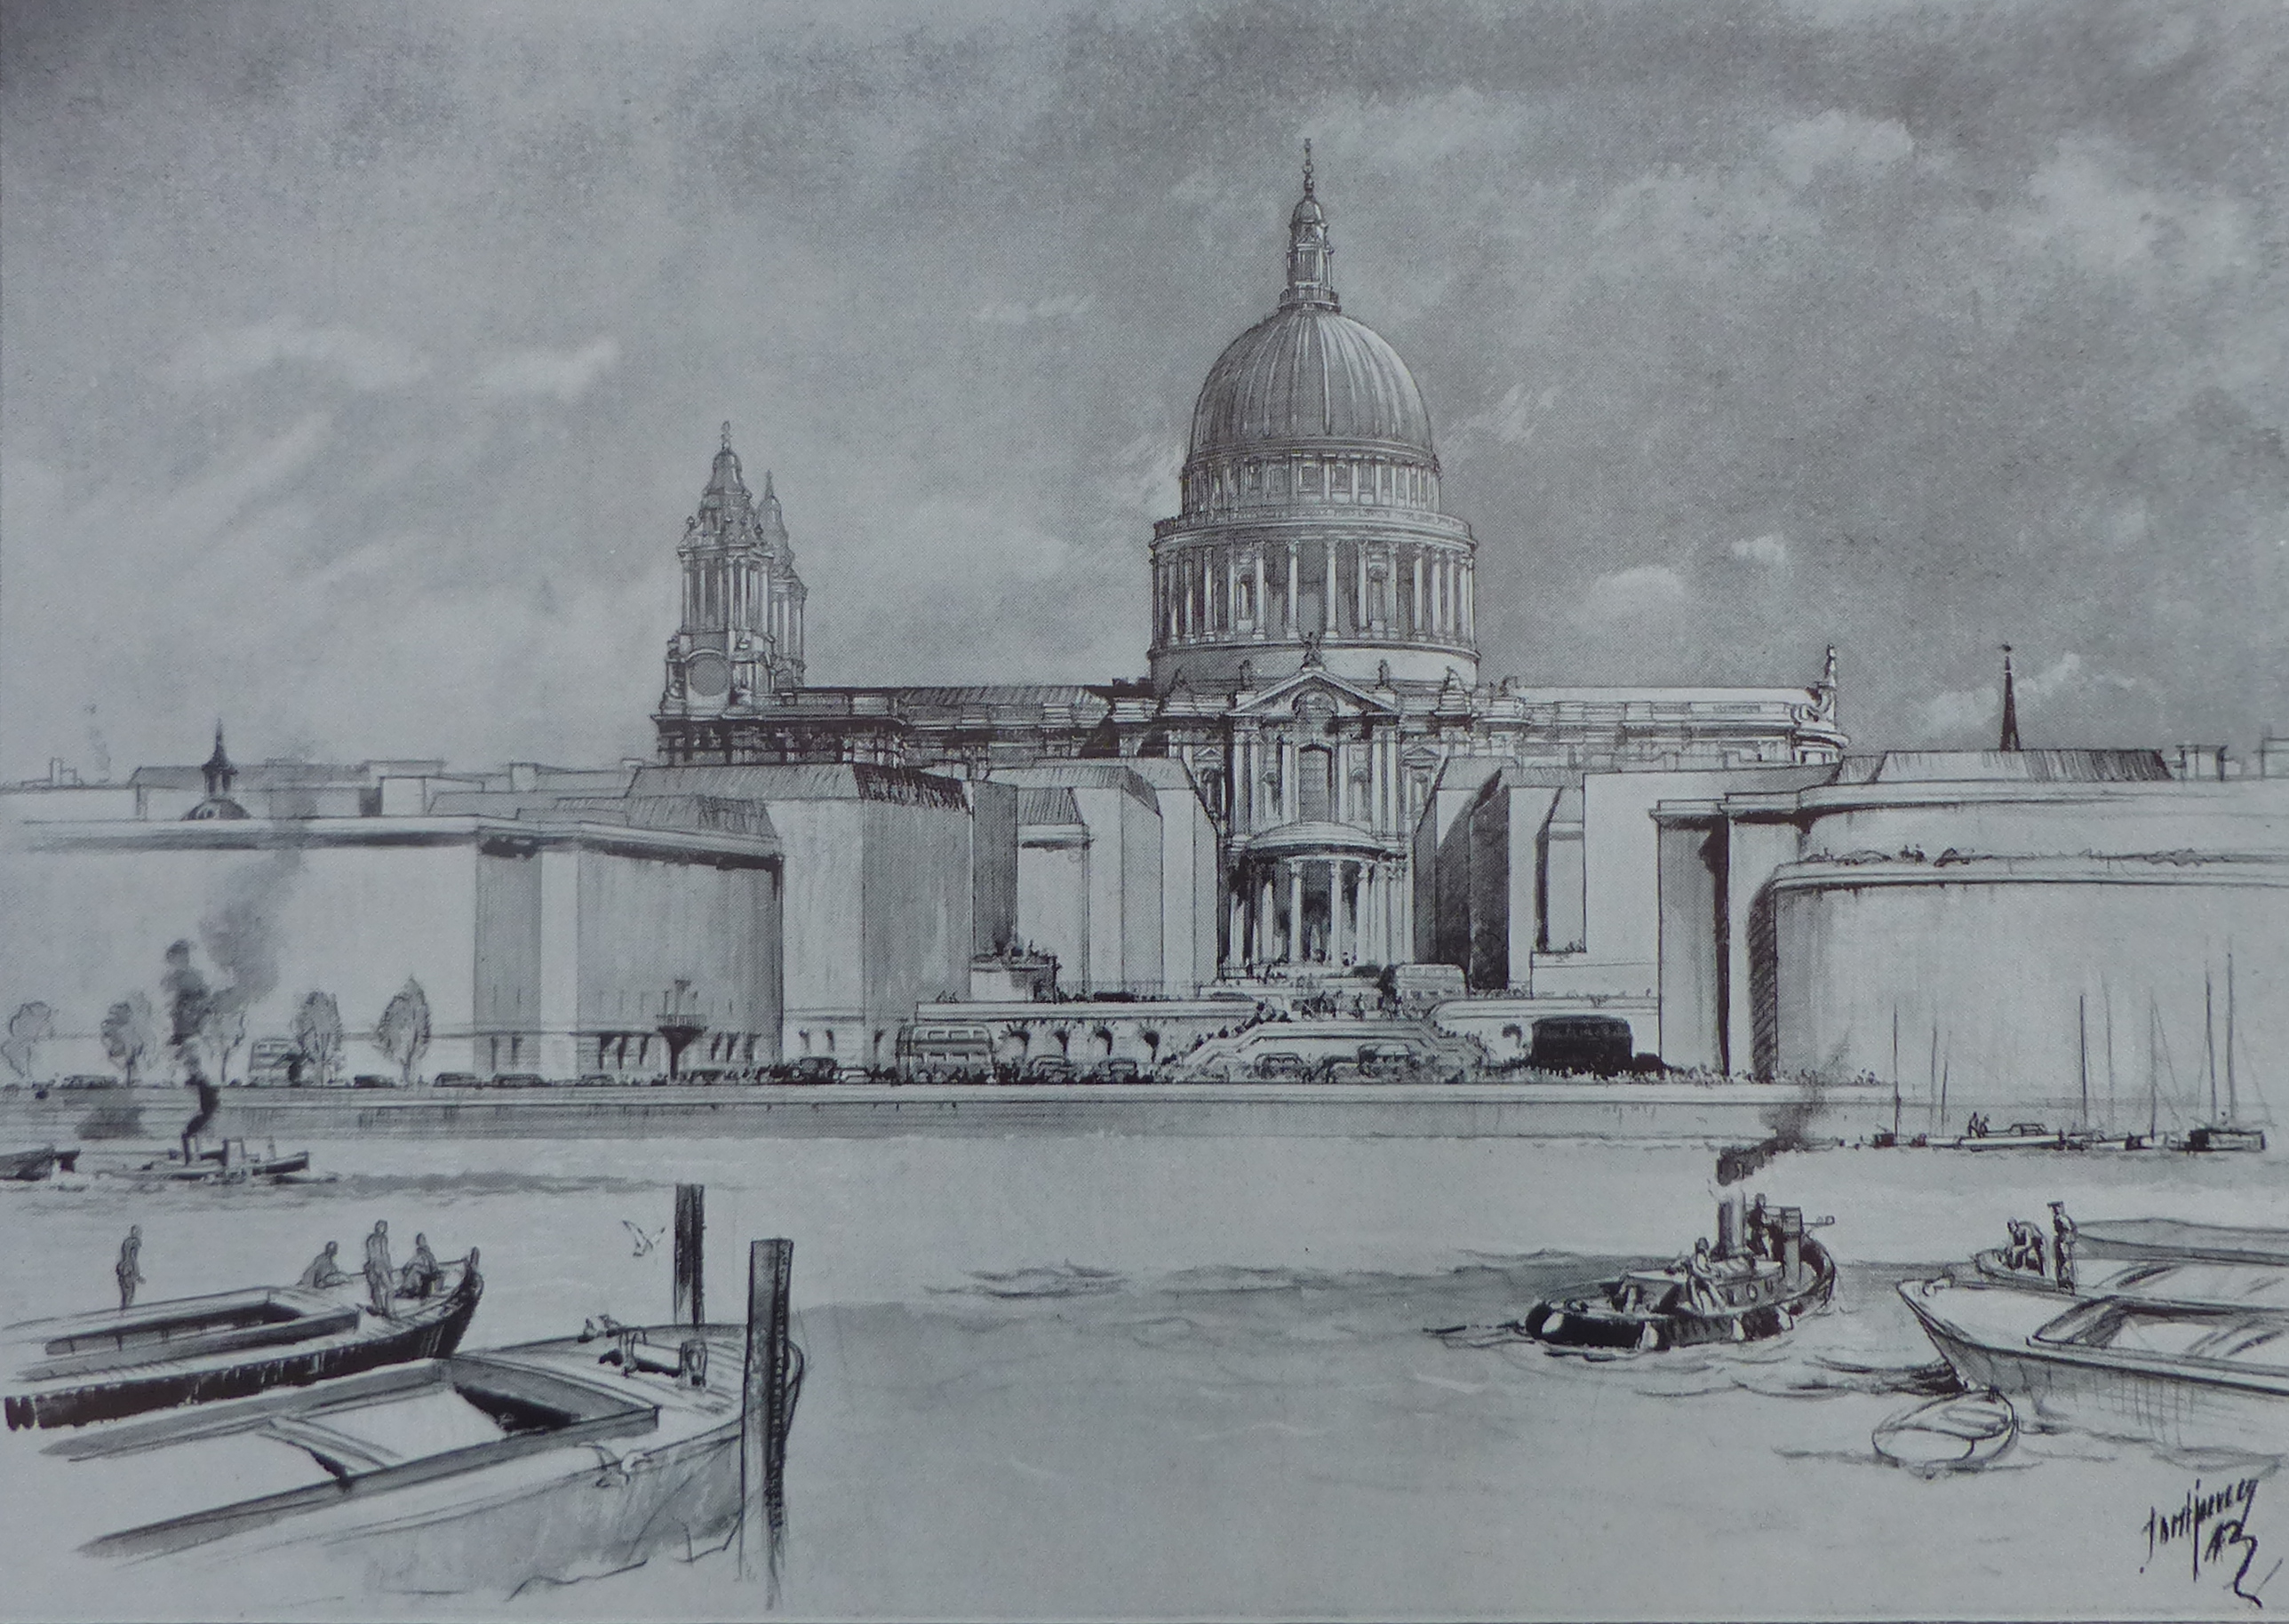
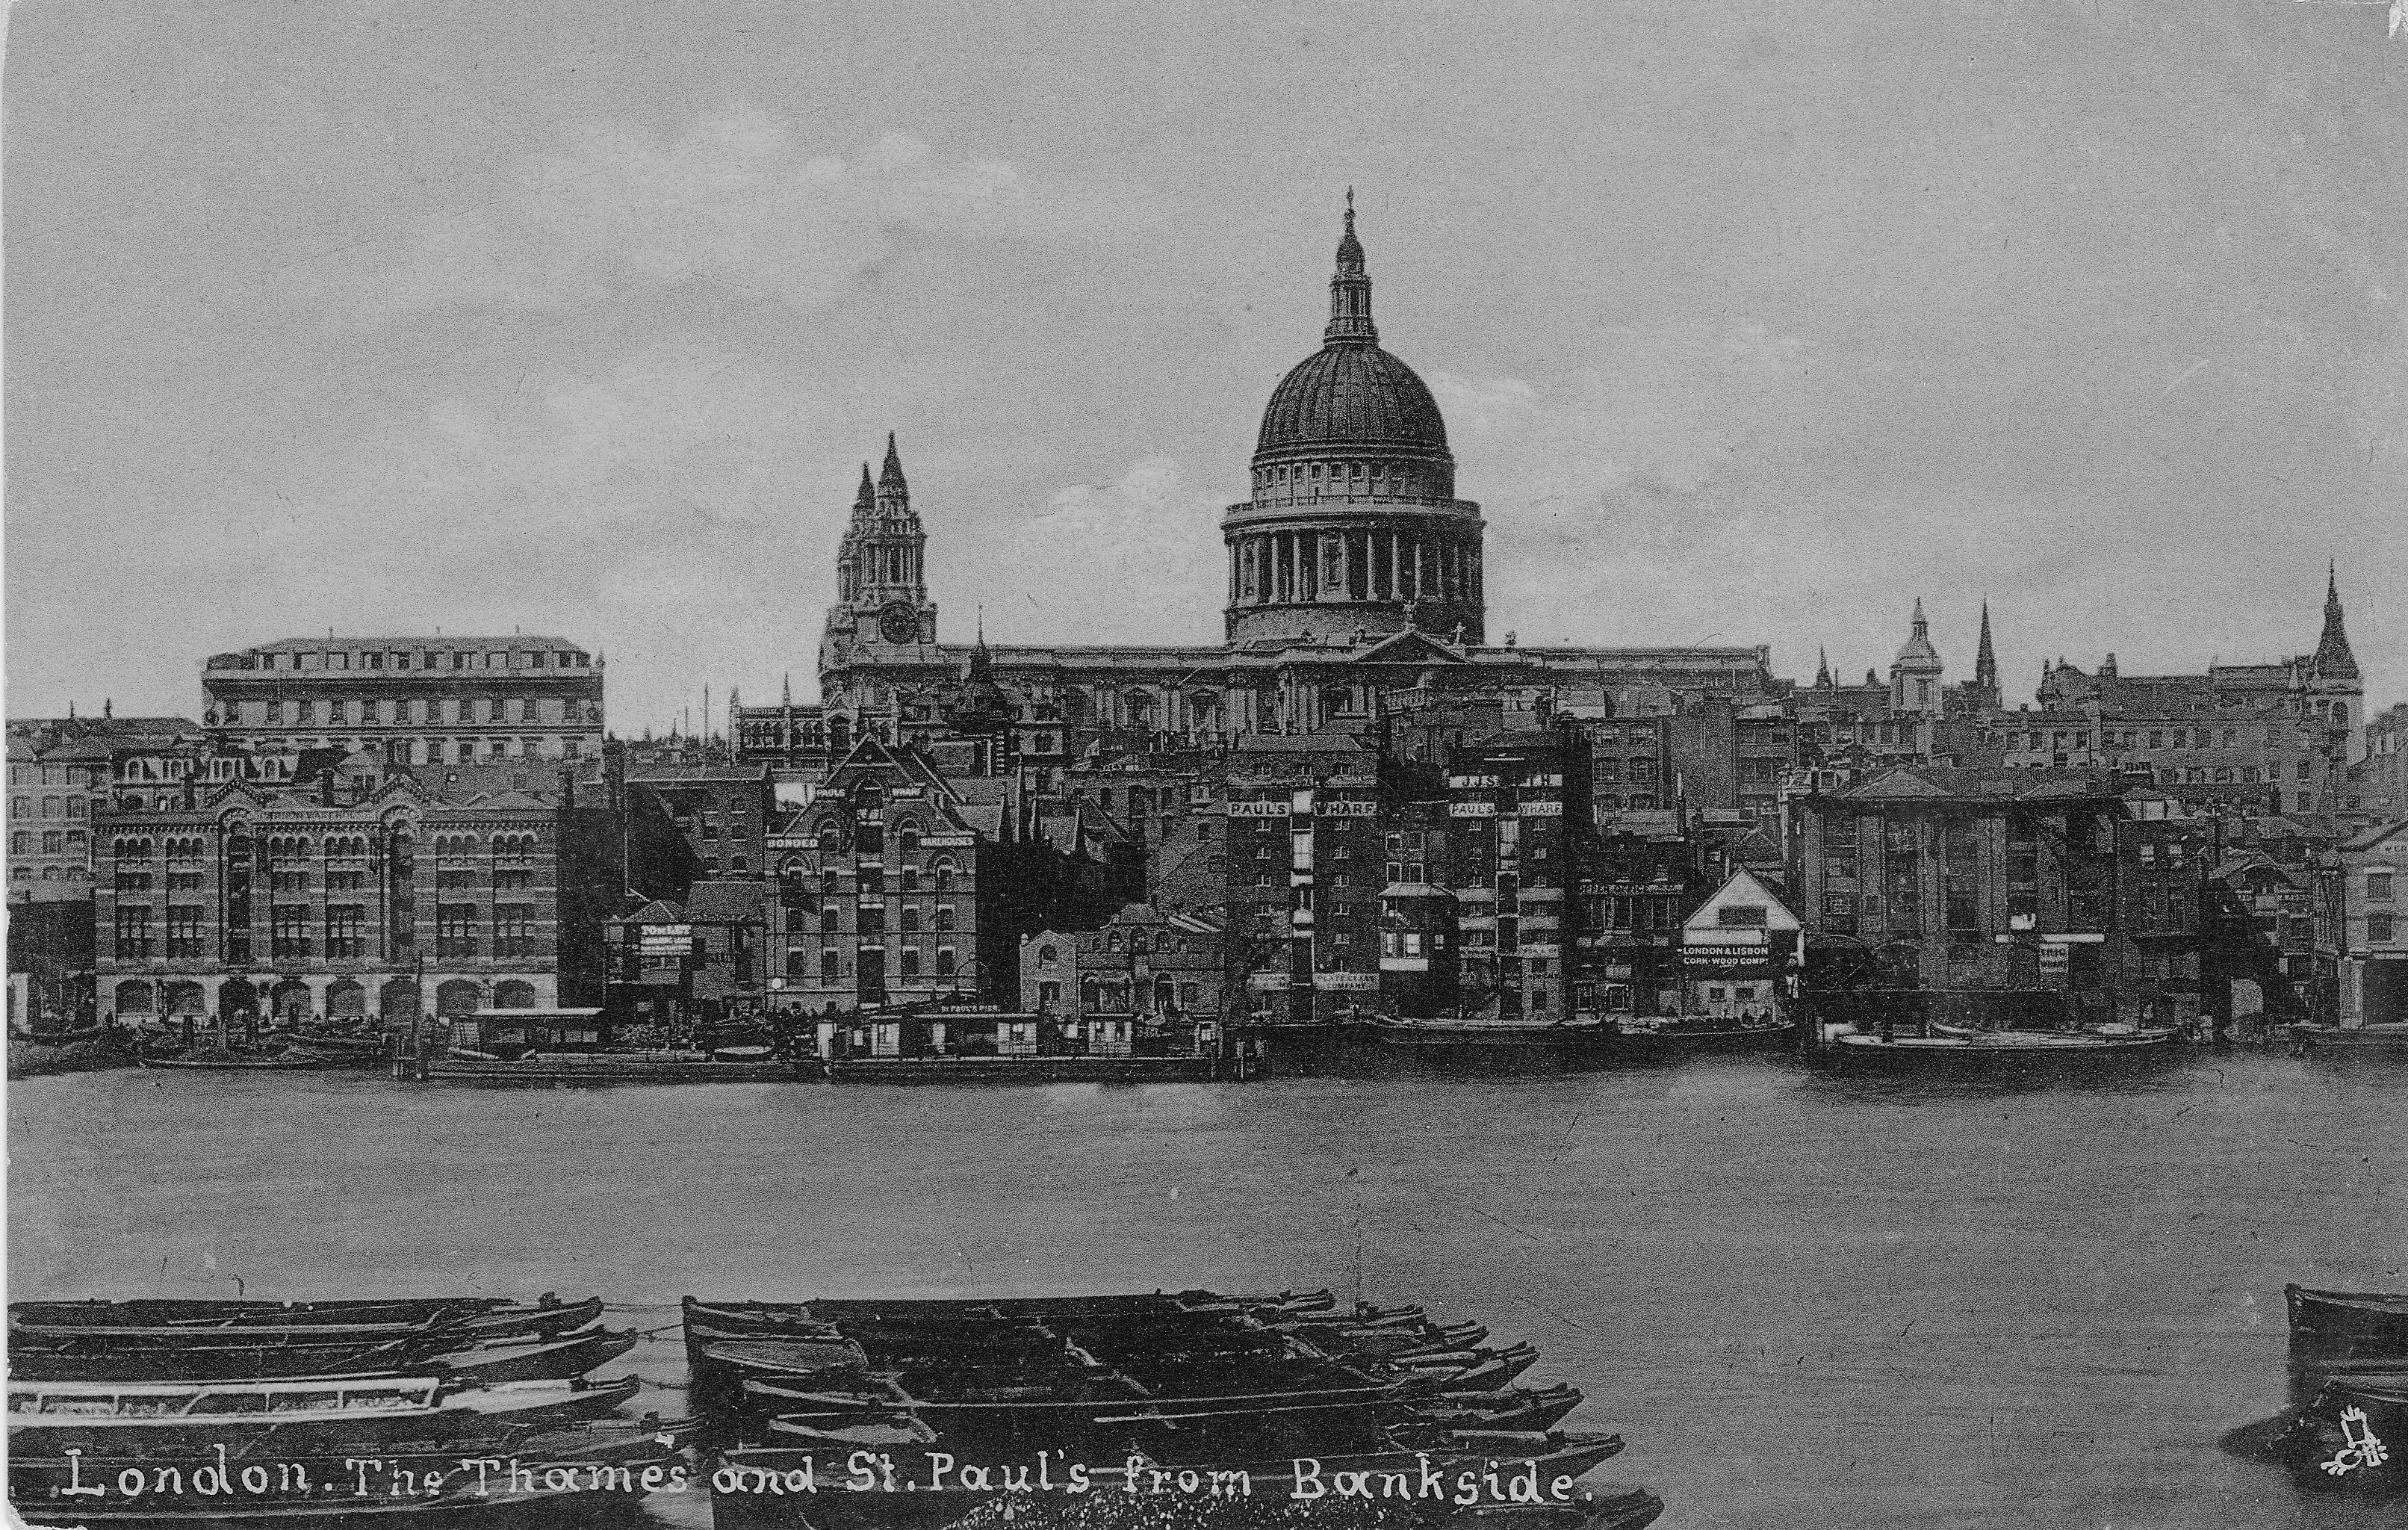
The reports also looked at opening up the areas around St. Paul’s. The following artist impression shows the proposed view from Bankside with the buildings developed to the maximum heights permissible under the proposed Overall Height Control.
The view early in the 20th century from Bankside with much of the lower part of the Cathedral obscured by buildings between the Cathedral and the Thames:
There is an interesting statement in the report which reads “Nearly a quarter of the City has been rebuilt since 1905, the new buildings producing about £4,000,000 or 42 per cent. of the rateable value in 1935.” This highlights that almost 25% of the city had been rebuilt in the 30 years between 1905 and 1935 – it would be interesting to compare between 1986 and 2016 to see if a similar amount, but it does demonstrate that the City of London has always been under a process of considerable change.
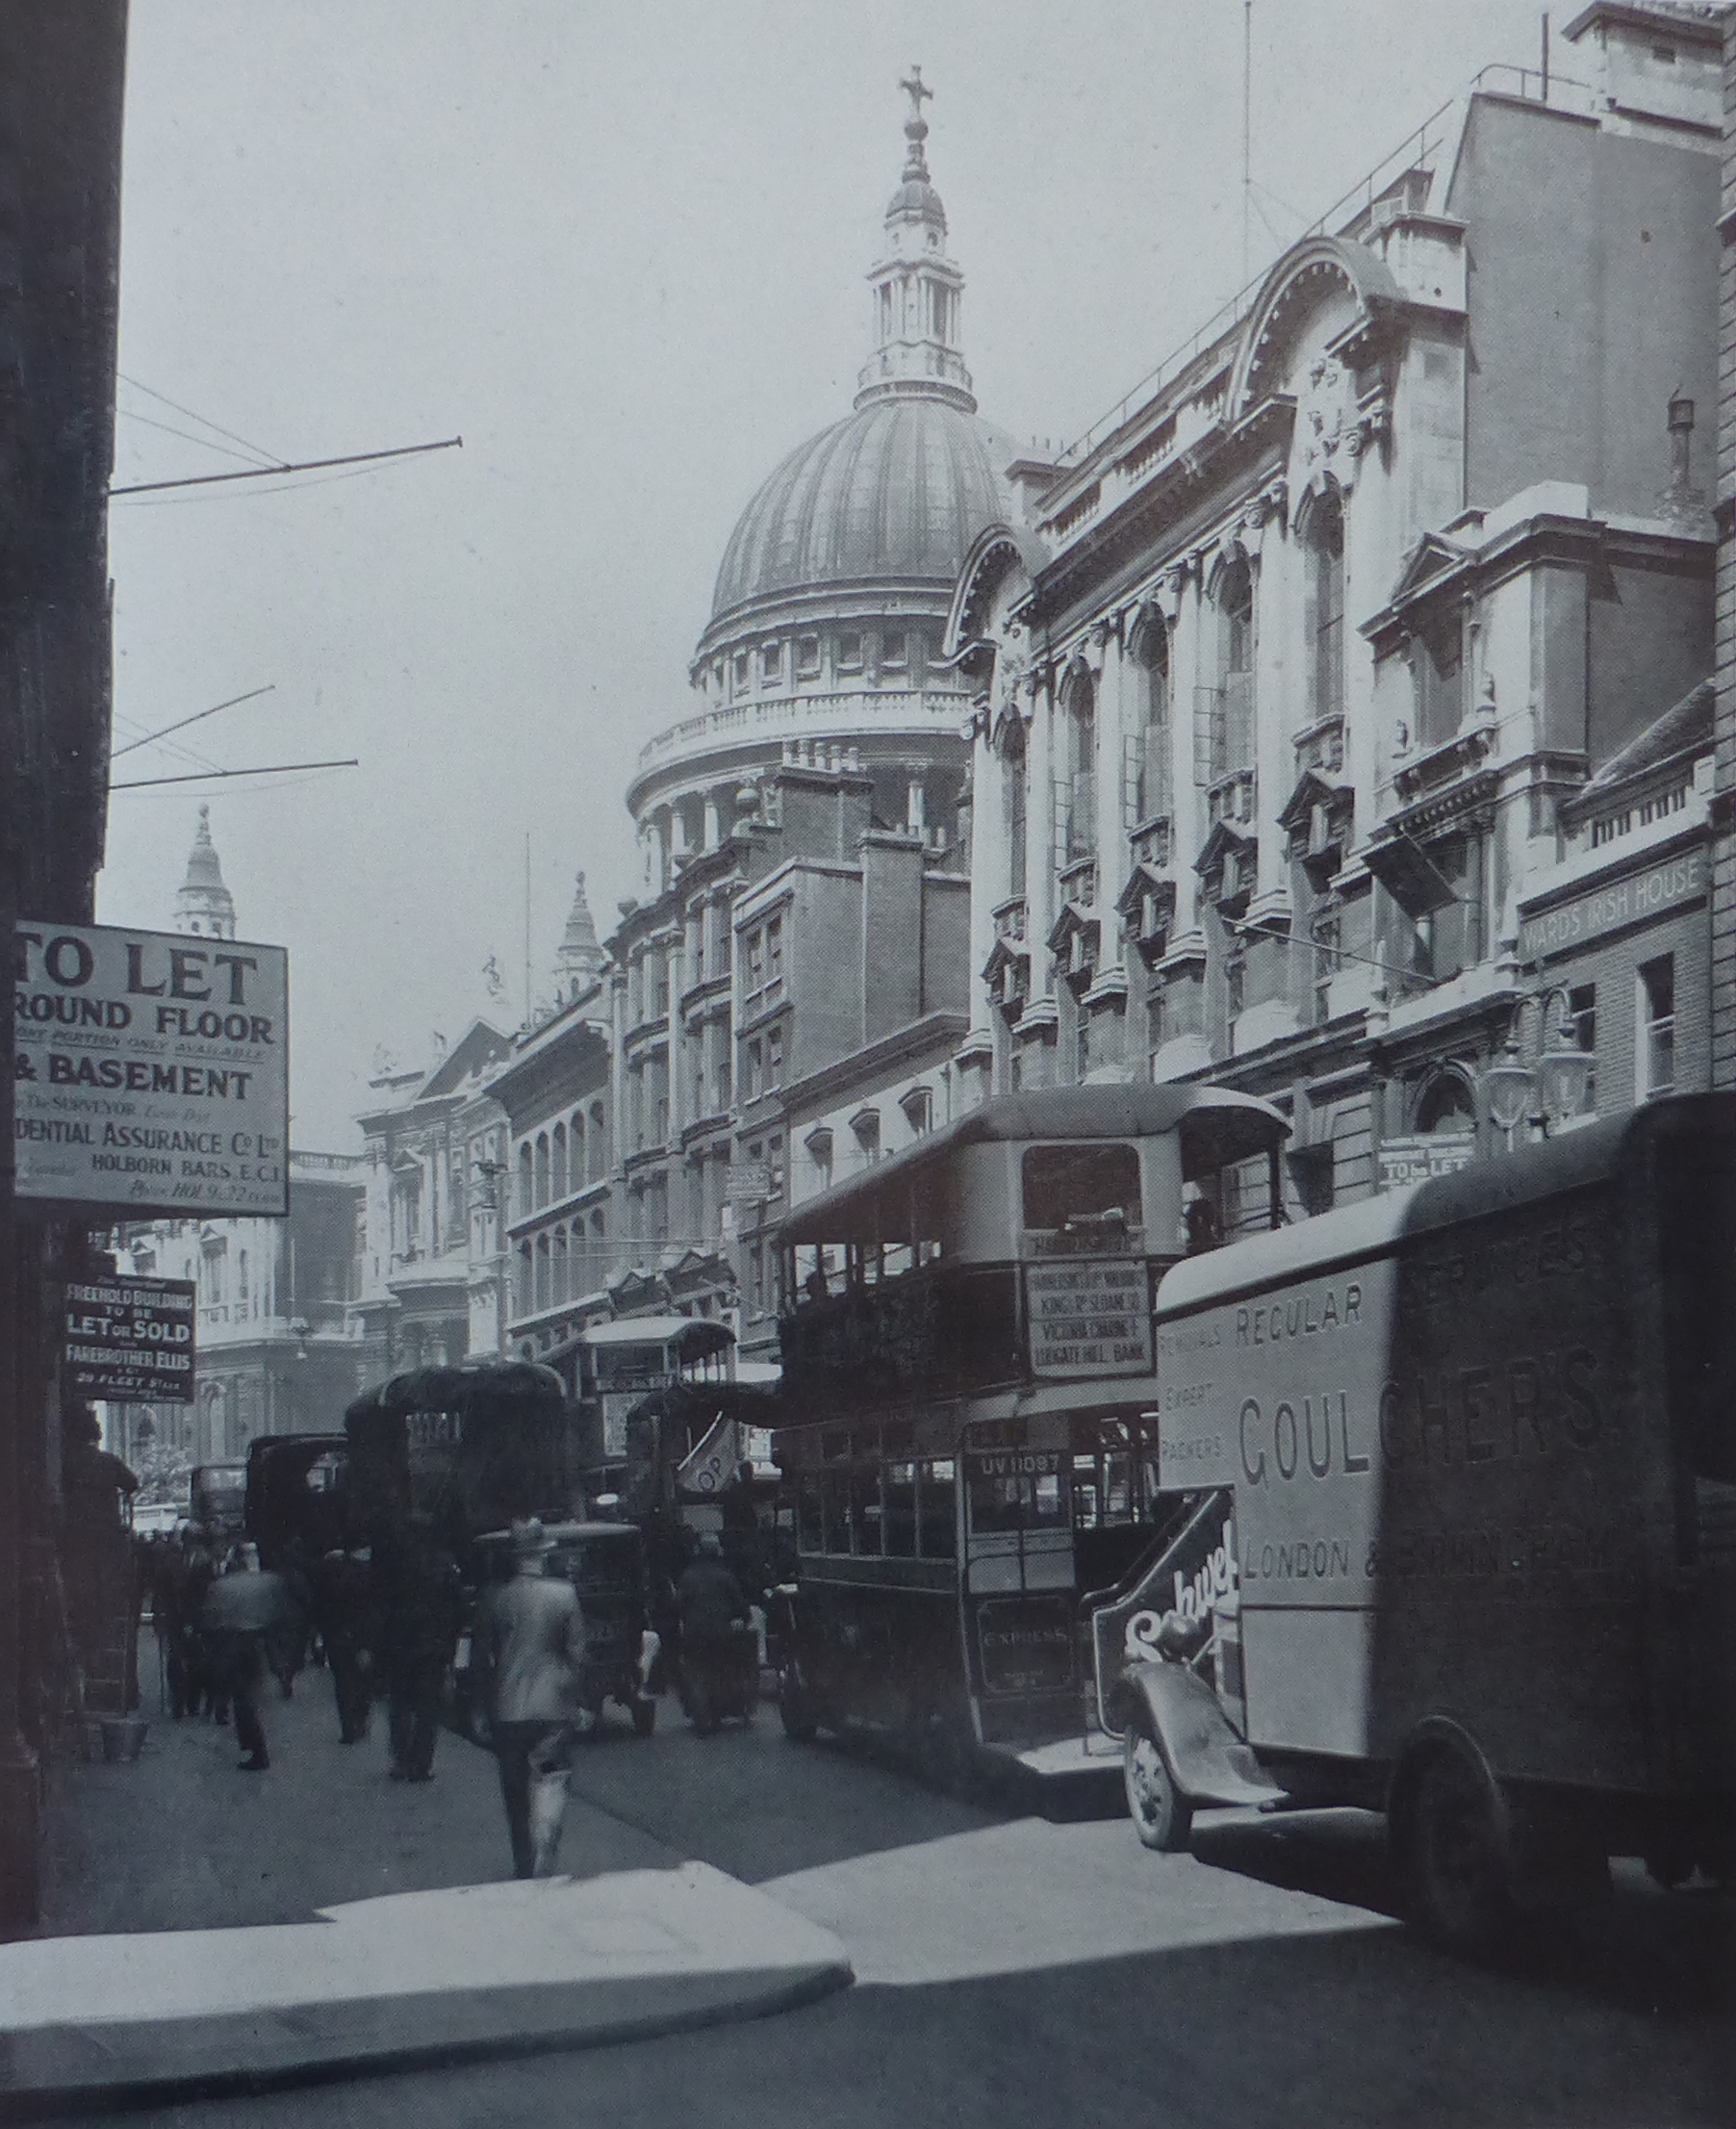
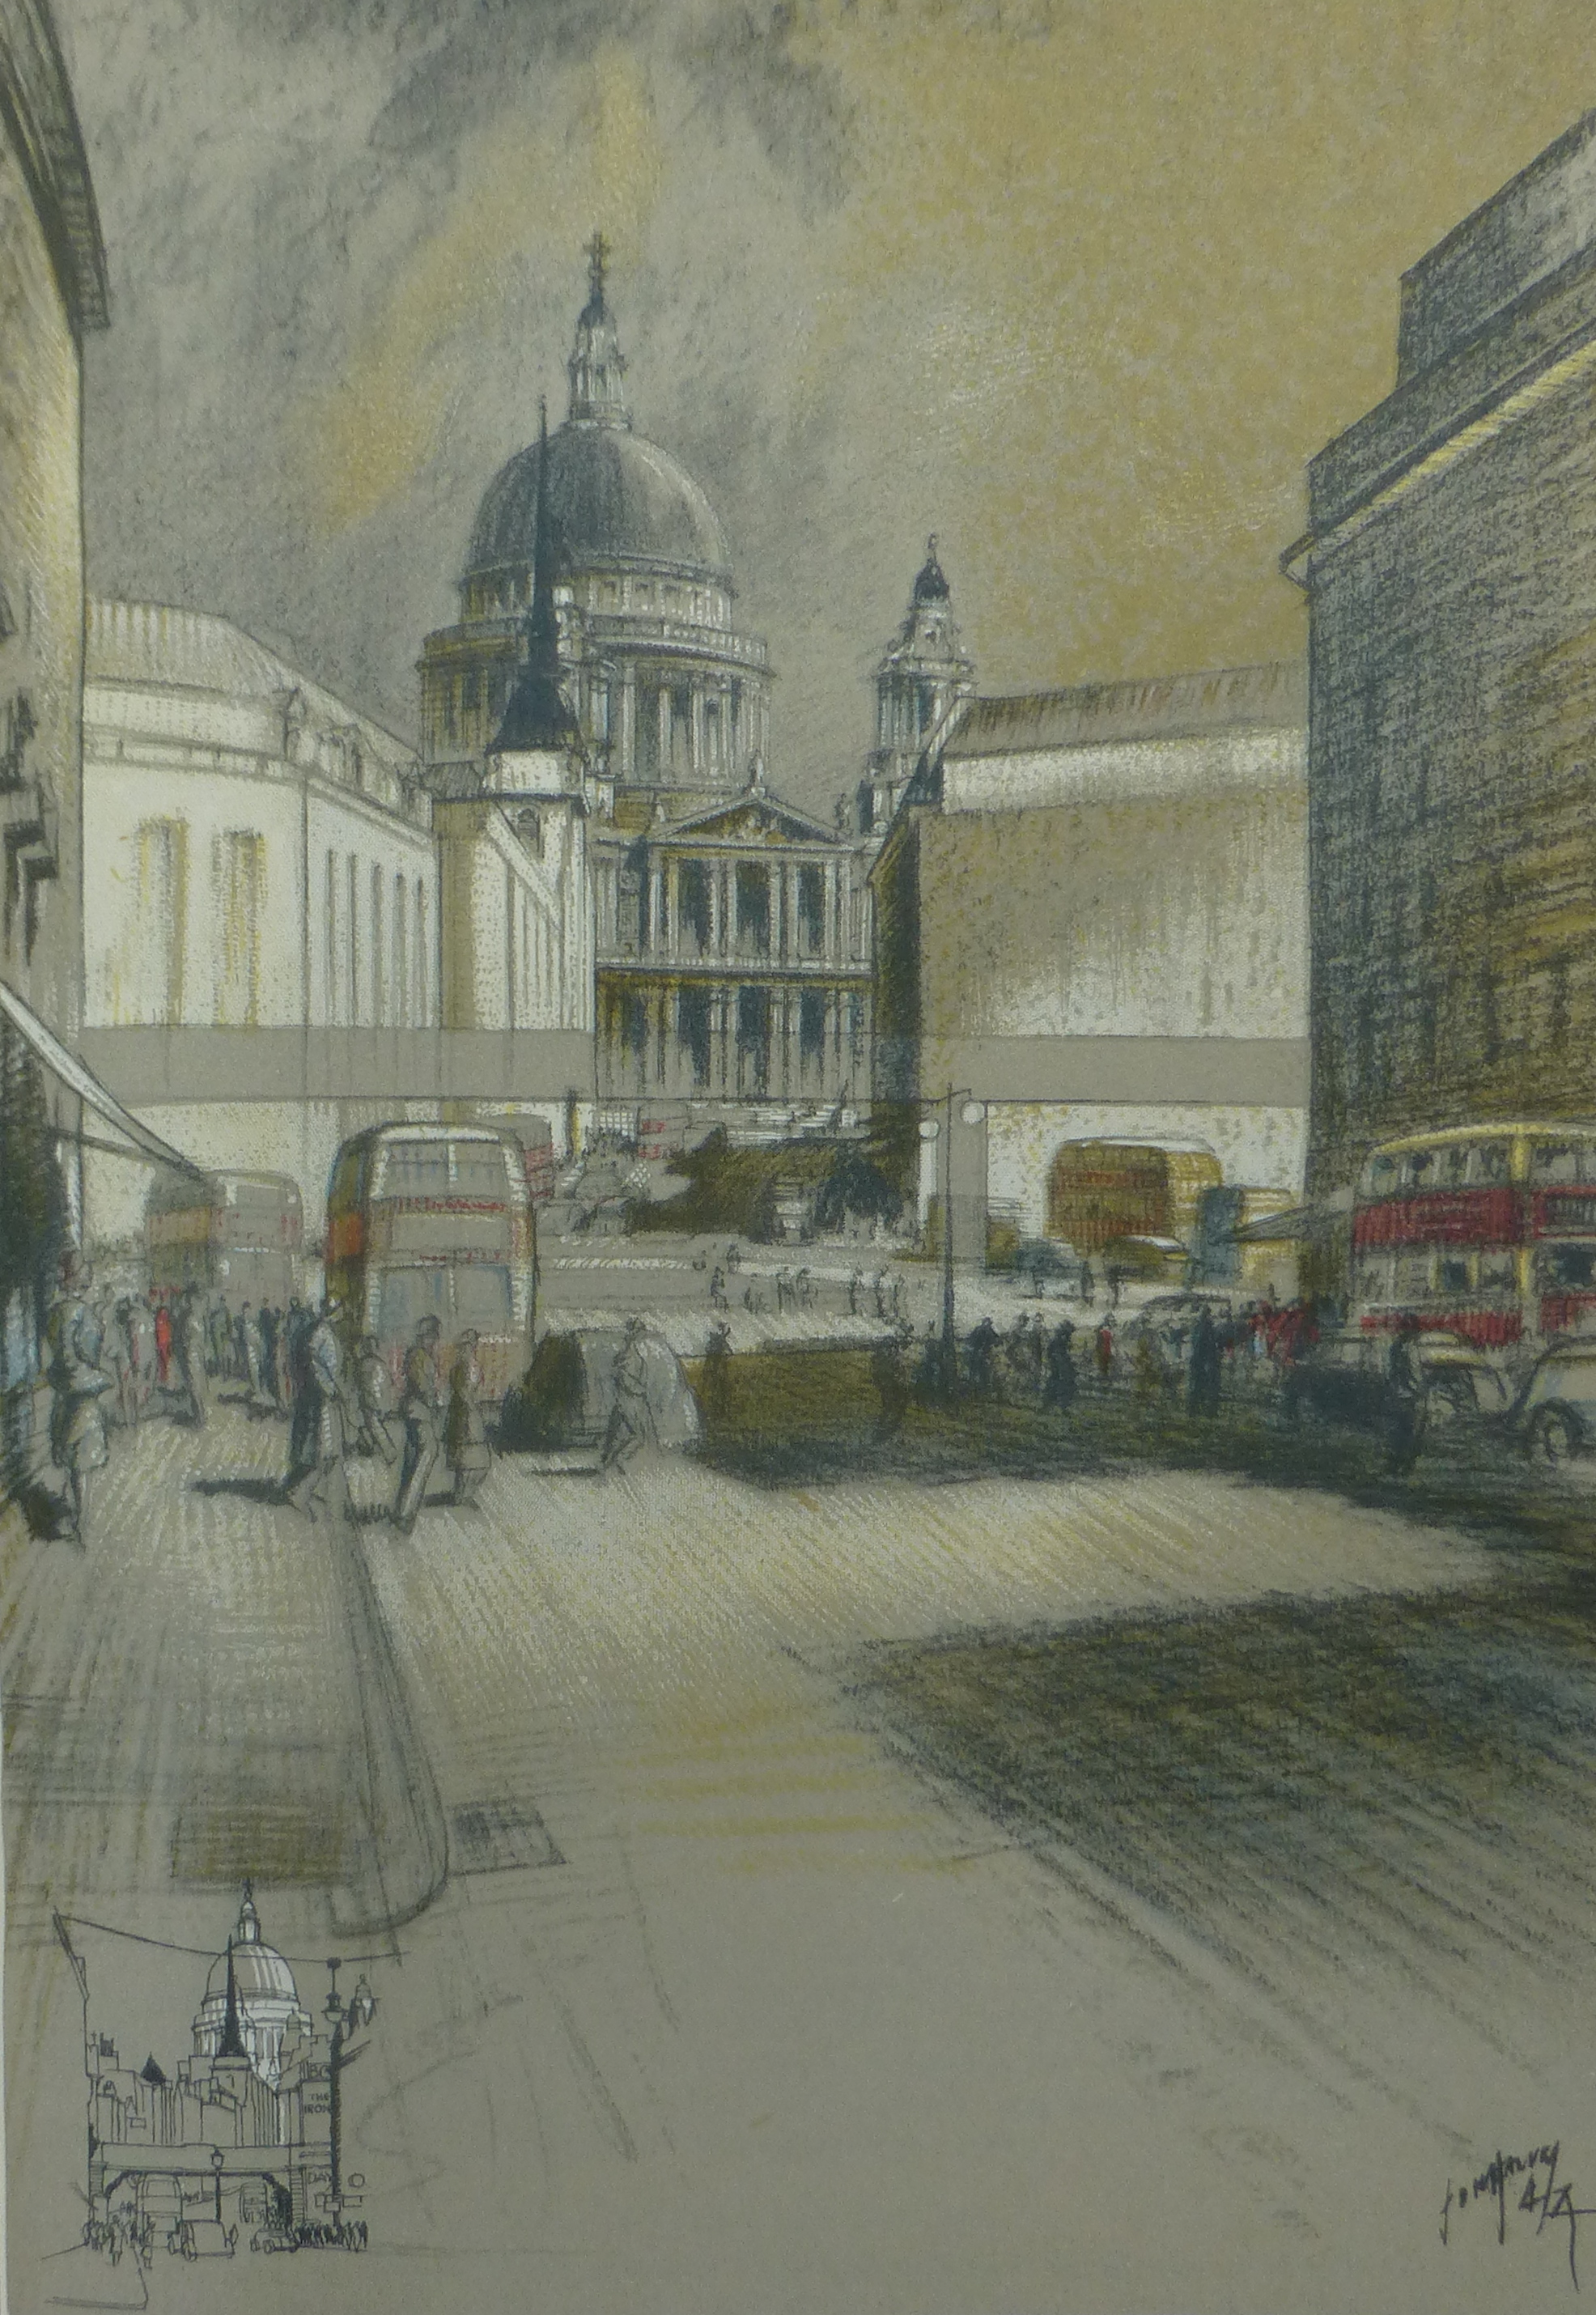
The following view of St. Paul’s from the south side of Cannon Street at the corner of Friday Street showing how the view of the Cathedral was obscured:
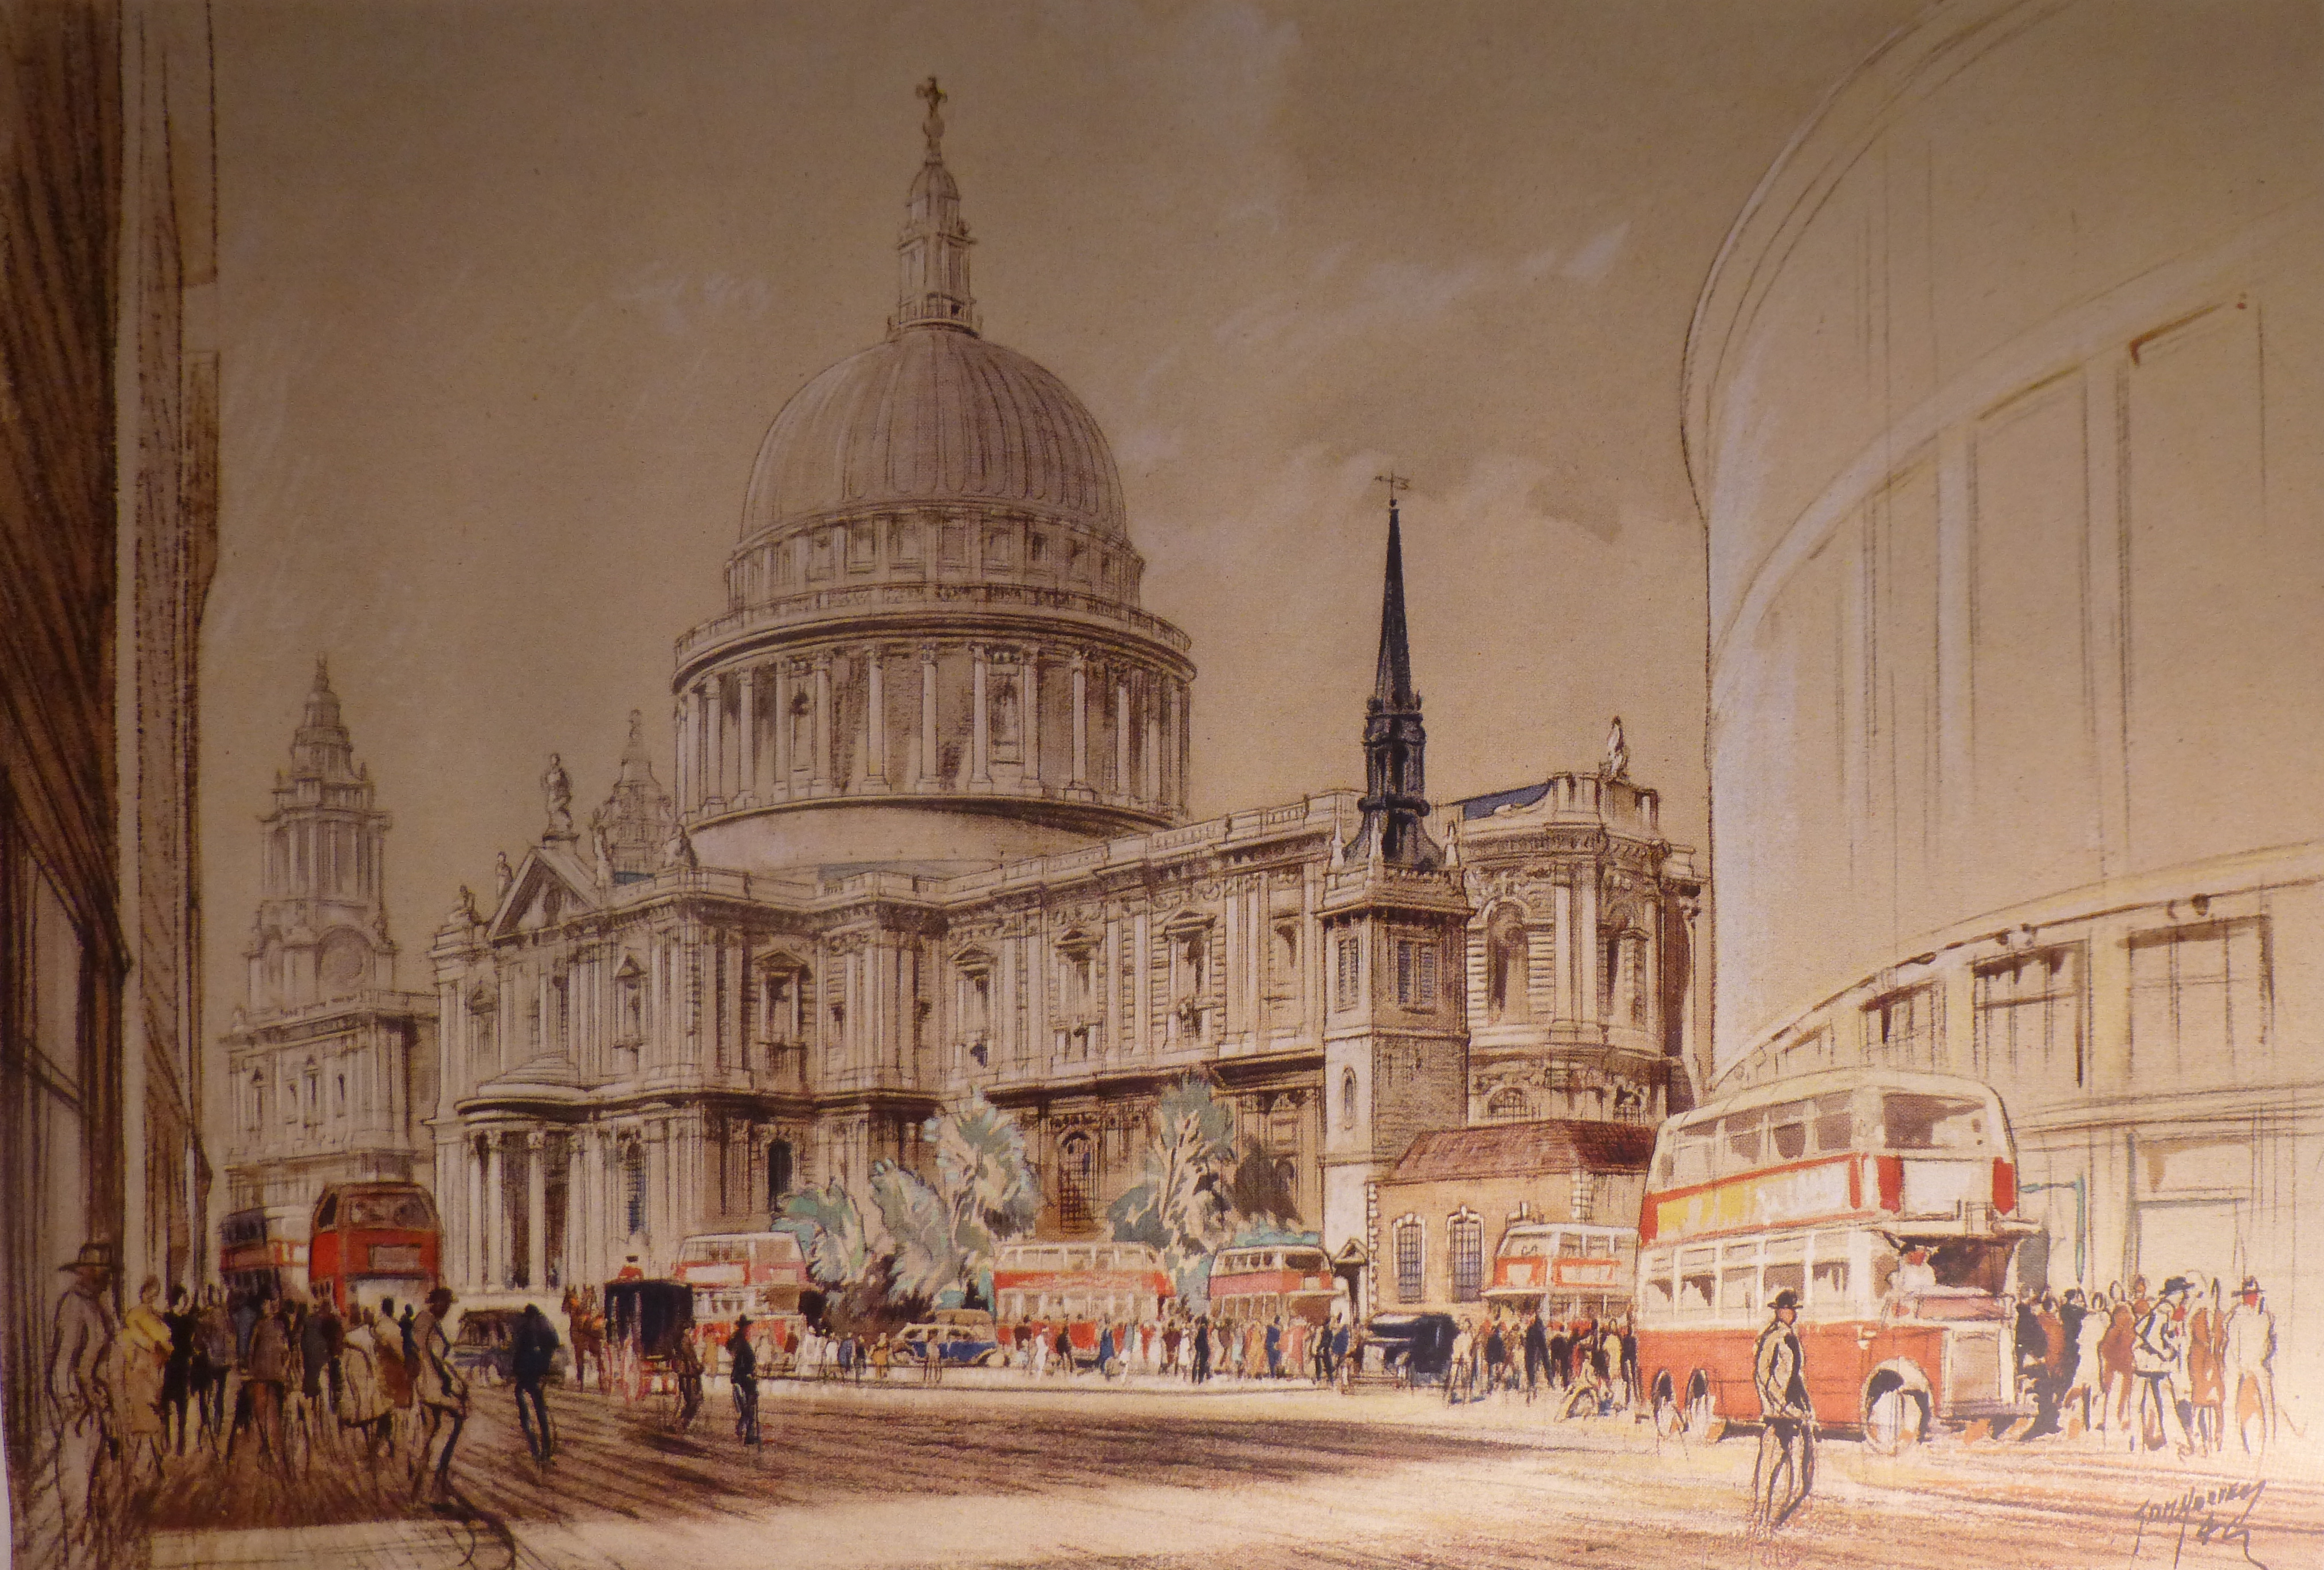
The drawing below shows the view from the same position as the above photo if the proposals of the report were carried out to open up the space around St. Paul’s Cathedral.
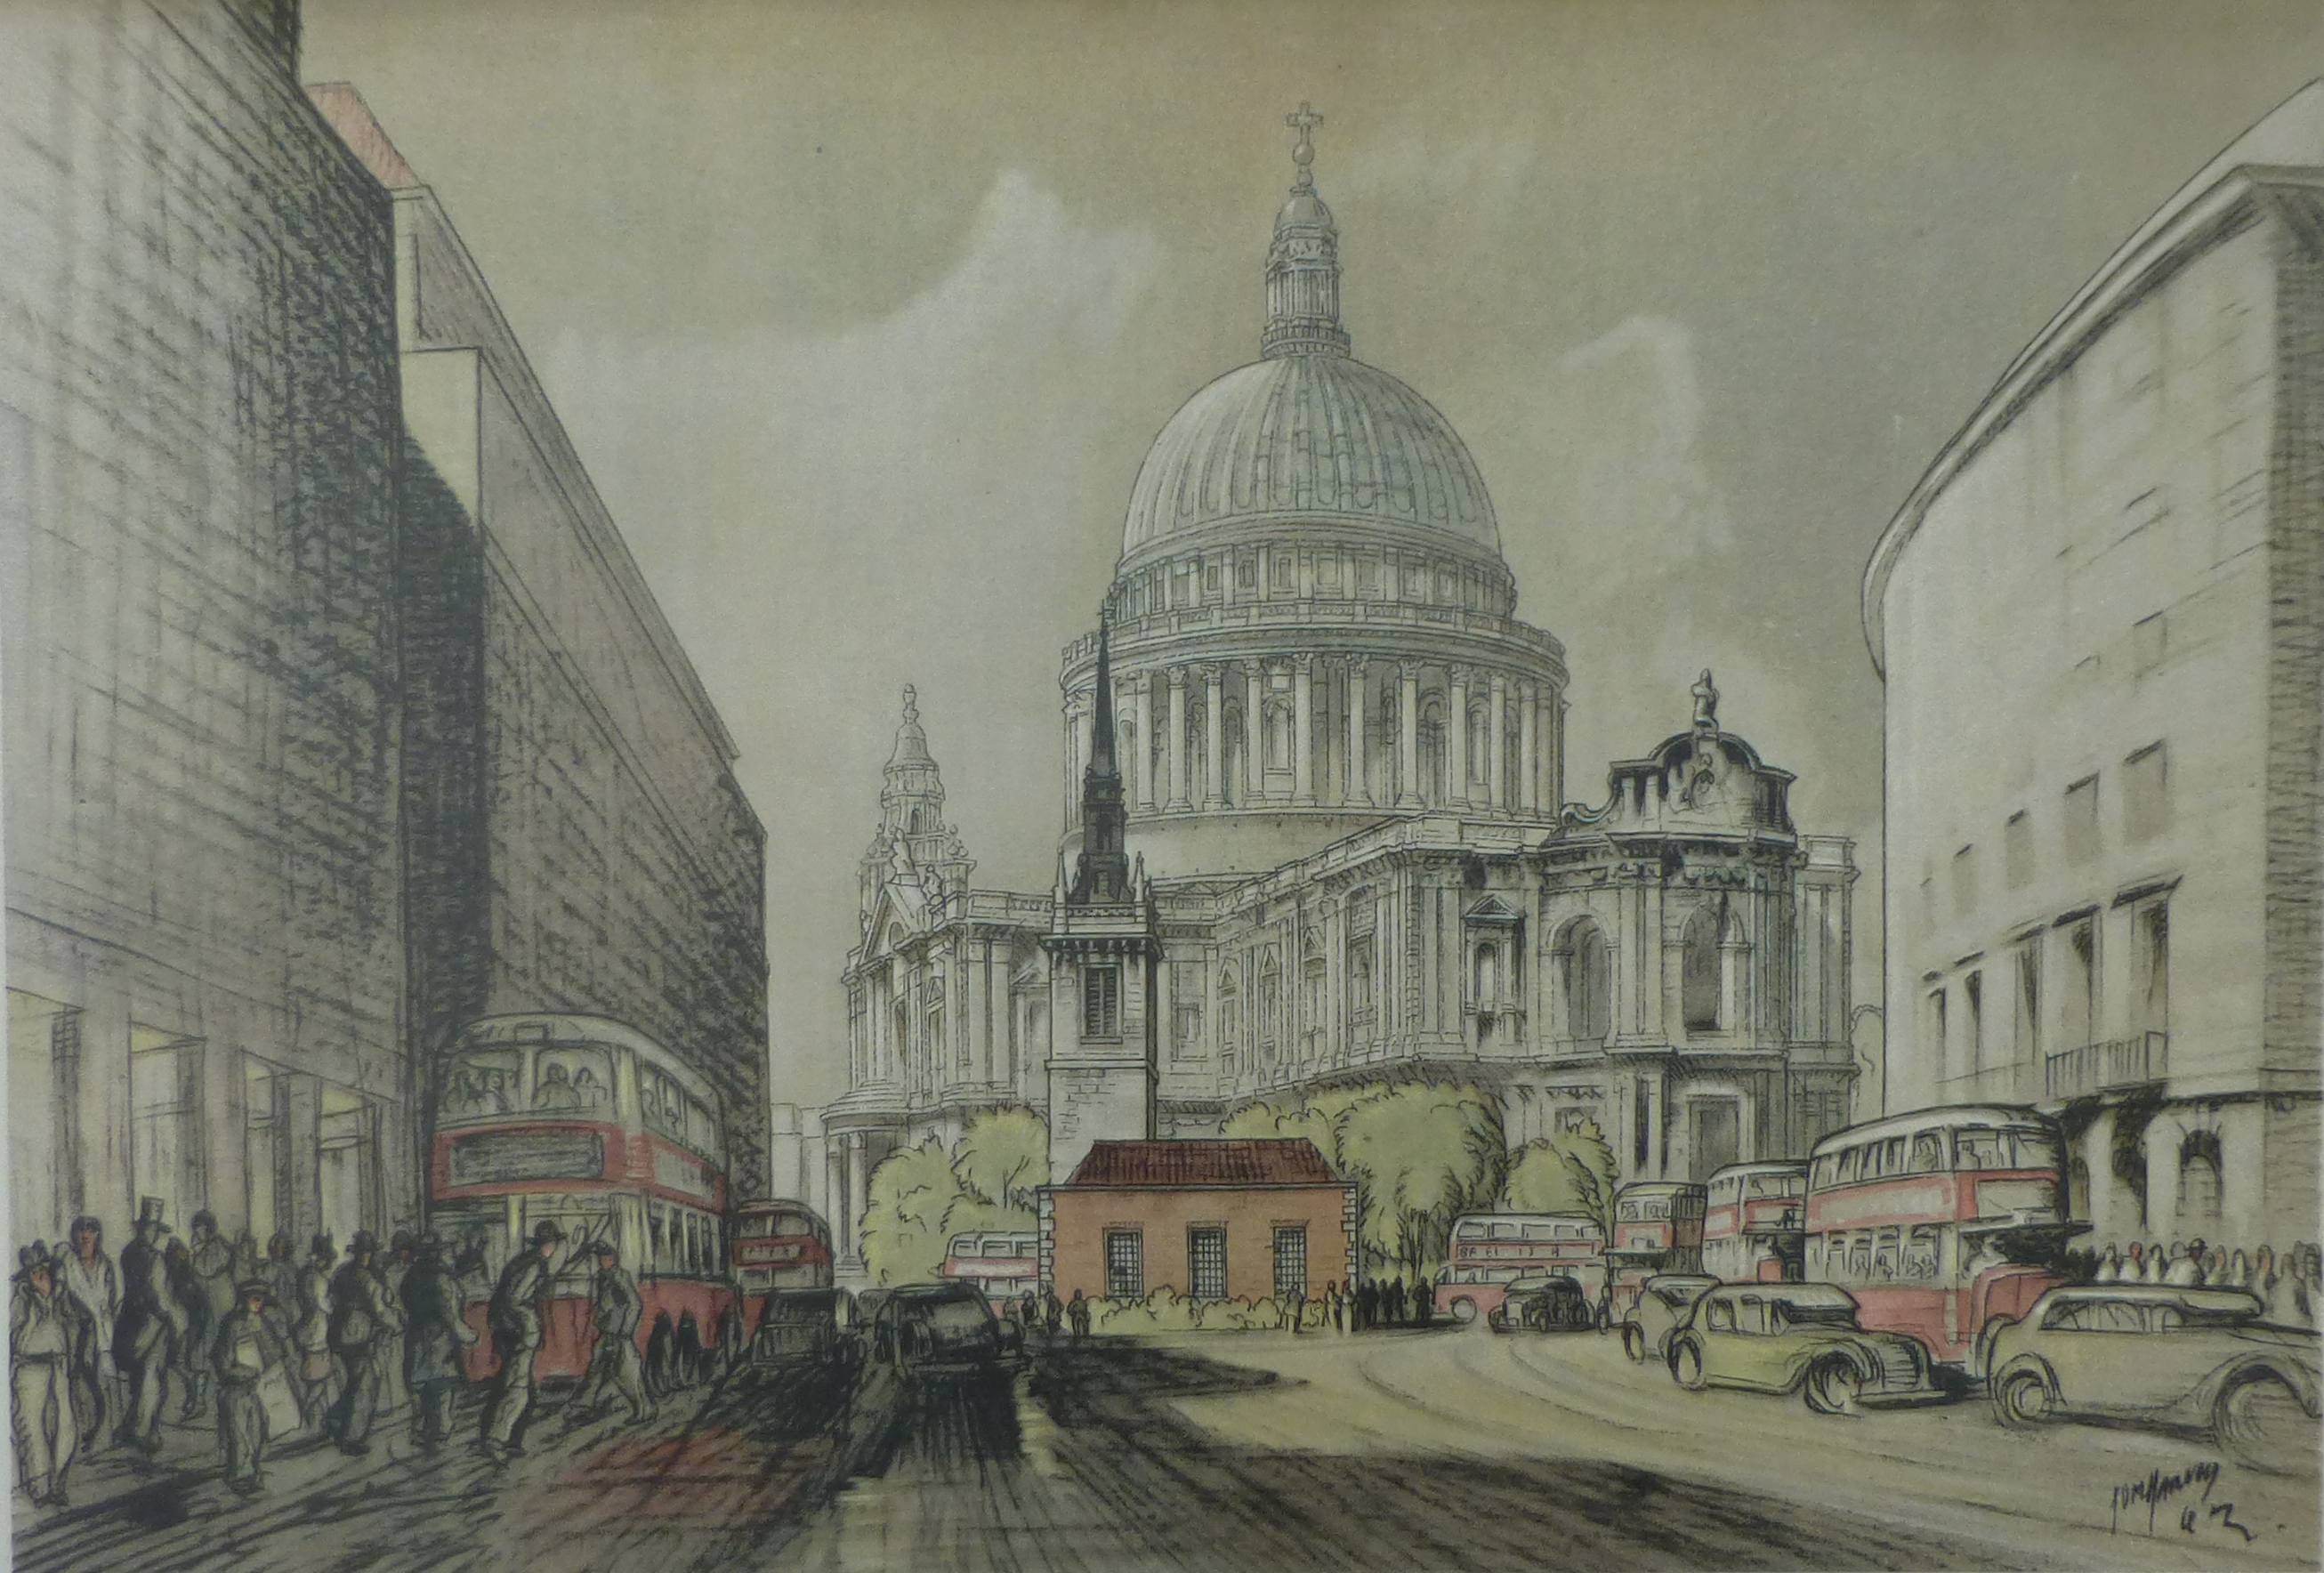
The following drawing shows the proposed view from the east with the view of the Cathedral now open. The small church in front of the Cathedral is St. Augustine and the report comments that it assumes the church is restored – it was heavily damaged by bombing during the night of the 29th December 1940.
The following is the proposed view of St. Paul’s from the corner of Shoe Lane and Fleet Street, looking up Ludgate Hill. The rail bridge running across the bottom of Ludgate Hill is shown shaded to show the impact of the removal of the bridge (one of the recommendations of the report) and how this would open up the view of the Cathedral.
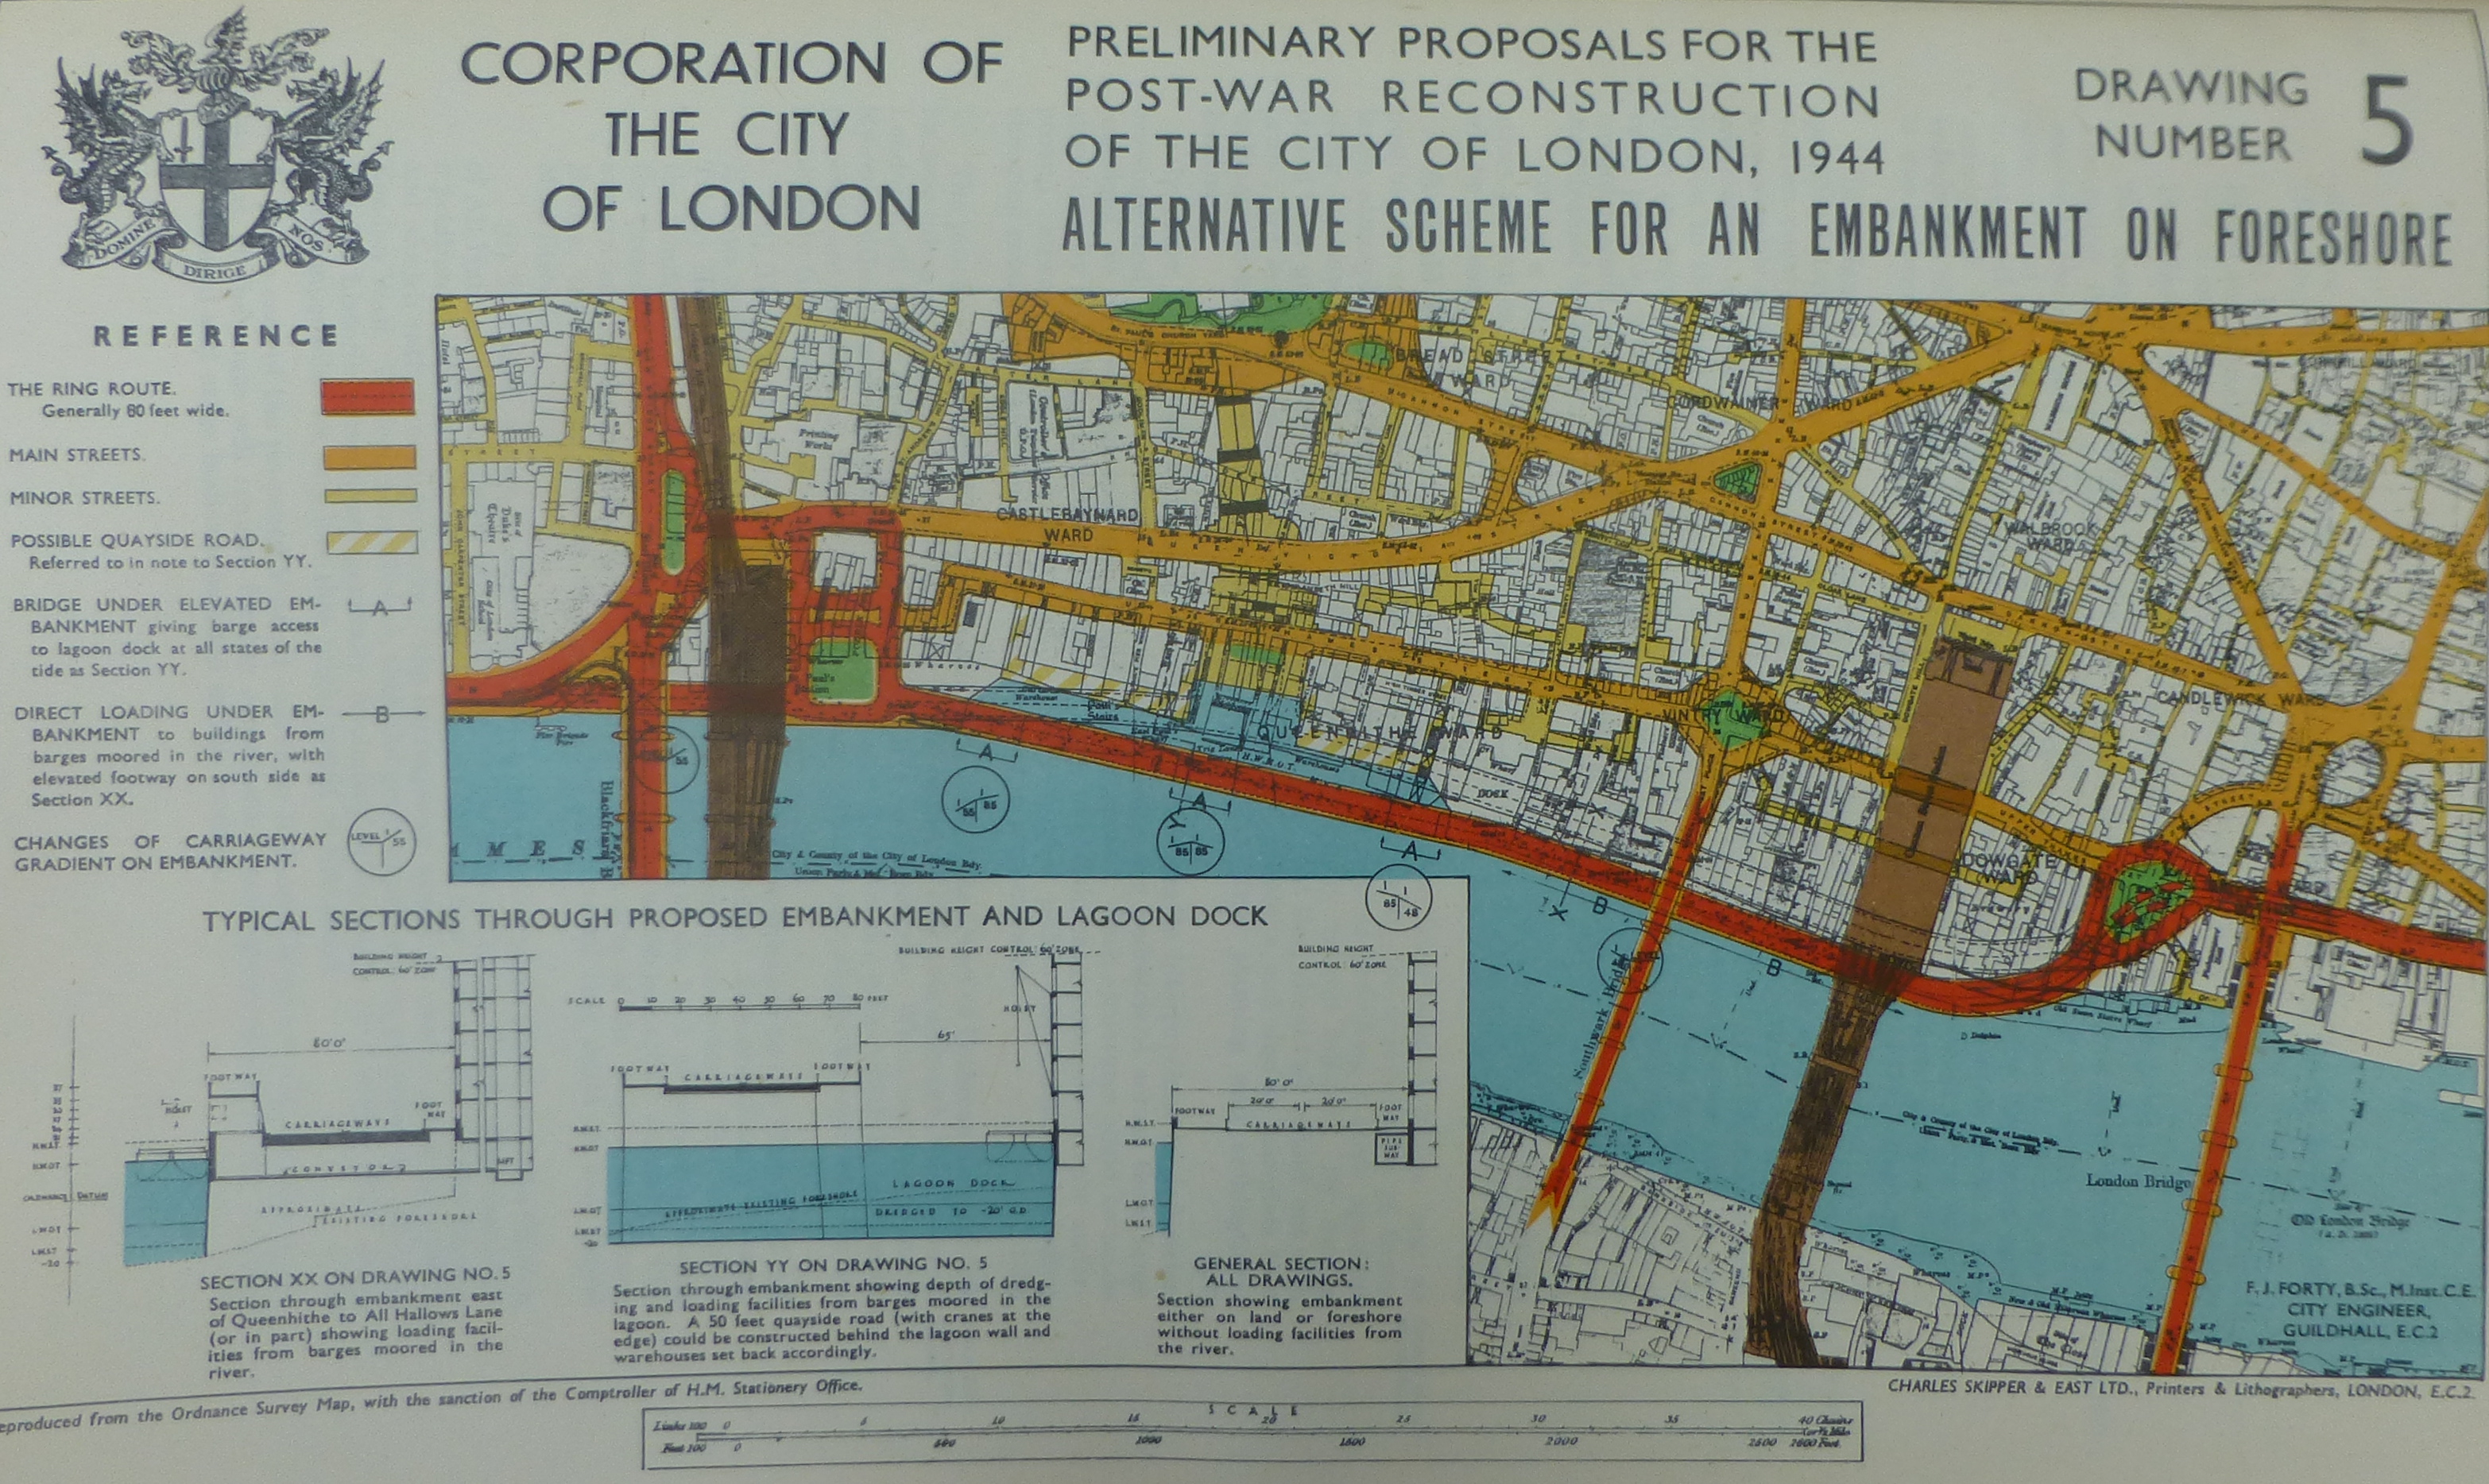
The report also contains a large number of maps detailing the proposed schemes and also key information about the City. The following map shows one of the proposed schemes of an Embankment running along the foreshore of the Thames. This was planned to be an 80 foot wide ring route around the City that would take traffic from the end of London Bridge to meet up with the existing Embankment just past Blackfriars Bridge. Whilst the river Embankment did not get built, the southern ring route did get constructed in the form of a wider Upper and Lower Thames Street.
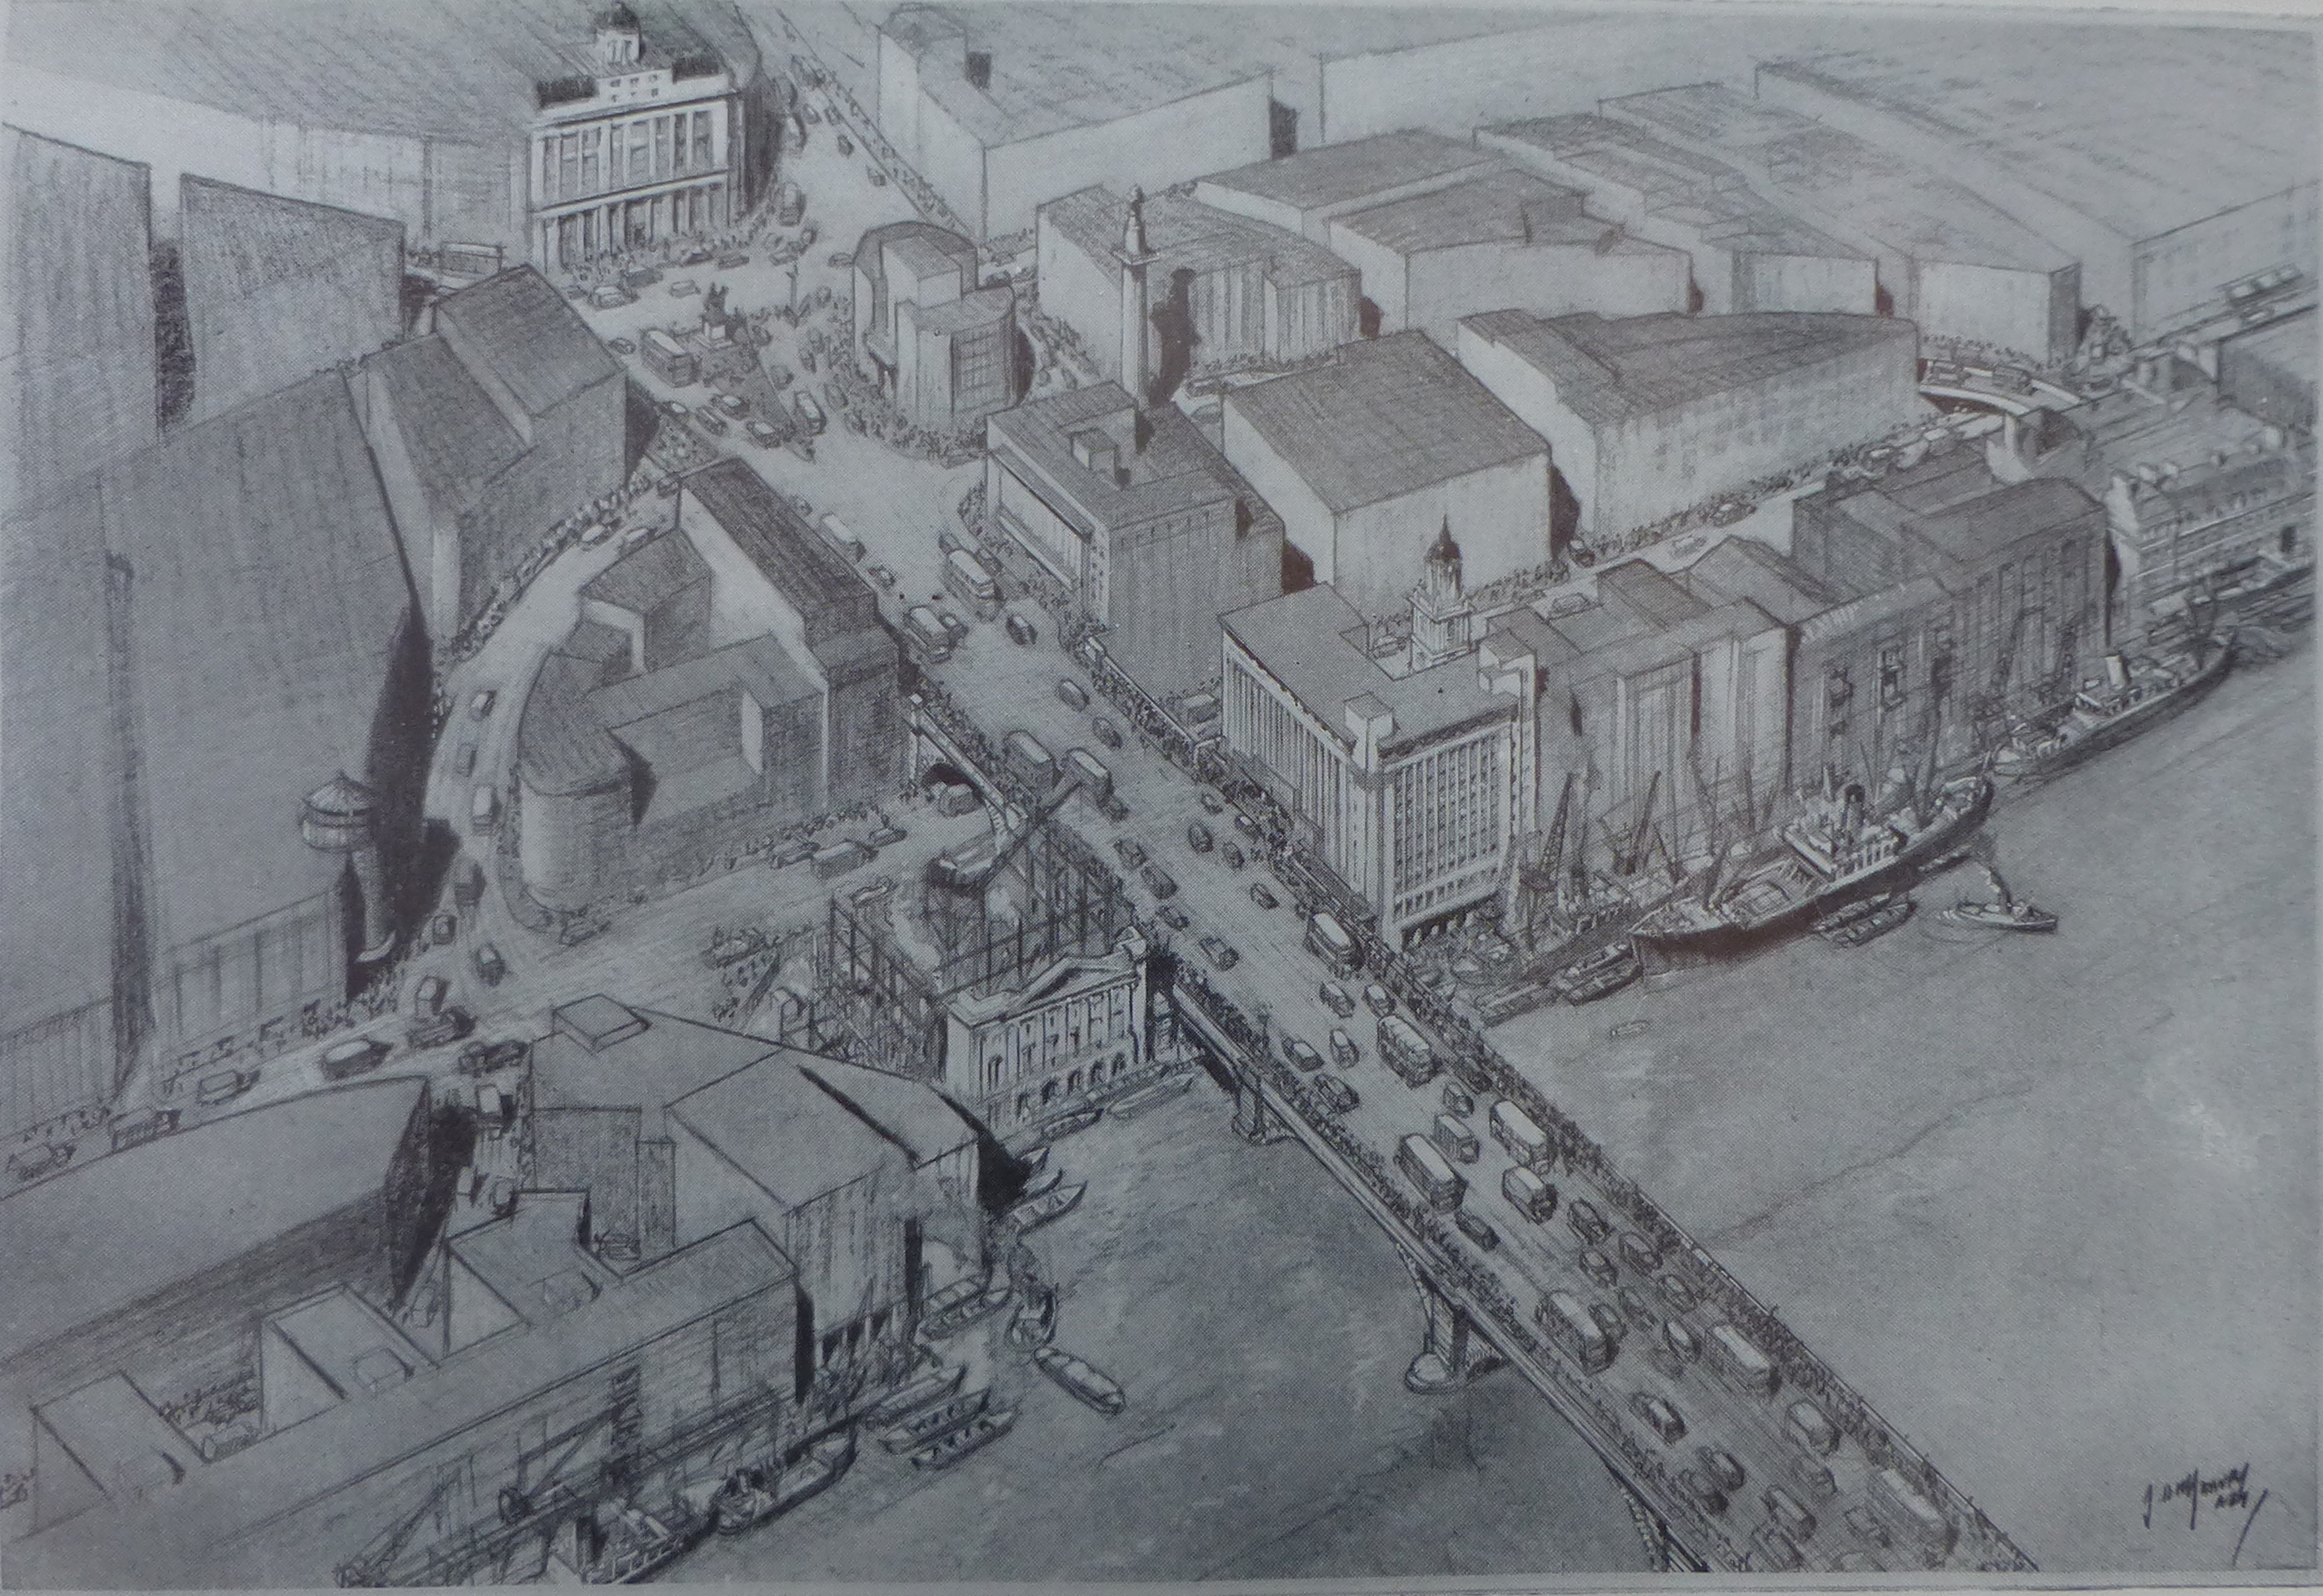
The following drawing is titled “Bird’s-Eye View of London Bridgehead from the South-West”. The drawing shows where the proposed new Embankment route would curve from the water front to a new junction with Upper Thames Street and Arthur Street. (I covered Arthur Street in a post on the Ticket Porter pub that was in this street, the post can be found here)
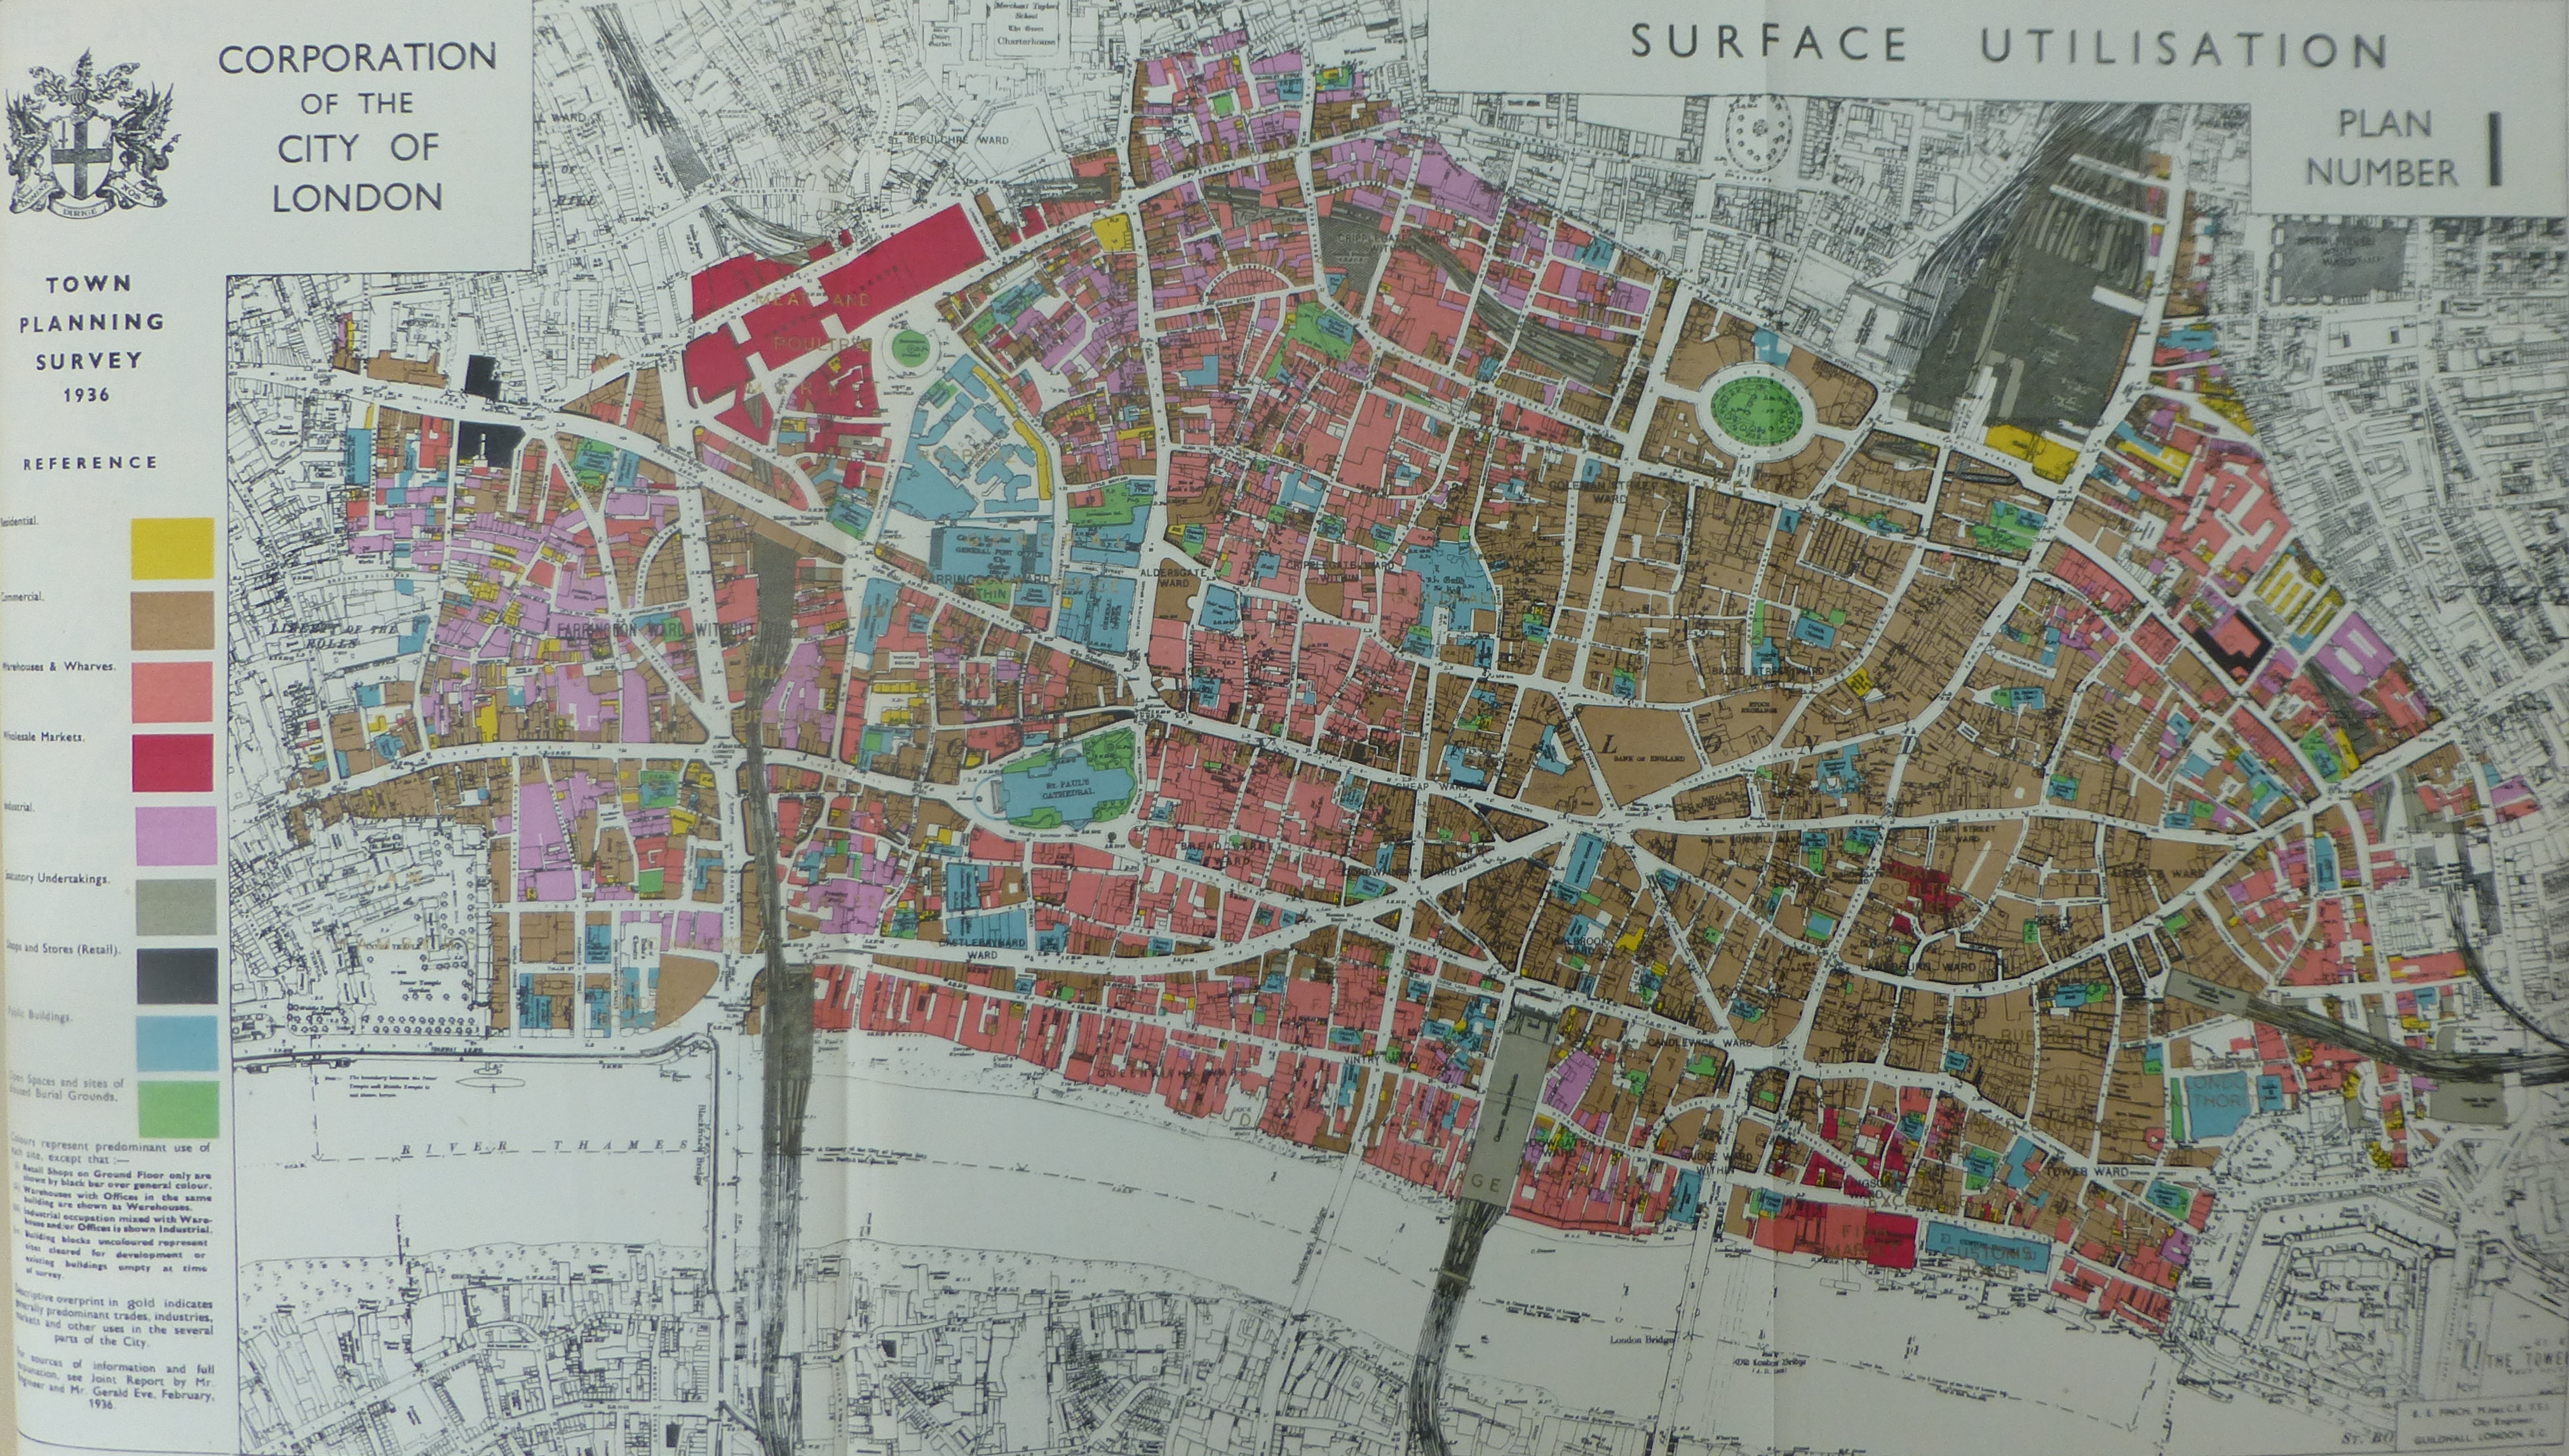
The following map shows “Surface Utilisation across the City” in 1936. The map shows how much of the city was comprised of Warehouses and Wharfs. Not sure how to describe the colour, but it is the pink / salmon colour to the right of St. Paul’s Cathedral showing Warehouses and Wharfs all along the river frontage, up past the Cathedral and up to the area now covered by the Barbican estate. The Commercial space was centered just to the right of the Bank of England.
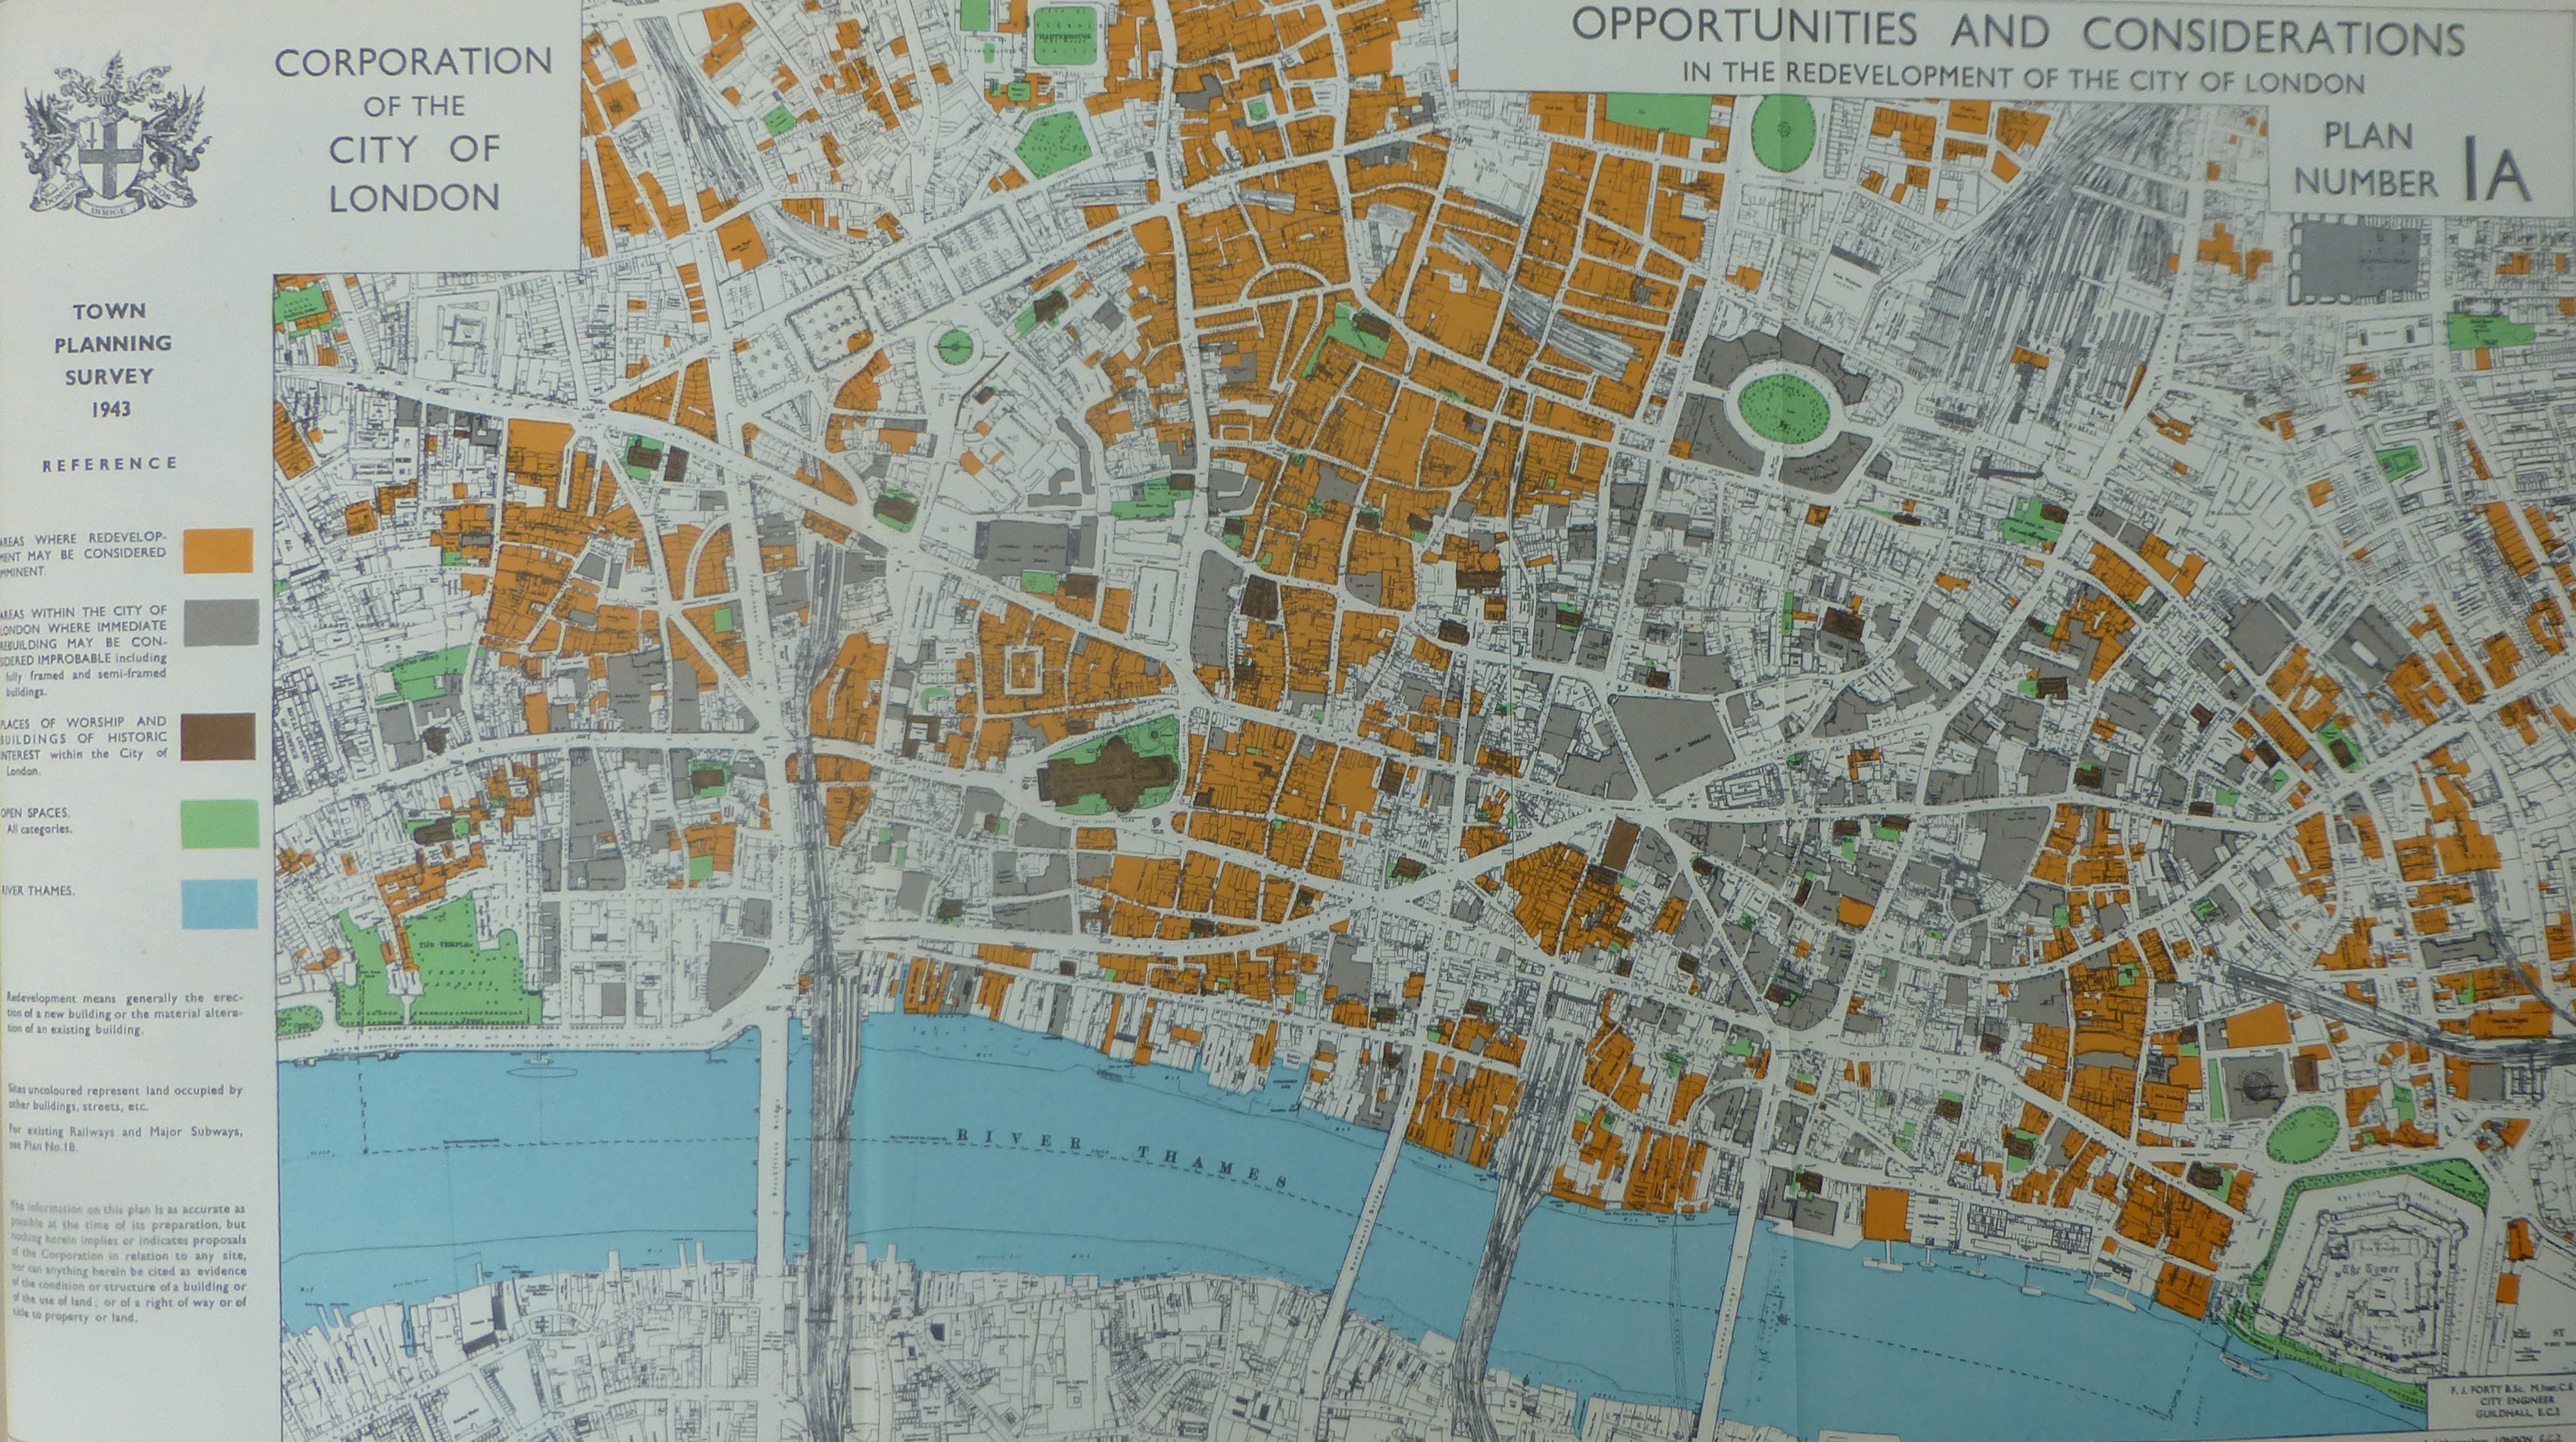
The next map is titled “Opportunities and Considerations in the Redevelopment of the City of London”. The area in orange is where redevelopment may be considered imminent and shows the areas which suffered significant damage during the war, where rebuilding of the pre-war buildings was not considered worth while.
This map shows “Existing Railways and Major Subways”, colour coded to show overhead and surface, open cut, cut and cover, deep level railways etc. Note the green lines crossing the river at bottom left. This is the Waterloo and City Line between Waterloo Station and the Bank Station.

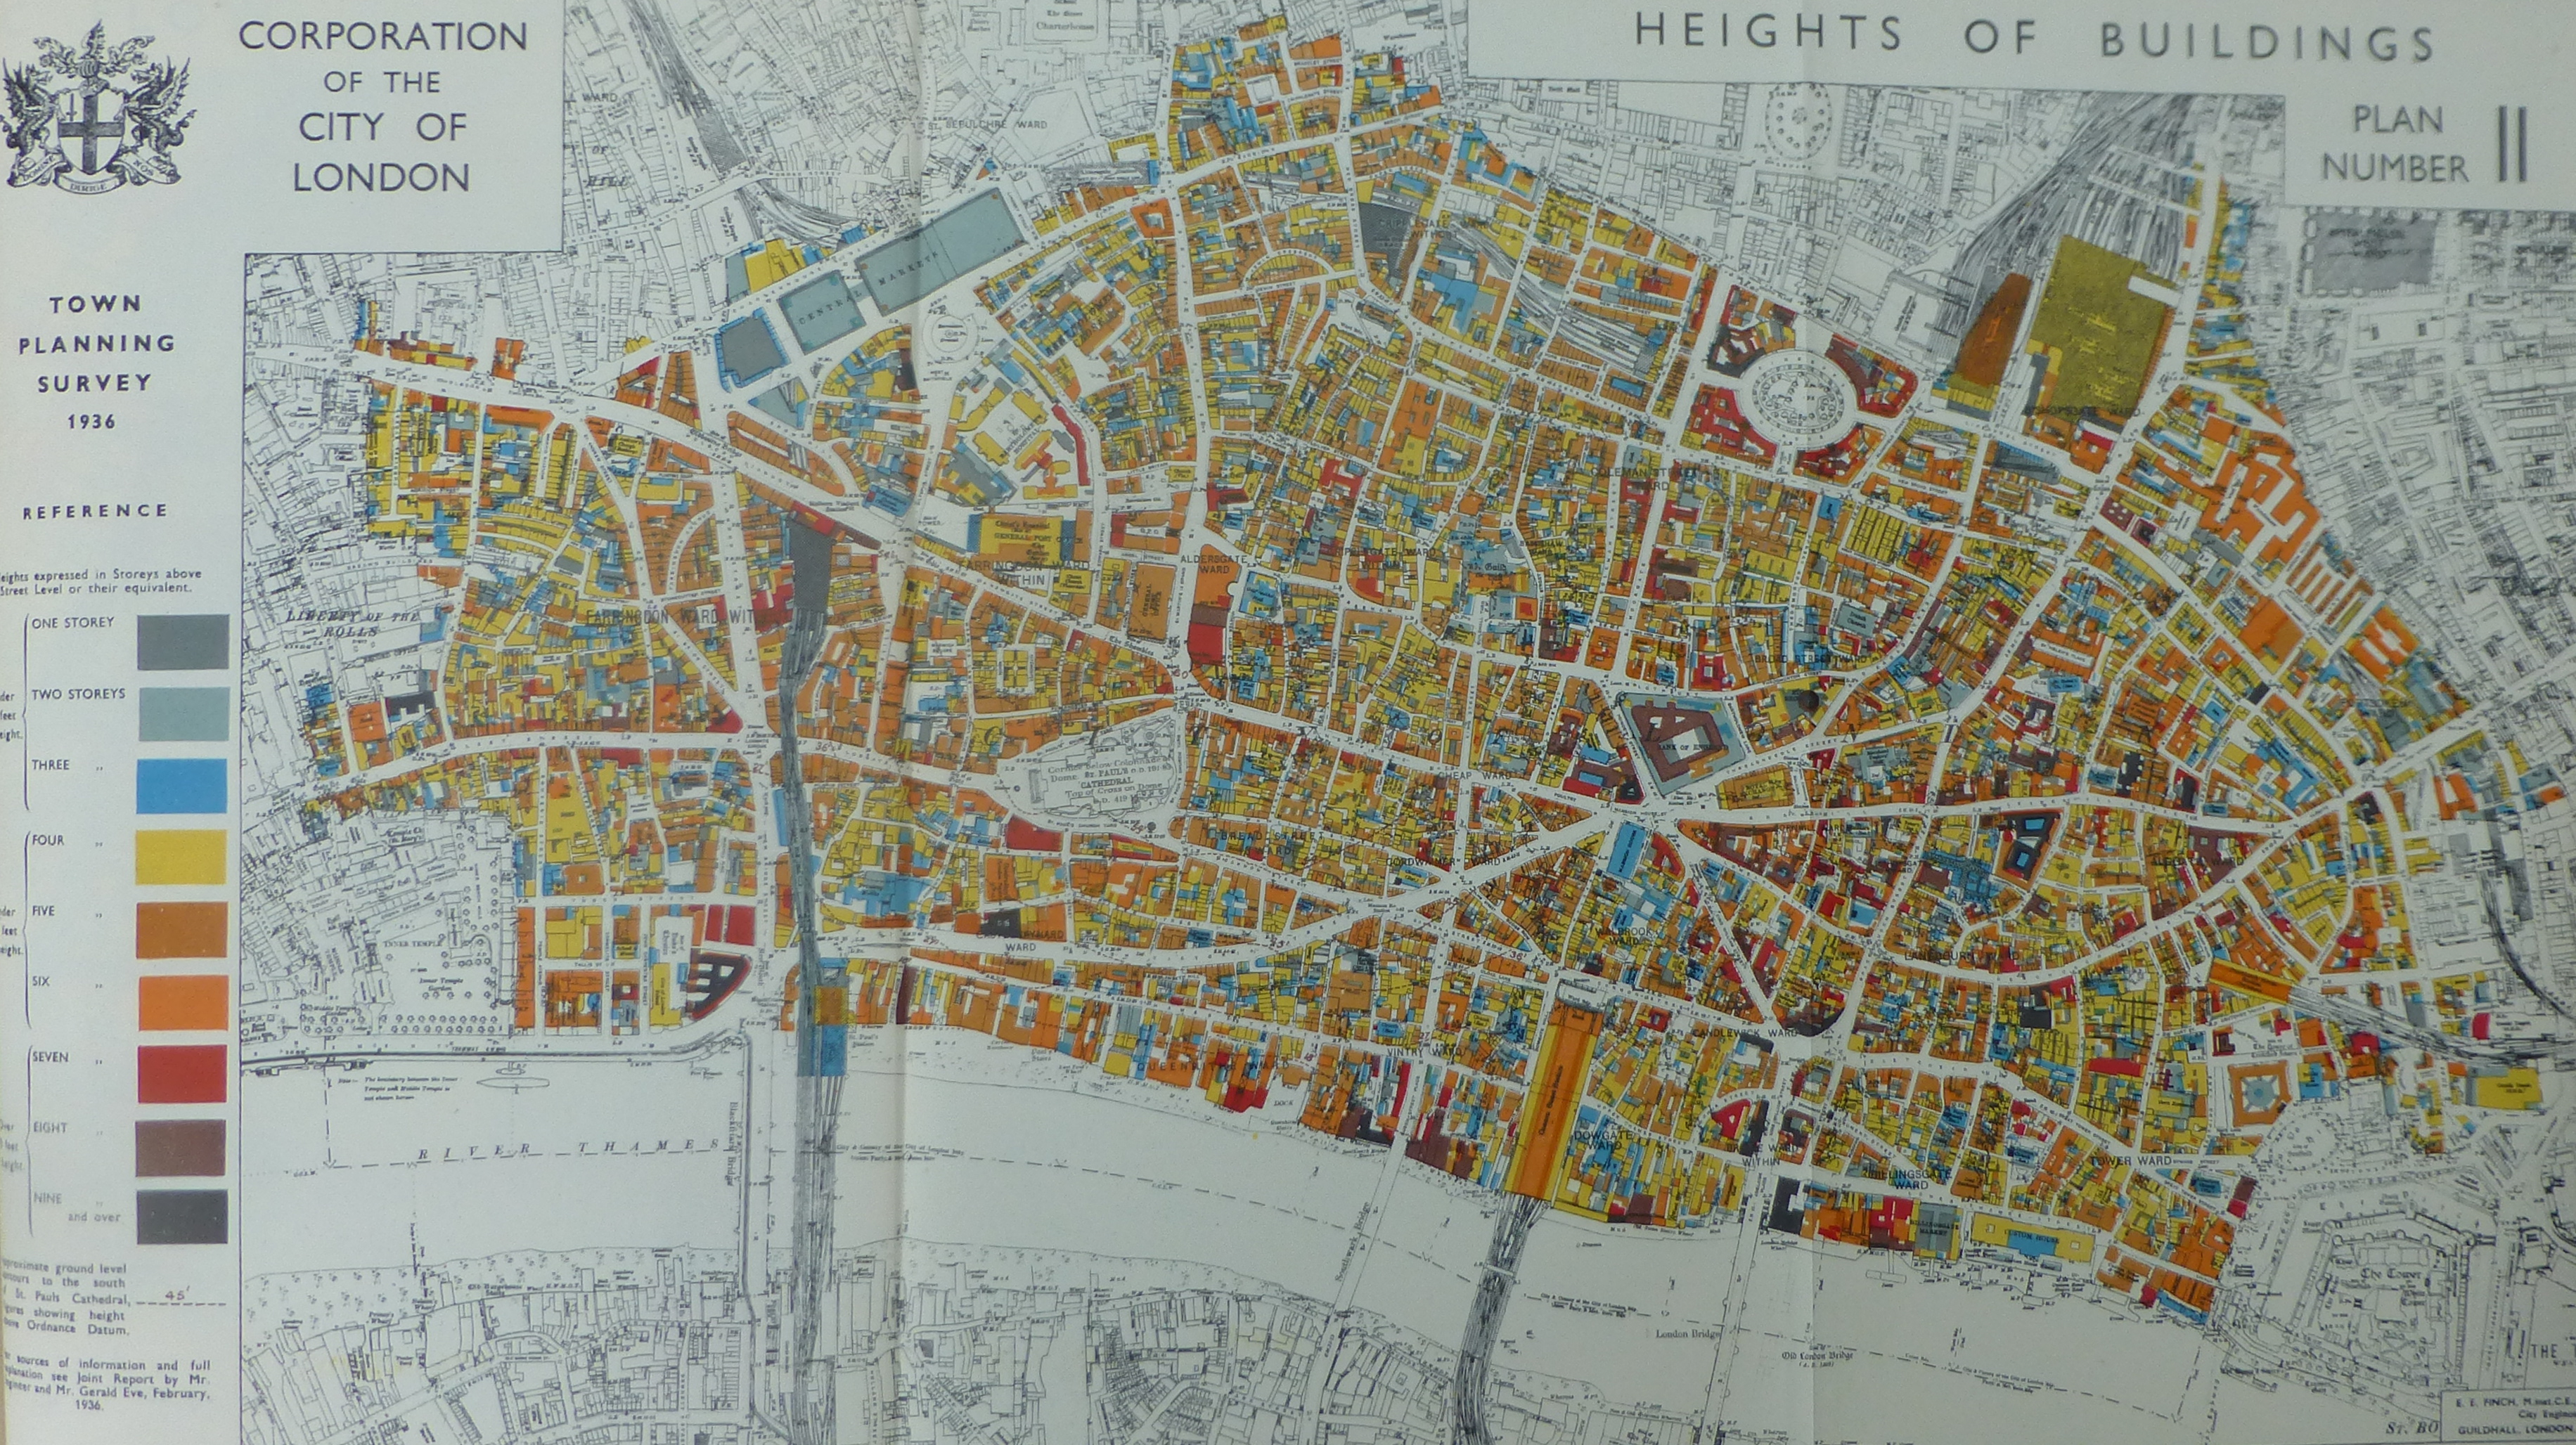
The next map shows the “Heights of Buildings” in 1936 and shows how relatively low rise the City was at the time. Black is the highest colour in the map for buildings of nine storeys and above. There is very little black to be found. How different the City would be 80 years later.
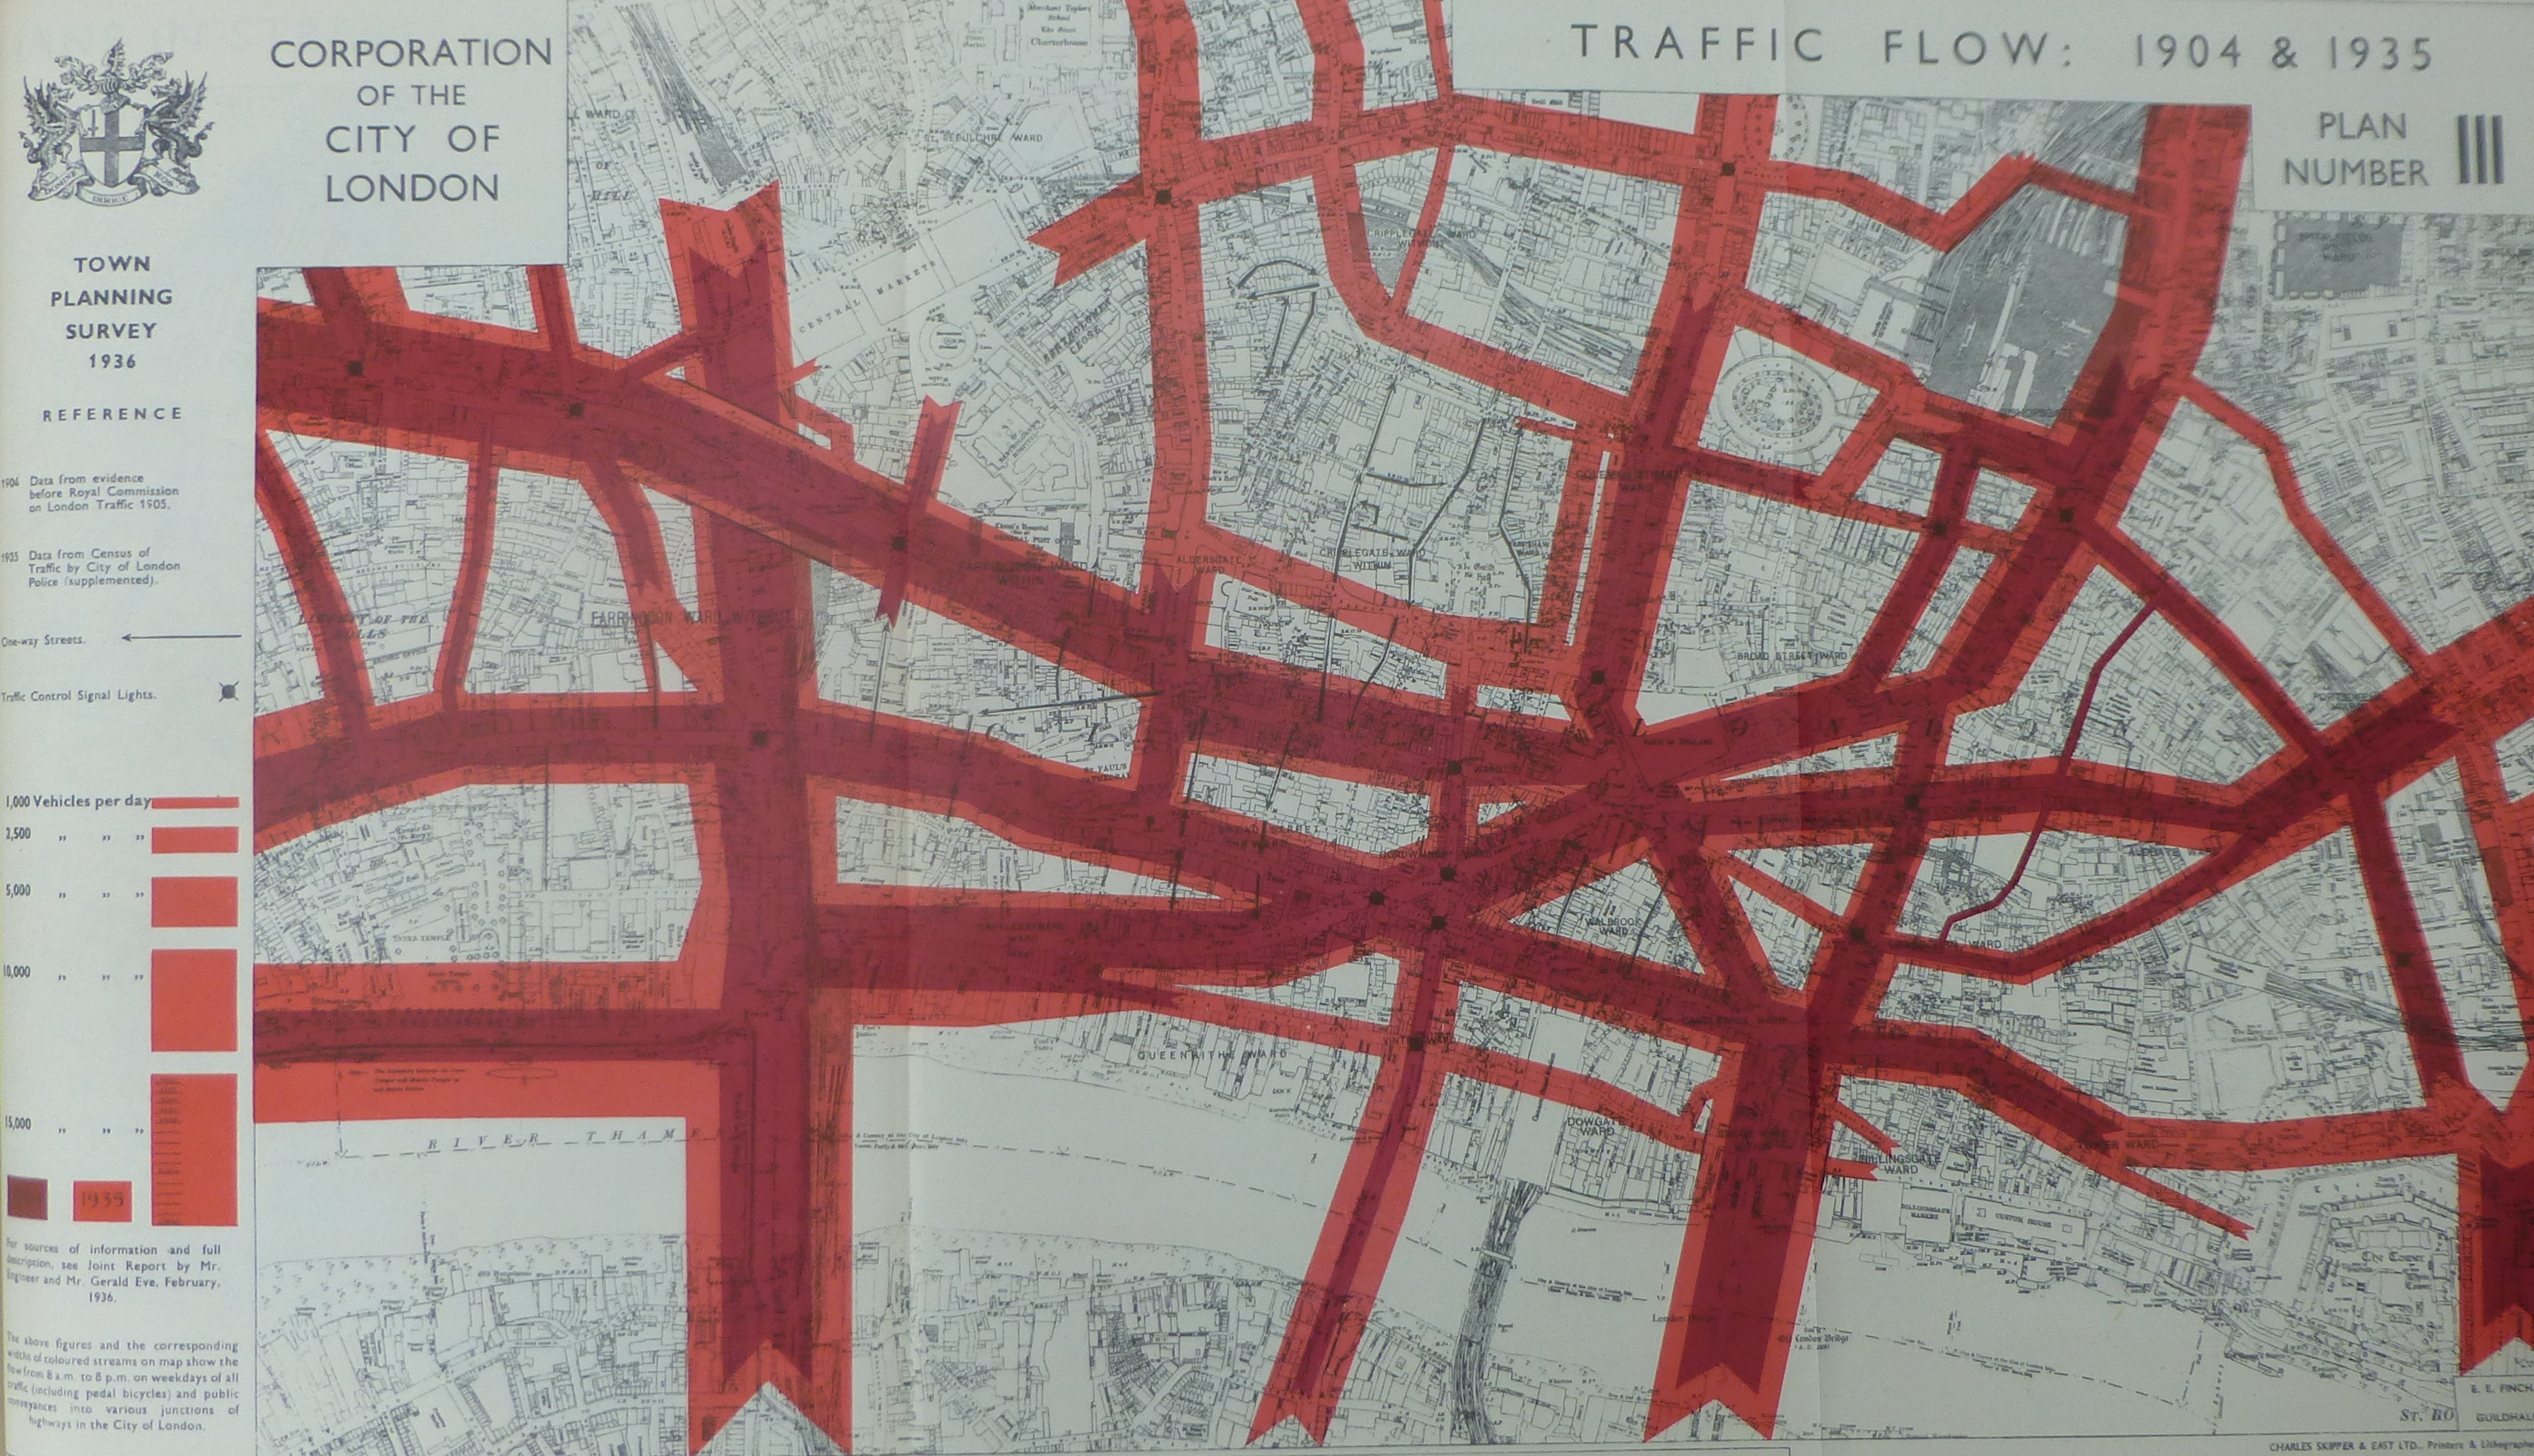
The bold red lines in the following map are a clever way of providing information on Traffic Flow across the City in 1904 and 1935. The width of the line represents the number of vehicles per day, 1,000 for the thinnest line up to 15,000 for the most thick lines. Darker red is for 1904 and light red is 1935. The small dark green blobs represent Traffic Control Signals and if I have counted correctly, at this time there were only 17 sets of traffic signals across the City. According to an ITV news report, in 2015 there were 105 sets of traffic lights across the City.
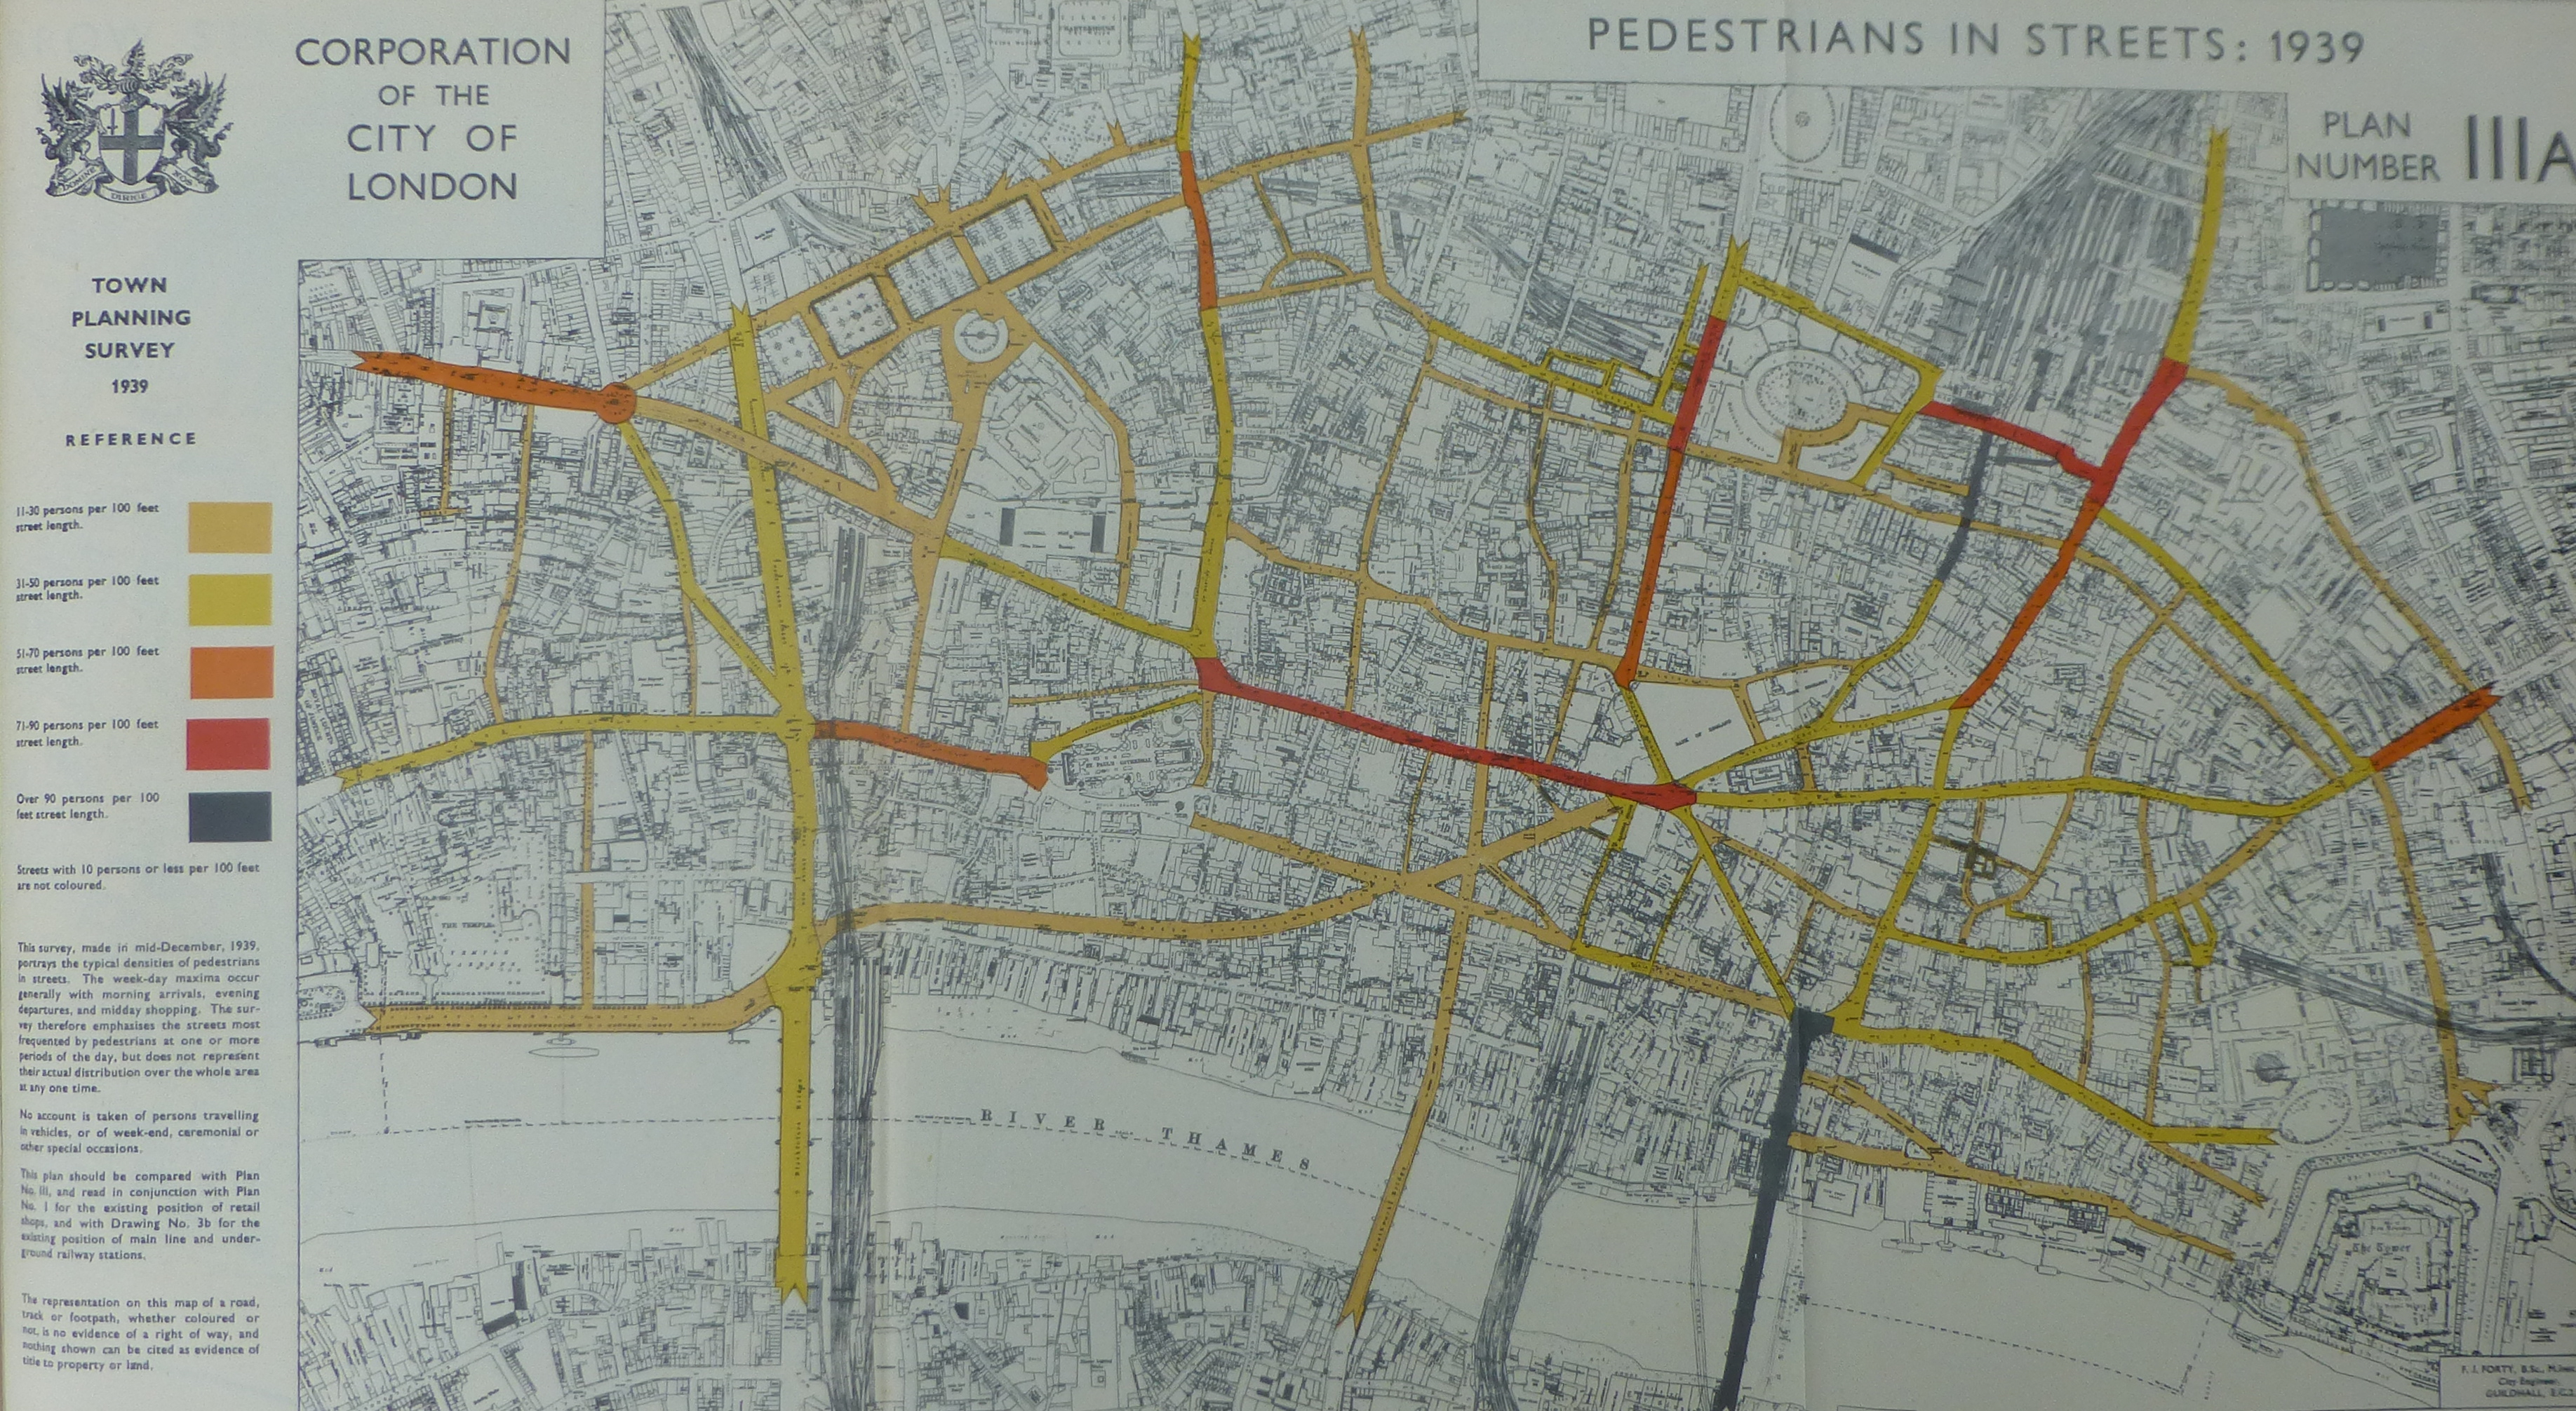
A survey in mid-December 1939 of typical pedestrian densities in the City resulted in the following map. Densities range from 11-30 persons per 100 feet up to 90 persons per 100 feet represented by dark grey. There are only two areas on the map with the highest density. One is across London Bridge and the other is from Liverpool Street Station down Old Broad Street, clearly highlighting the main routes for commuters to walk into the City.
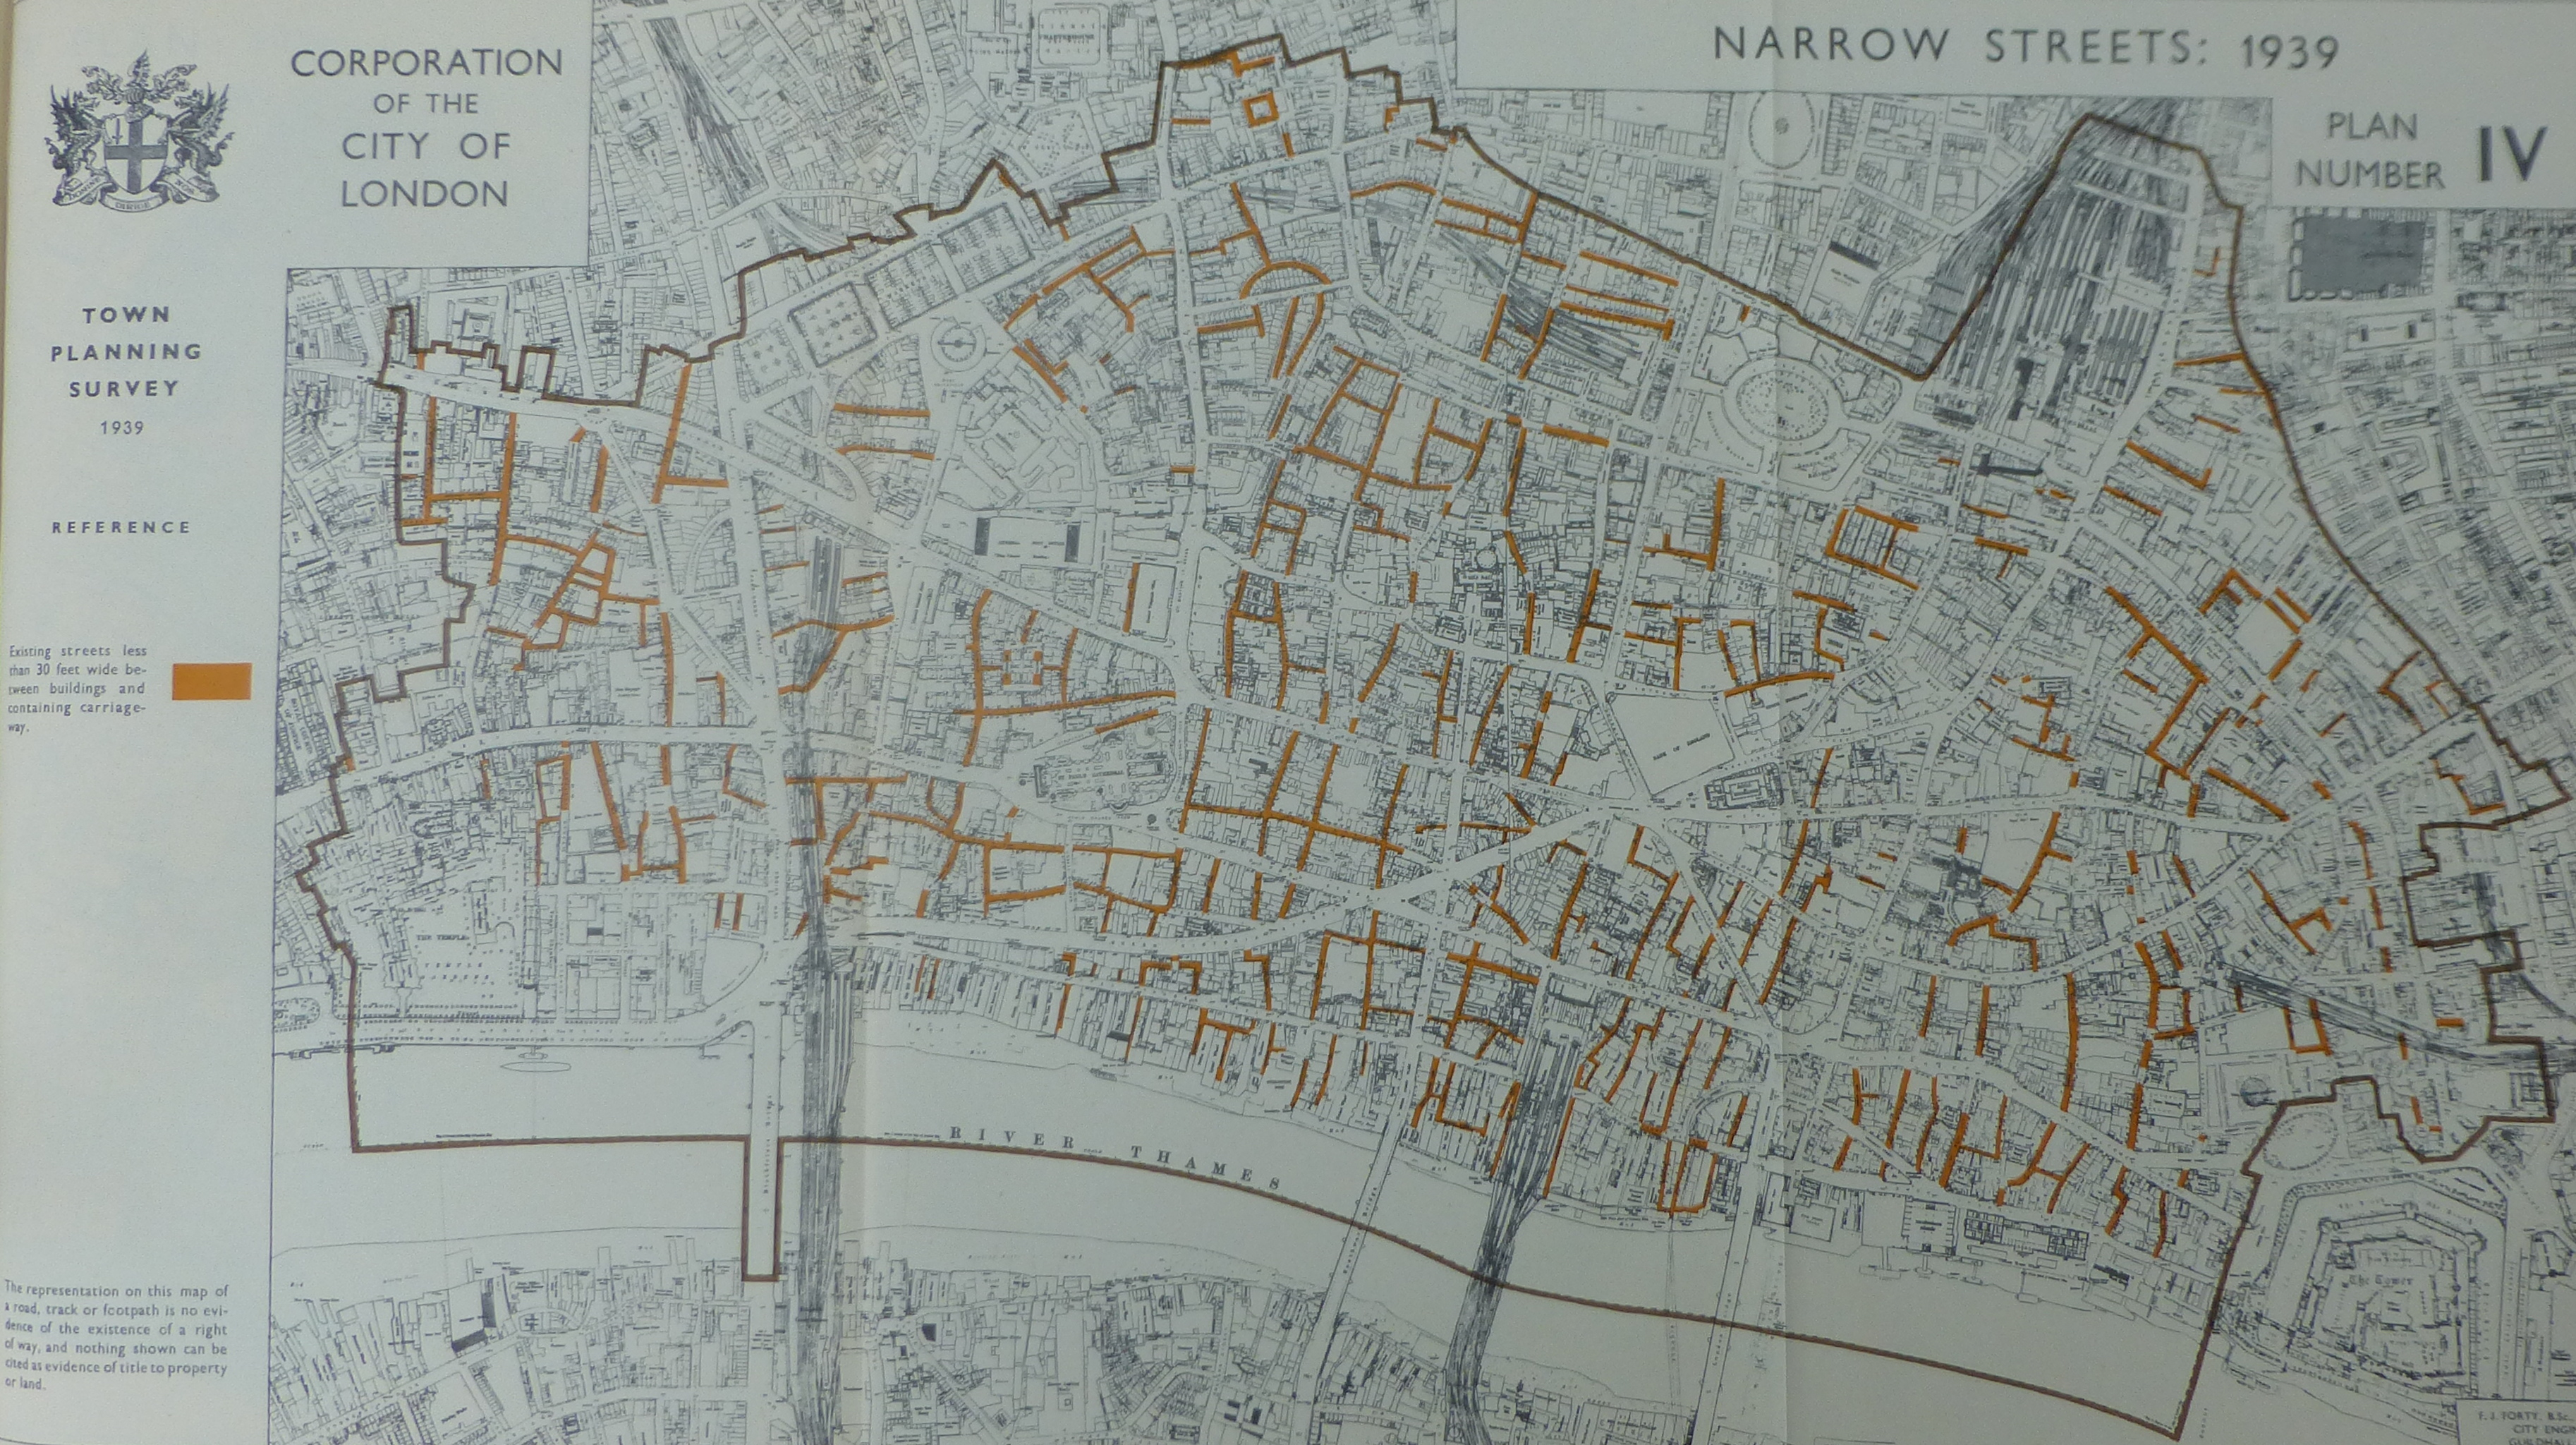
In 1939 there were still many narrow streets across the City. The following map shows streets of less than 30 feet wide between buildings and containing a carriage-way marked in orange.
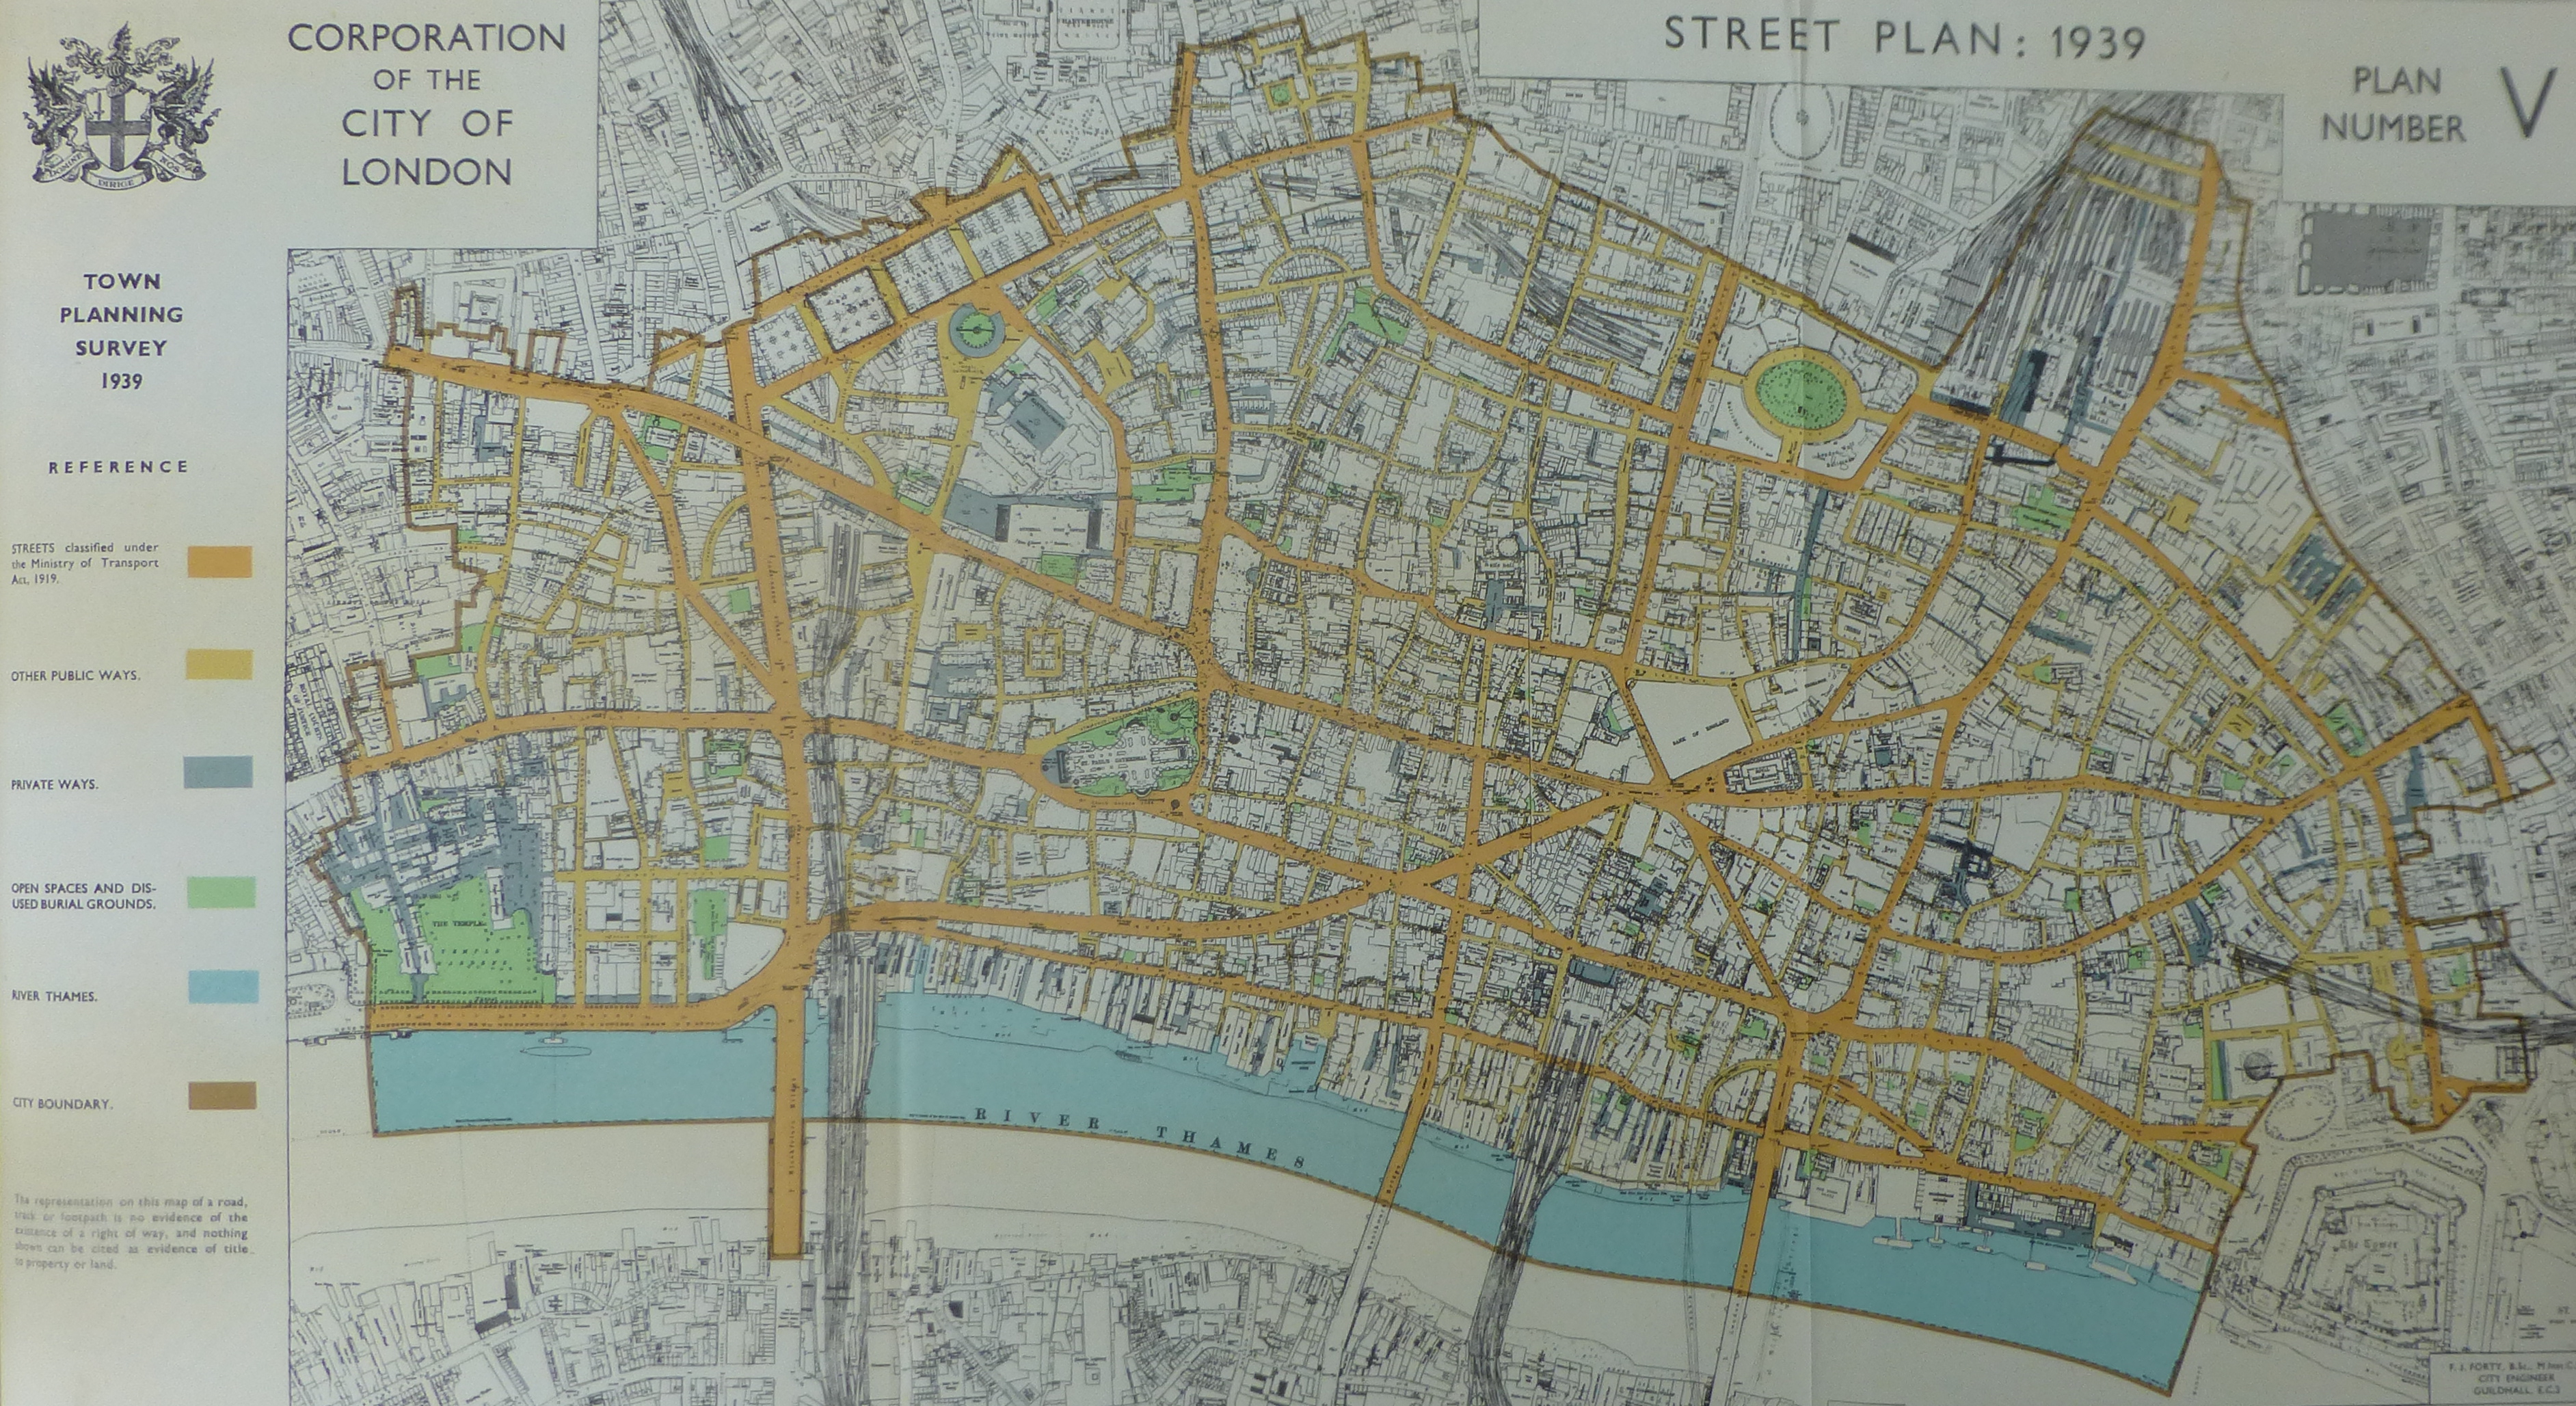
It would be very interesting to compare the following map with one with the same classifications today. This shows the street plan with street classifications, city boundary, open spaces and private ways.
Private ways are shown in a grey / blue colour – I suspect that there is very much more land classified as private way across the City today.
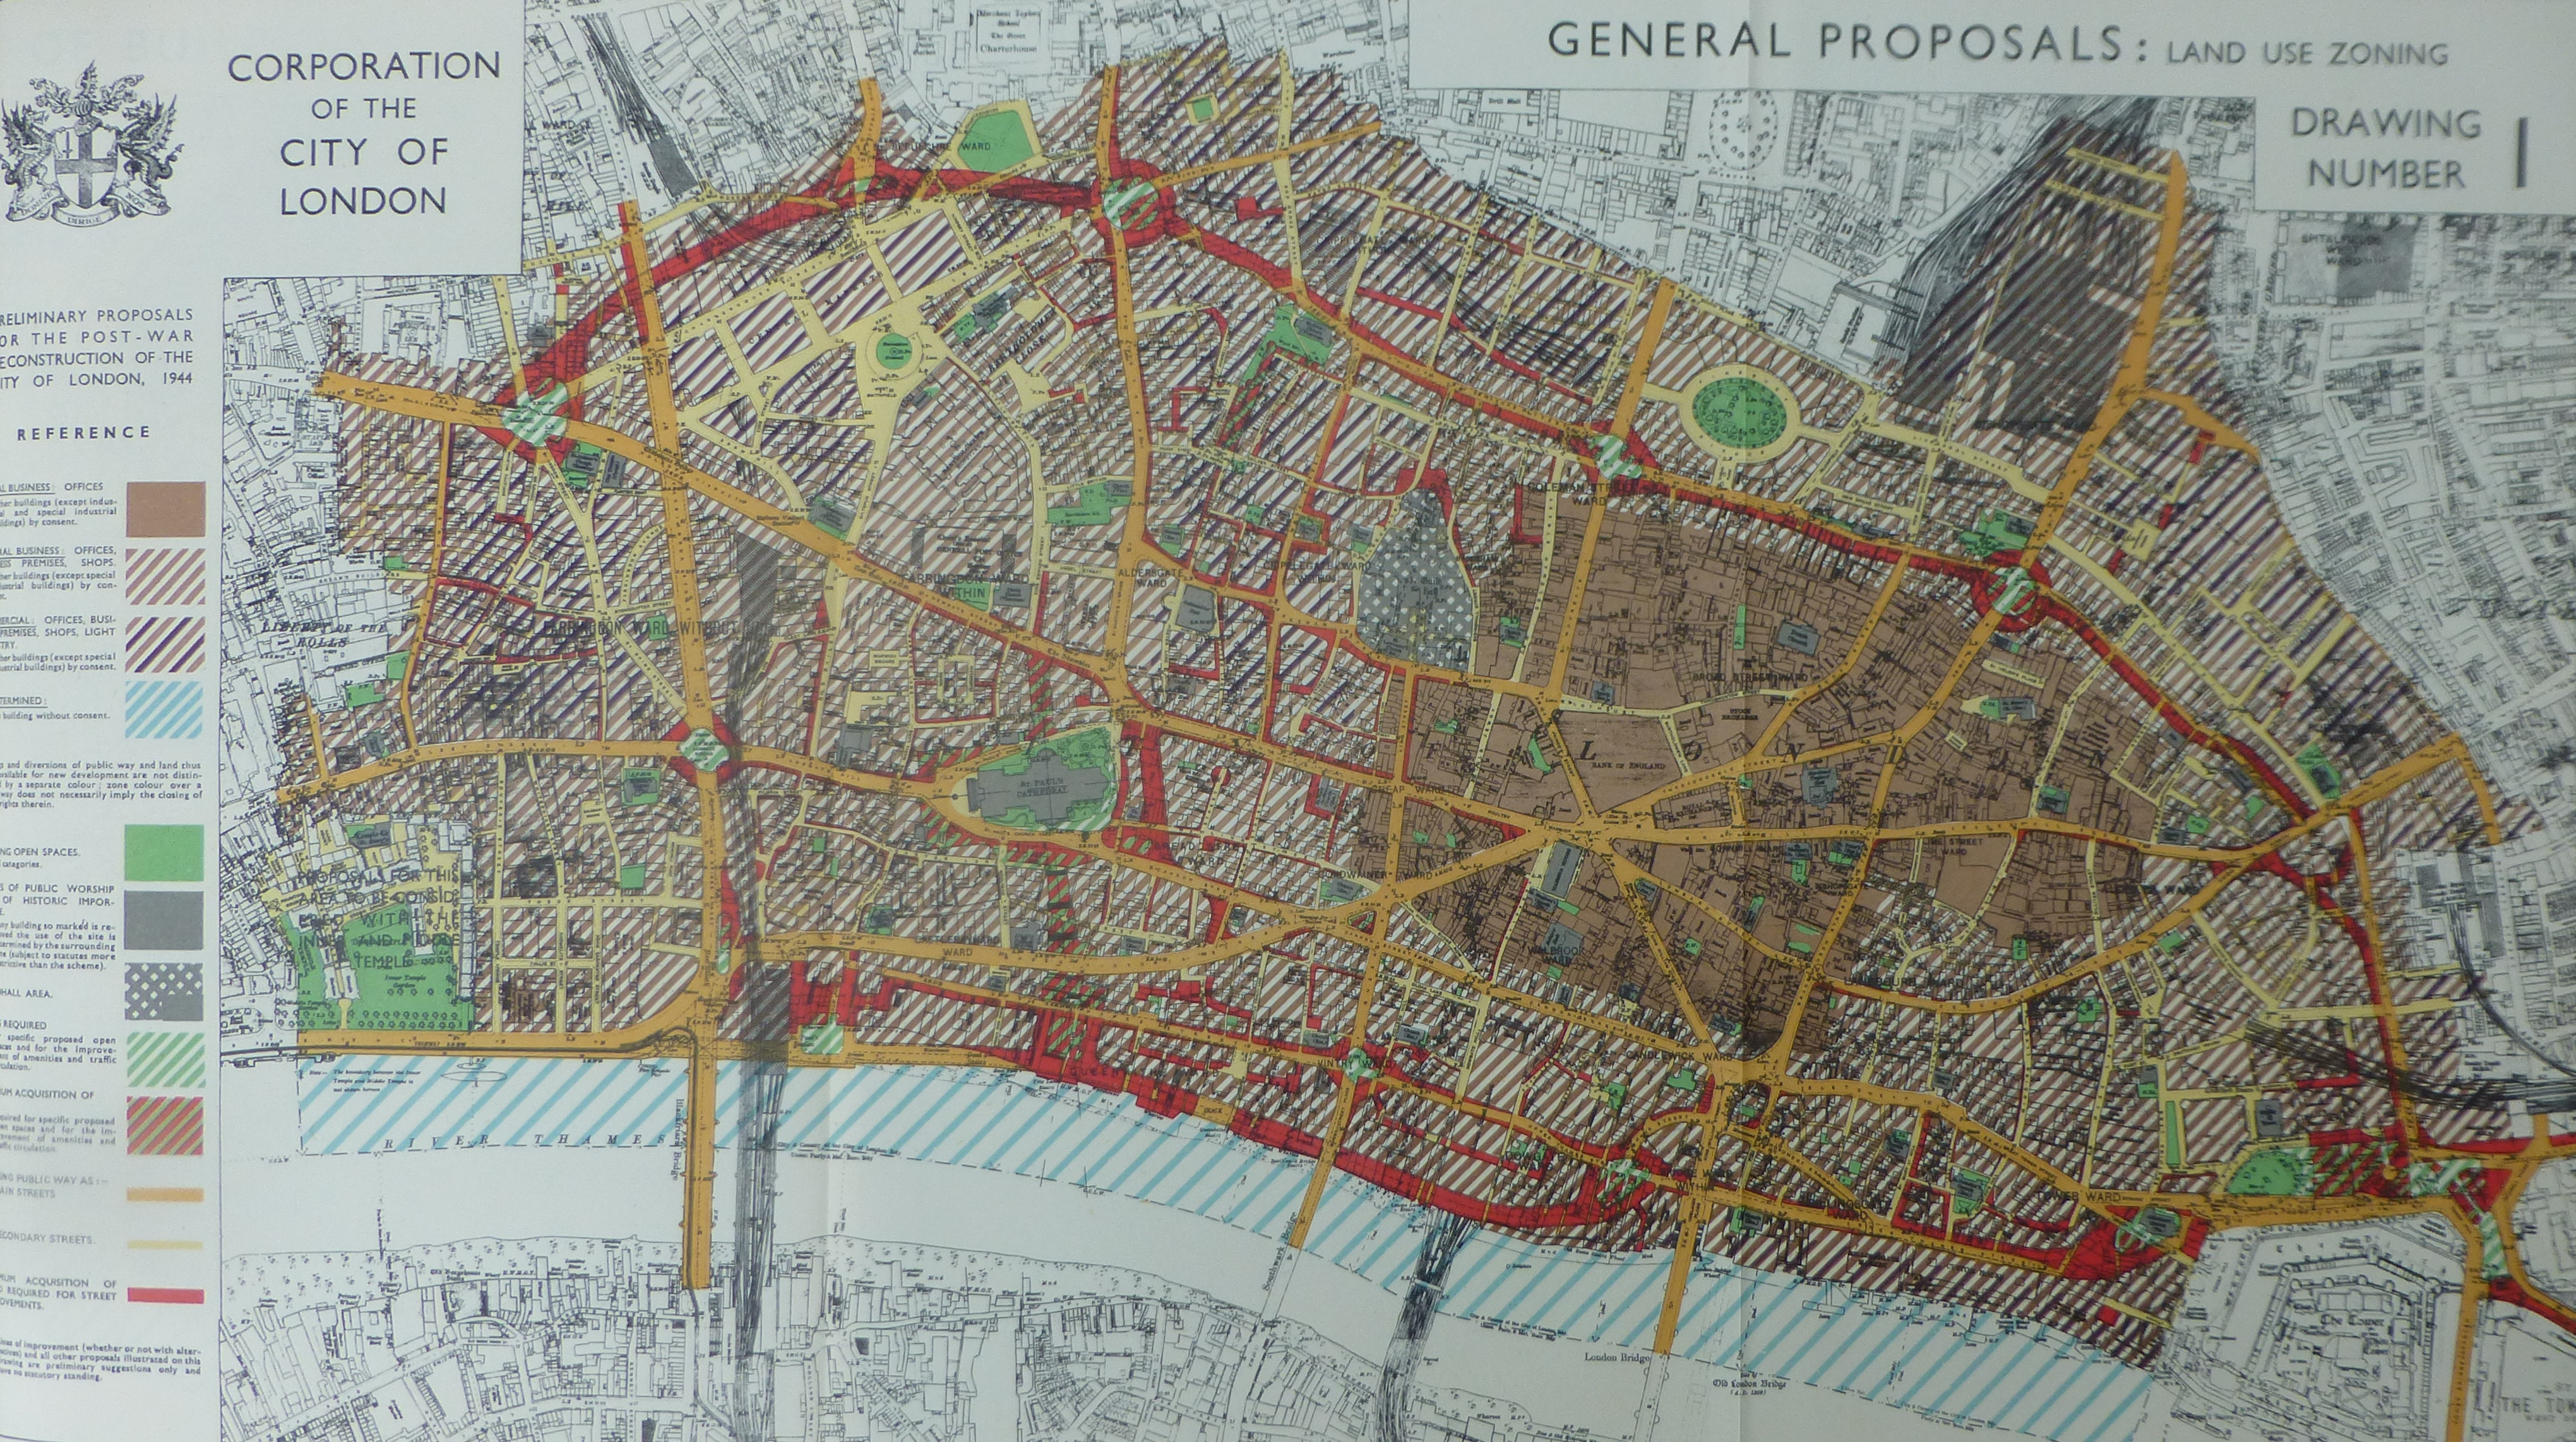
The following map brings together the “General Proposals for Land Use Zoning”. The core of the City, around the Bank of England is still allocated for offices with much of the rest allocated to General Business. The land marked in red is the “Minimum acquisition of land required for street improvements”.
There is also a map showing the “Height of Buildings Zoning”. I have shown below an extract of the map from around St. Paul’s as this shows the height limitations to maintain a view of the Cathedral from across the river. A height of 60ft raising to 80ft to maintain a clear view. The map text emphasises that this height is inclusive of architectural features so it really is an absolute height limit.

The final map is showing proposed “Traffic Circulation”. The roads marked in red are new, 80ft wide streets that would carry traffic around the City. This again shows the proposed extension of the Embankment from Blackfriars almost to London Bridge. Really surprising that this was considered as it would have considerably changed the river frontage along this part of the City and would have damaged the Queenhithe Dock which is now a scheduled monument under the 1979 Ancient Monuments and Archaeological Areas Act.
The map is also predicting the rise in car ownership and the resulting need for car parking. Eight green car symbols across the map indicate the possible siting of multi-storey garages.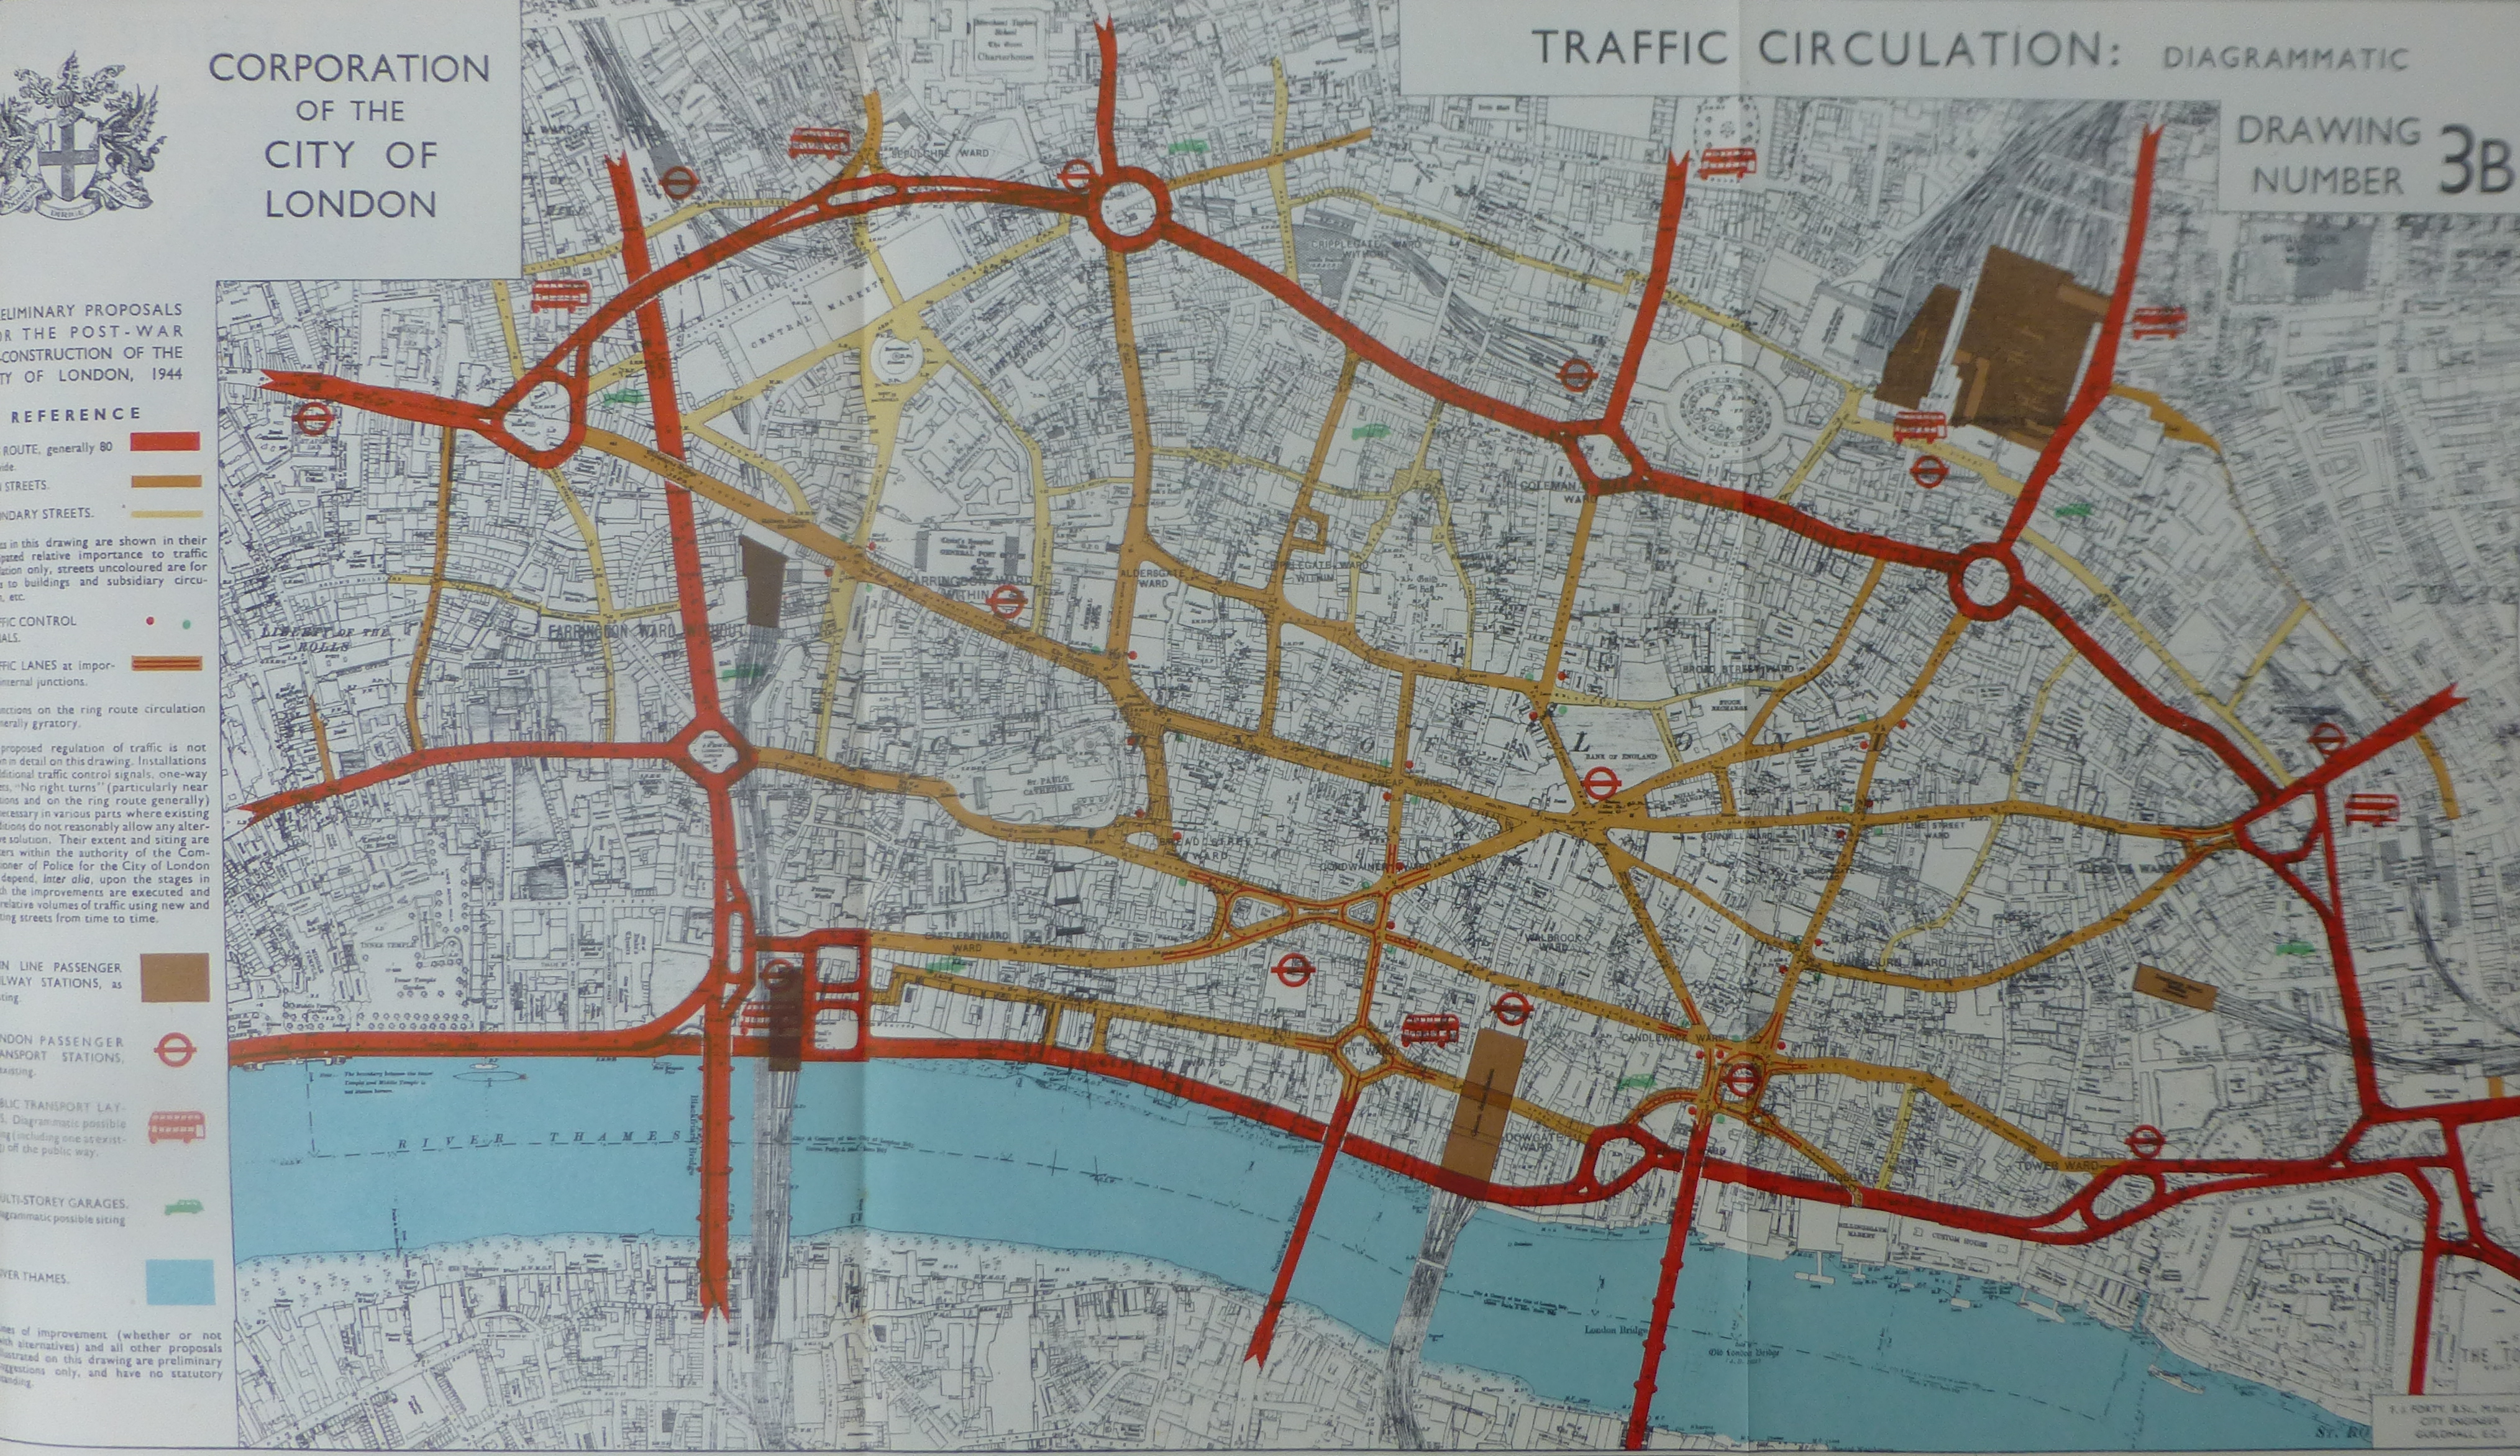
Many of the reports recommendations were put into place. The area around St. Paul’s Cathedral today looks very similar to the artists impressions. Buildings that originally ran up close to the churchyard have not been redeveloped and the Cathedral now has a much larger area of open space, particularly to the south and across to Bankside, to open up and protect the view.
Fortunately, the proposed extension of the Embankment to London Bridge did not take place. This would have dramatically changed the City’s historic waterfront. The report did mention this concern and also included suggestions such as a tunnel. In the event, Upper and Lower Thames Street were widened to provide a southern ring road around the City.
The working population of the City did not continue to grow and has since reduced due to the move of many typical City jobs east to Canary Wharf.
I suspect that many of the pedestrian densities are much the same today as they were in December 1939 with large numbers of people continuing to walk across London Bridge and into the City from Liverpool Street Station.
The report makes fascinating reading and I hope to cover more in the future. The maps shown above are just a sample and for these alone, the report is a remarkable document.
Excellent article, thank you! I’ll be returning to it again, I’m sure.
Thanks for putting these unique maps & evocative illustrations online, David ~ & making it possible to enlarge them. I think you’ve rendered a public service!
I find the psychological aspect of planning for the future in the middle of a war quite fascinating, but didn’t know that the City had a counterpart to Patrick Abercrombie’s County of London Plan (1943) & Greater London Plan (1944).
This is a tremendous collection of resources that you have compiled, David. As a geography graduate (we are now talking ancient history here) I used to pore over maps of many types and never tired of reading them – often better than a book! I take my hat off to you with this blog. It’s a resource which I will consume over the weeks to come and, no doubt, will return to as a resource in future (make sure it stays on-line!)
Thank you
I have only just found time to revisit this today and even now I can’t take it all in!.
The illustrations are marvellous, never mind the content. I can see I will return to this often
Sitting here explaining to my 12 year old daughter about this book and the version I have in my own hands, which is a or the original final draft, somewhat handmade and with instructions on the front for final finishes! Great historical snapshot!
thank you for publishing this. As I understand it, my great uncle Claude Dennis chaired the committee charged with creating this report. At least it said that in the signed copy we once had, gifted from Claude to his brother.. in the meantime your excellent site is deeply appreciated. Luke above seems to have a special edition, which is fantastic.
Thanks again for publishing this, Iain