One of the strangest headings I have used for a post, however, this was the title of a wonderful booklet published in 1945, where Edward Julian Carter (Librarian of the Royal Institute of British Architects) and Erno Goldfinger, (the architect of buildings such as the Balfron Tower in Poplar), explained the London County Council, 1943 County of London Plan.
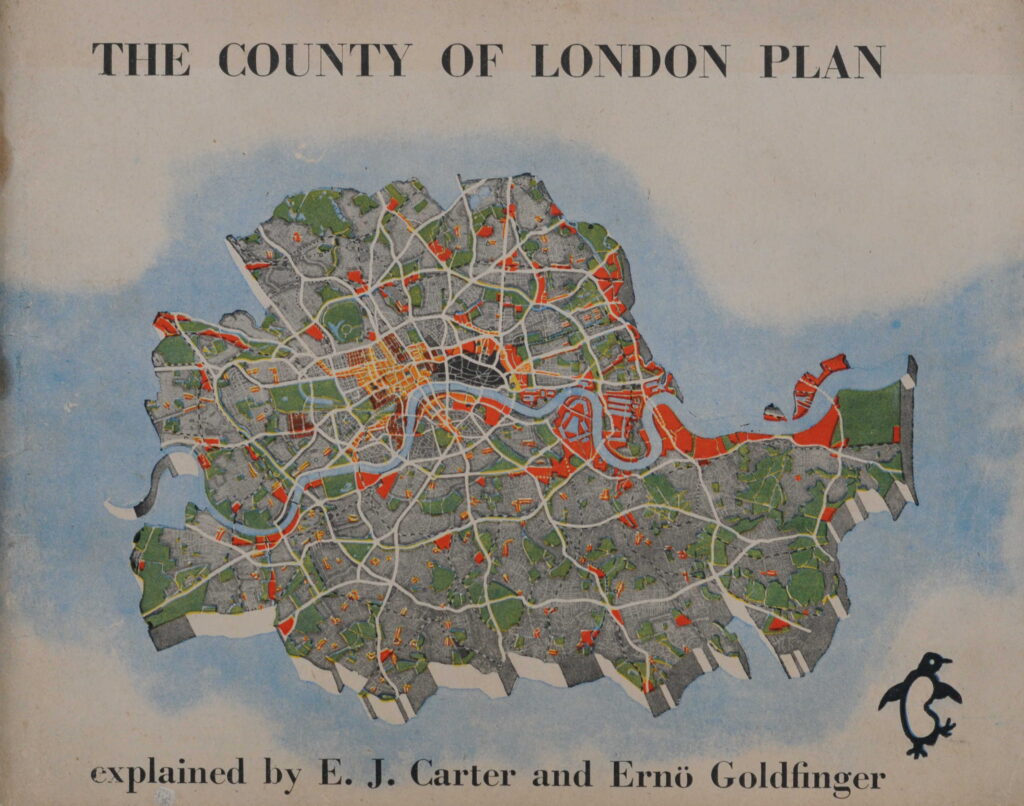
The idea for a County of London Plan came from Lord Reith, the Minister of Works and Planning. In 1941 he asked the London County Council to prepare a plan “without paying overmuch respect to existing town planning law and all the other laws affecting building and industry but with a reasonable belief that if a good scheme was put forward it would provide reasons, the impulse and determination to bring about whatever changes in law are needed to carry the plan into effect”.
The County of London Plan was published in 1943, and provided a view of what the city could become after the devastation of wartime bombing.
As is always the way with long term plans, many of the recommendations were not implemented. Money was a considerable post war problem, many changes were long term, and in the decades following the 1940s, changes not foreseen by the plan, such as the exodus of industry from the city and the closure of the docks, would result in a new approach to city planning.
The impact of the County of London plan can though be seen across London today, with, for example, the South Bank being the combination of cultural (Royal Festival Hall, National Theatre etc.), gardens (Jubilee Gardens), office (IBM) and housing recommended by the plan.
The 1945 booklet by Carter and Goldfinger was an attempt to provide a concise view of the plan in a more readable format, and to get the buy in from Londoners to the future of their city as proposed by the plan.
Trying to get the support of Londoners for the plan did though display a bit of “central authority knows best”, as shown by the following two sentences from the introduction to the plan in the booklet:
“So when the L.C.C. plans for London it is not merely planning these things in an abstracted way for Londoners; it is London’s own people through their own democratic government planning themselves”, and;
“The Plan was generated by the people of London and created by architects and planners aware of what the people want. Now it is before the people for them to turn it into reality”.
There is no indication in the booklet how architects and planners were aware of what the people wanted, however the booklet does highlight many of the problems experienced by people living and working in the city.
The booklet was published by Penguin and cost 3 shillings and 6 pence. It would be interesting to know how many Londoners actually purchased and read the booklet.
As with the County of London Plan, the booklet makes some brilliant use of diagrams, what we would today call infographics, use of colour, and plenty of maps, including a wonderful fold out map at the end of the booklet.
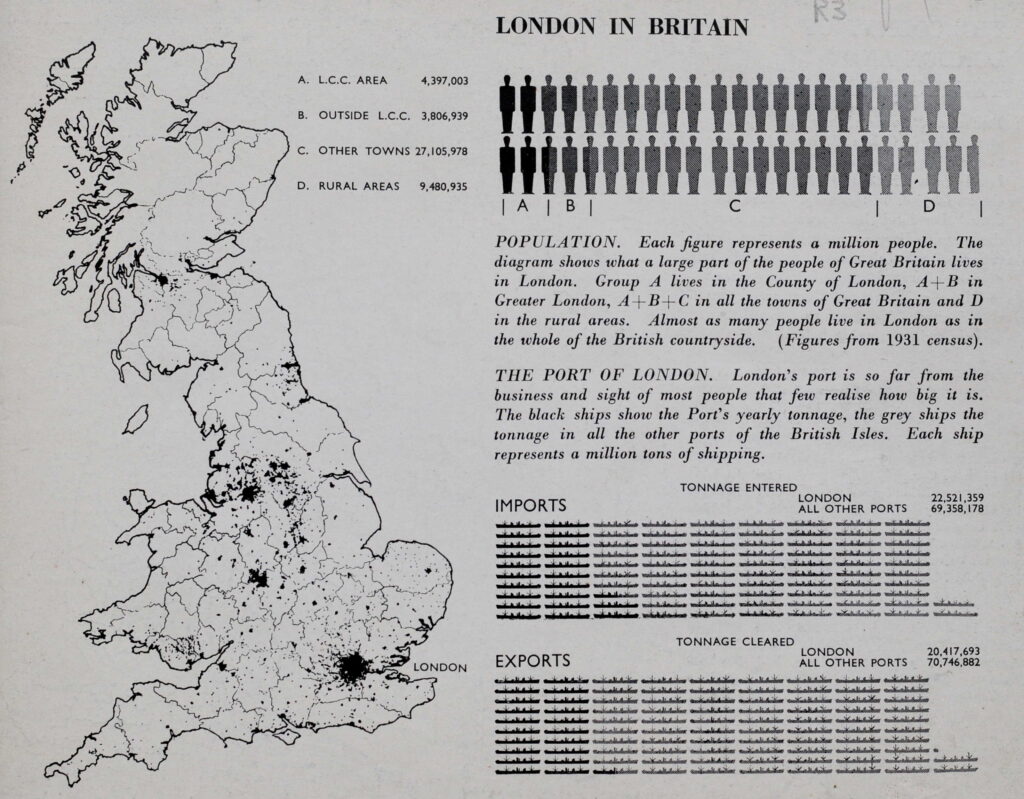
The booklet starts by positioning London in Britain, including that London’s population was almost equal to the number of people living in the whole of the British countryside, as well as the significant percentage of imports and exports that went through the city’s docks.
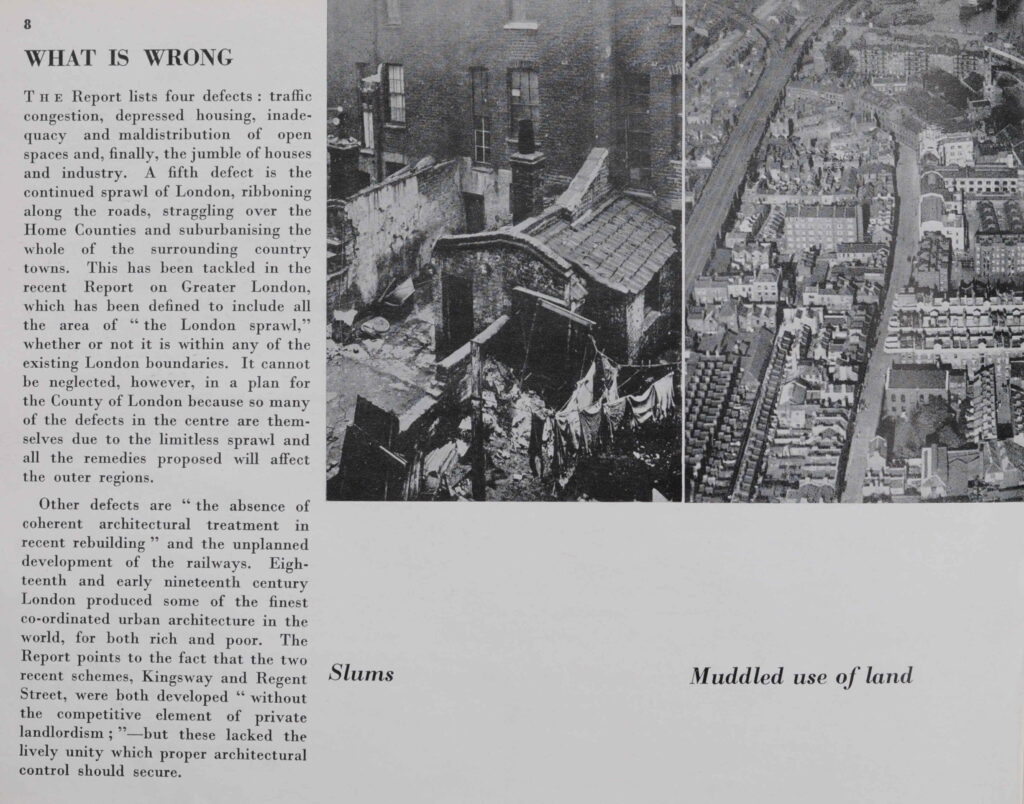
The booklet identifies a number of themes under “What is Wrong”, which includes traffic congestion, depressed housing, inadequacy and maldistribution of open space and a jumble of houses and industry. Another problem is the sprawl of London, with ribbon development along the roads leading to the counties surrounding London, an approach which would gradually leads to urbanising the countryside.
The report illustrates five of these problems. Slums and the Muddled use of land:
A lack of open space, traffic problems and architectural squalor:
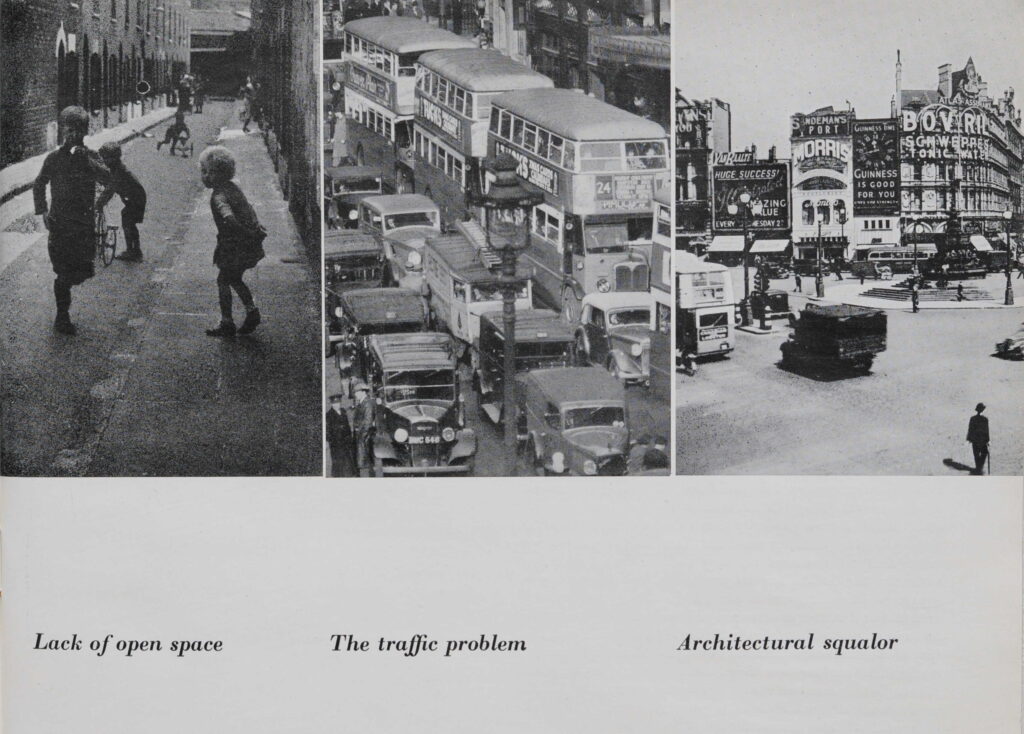
Interesting that the book identifies the “absence of coherent architectural treatment in recent building”. A problem that still exists and demonstrated by the towers that are descending on Vauxhall at the moment.
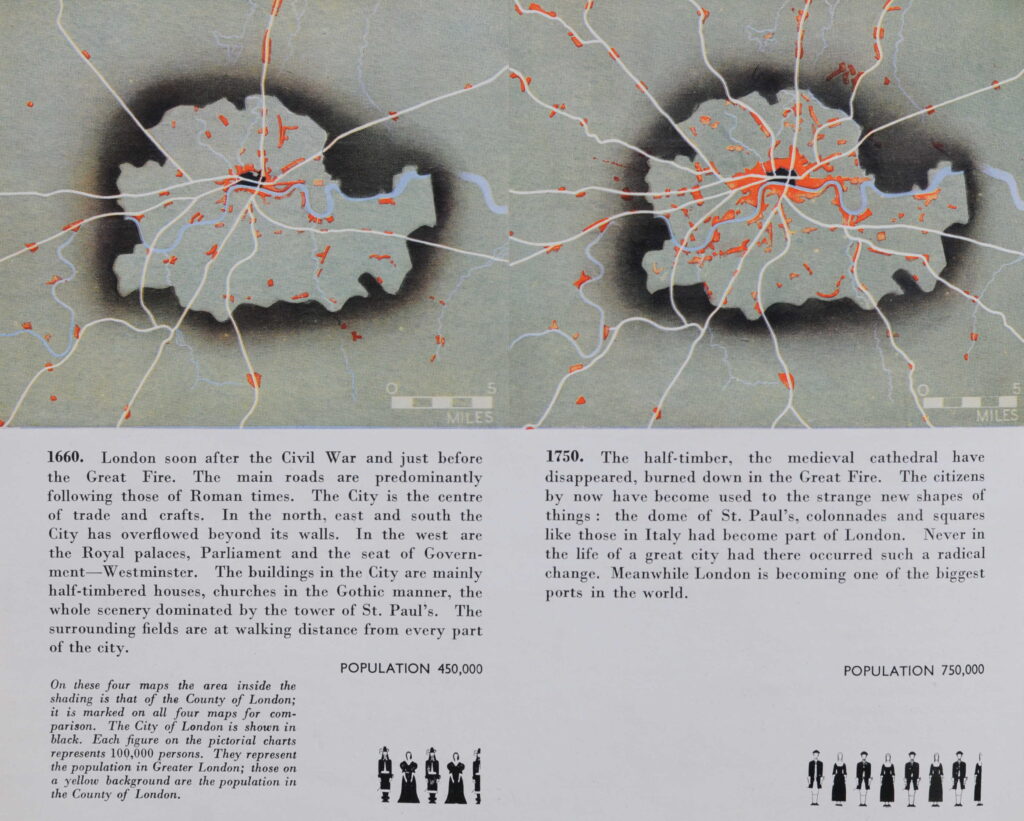
The booklet reviews the growth of London, from 1660 when the city had a population of 450,000:
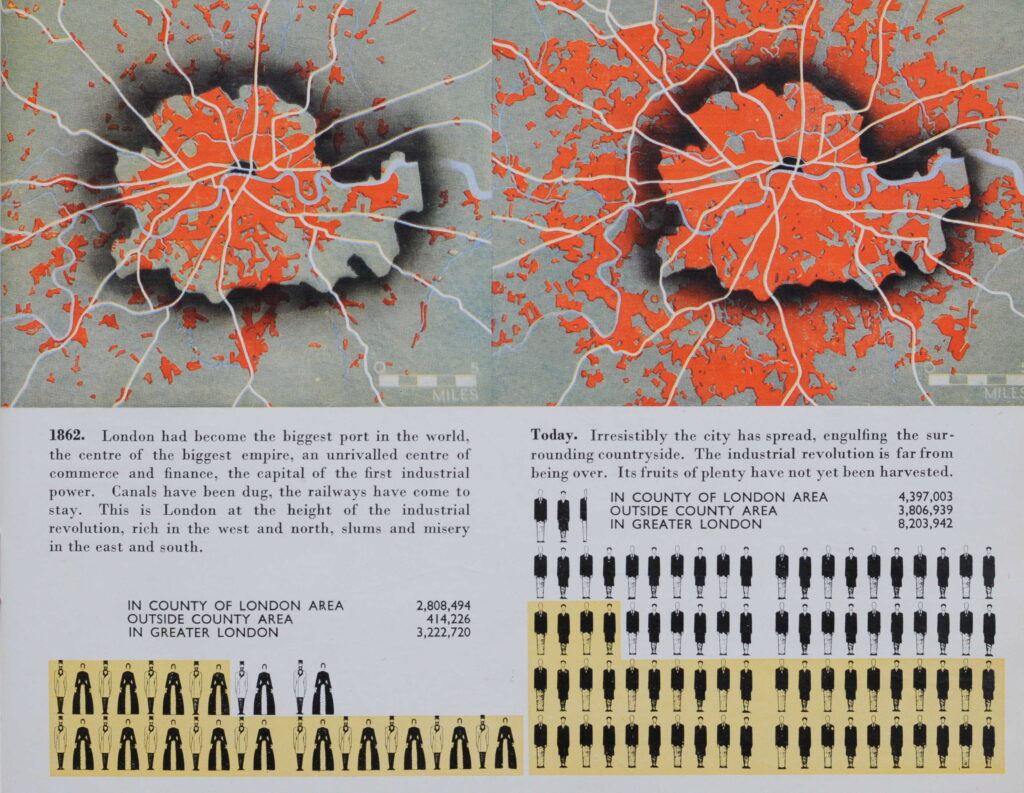
In 1862, population estimates now include the County of London area, as well as outside the County area to provide a view of the population of Greater London which was 3,222,720 in 1862 rising significantly to 8,203,942 by the time of the report:
The booklet shows some of the data that was used in the County of London Plan to develop the plan’s proposals. The following diagram shows Family Grouping in London, with the number of people in family groups for a sample size of 100 families.
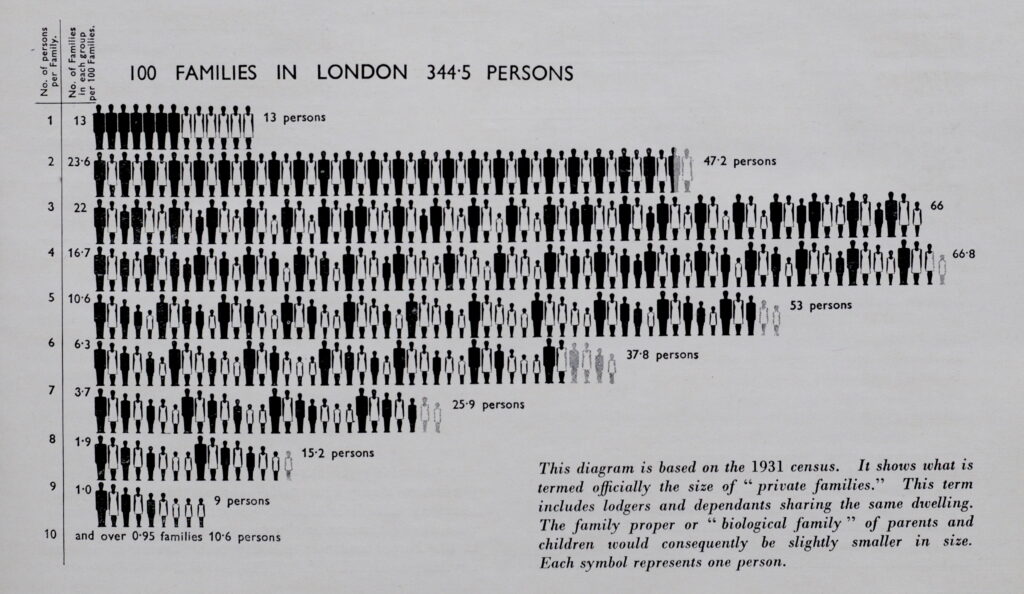
The above diagram was based on the 1931 census, and shows that the highest numbers of families were in the size of three to five persons per family (which also included lodgers and dependents).
This was not so different to the late 19th century. When I looked at the 1881 census data for Bache’s Street (see this post), the average number of members of a family was 3.15, however this figure hid the real problem of houses of multiple occupancy where more than one family would occupy a single house.
Blocks of flats would be a key feature of post war housing development, the booklet goes some way to explaining why this approach was taken.
In the following diagram, the heights of blocks are shown, the height is used to determine the spacing between the blocks.
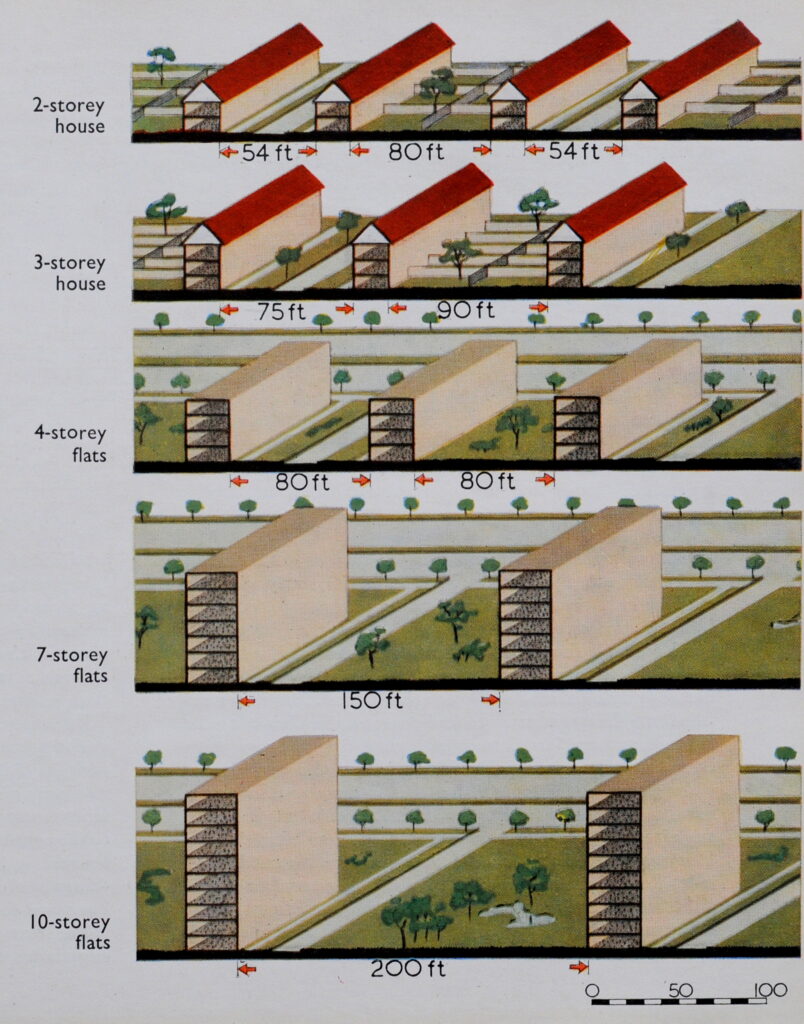
Whilst smaller, 2-storey houses can have their own garden, this arrangement does not give any land over for public gardens, and will require longer roads.
The justification for larger blocks of flats was the large amount of public open space that could be provided, along with uses such as allotments, with very little space wasted for roads.
Whilst the booklet does recognise the lack of private gardens, it does not really appreciate the impact of high rise living, and that large areas of public open space can become a bit of a windswept wasteland if not carefully managed.
The problem with London was the limited amount of space available for everything that could be expected to be included within the city. Homes, schools, factories, shops, public buildings, offices, roads, railways and services for visitors.
The definition of the County of London for the 1943 plan resulted in an area of 74,248 acres available for every use London was expected to support.
This resulted in some serious decisions on population densities, which again influenced the house / flats discussions.
The following diagram shows the different combinations and their resulting density of people per acre:
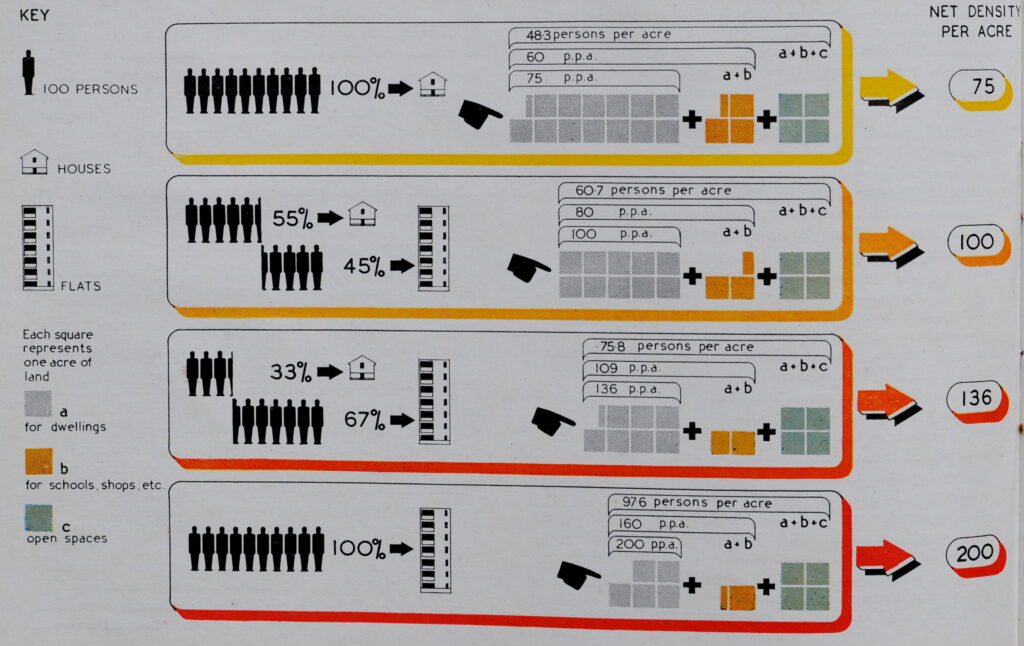
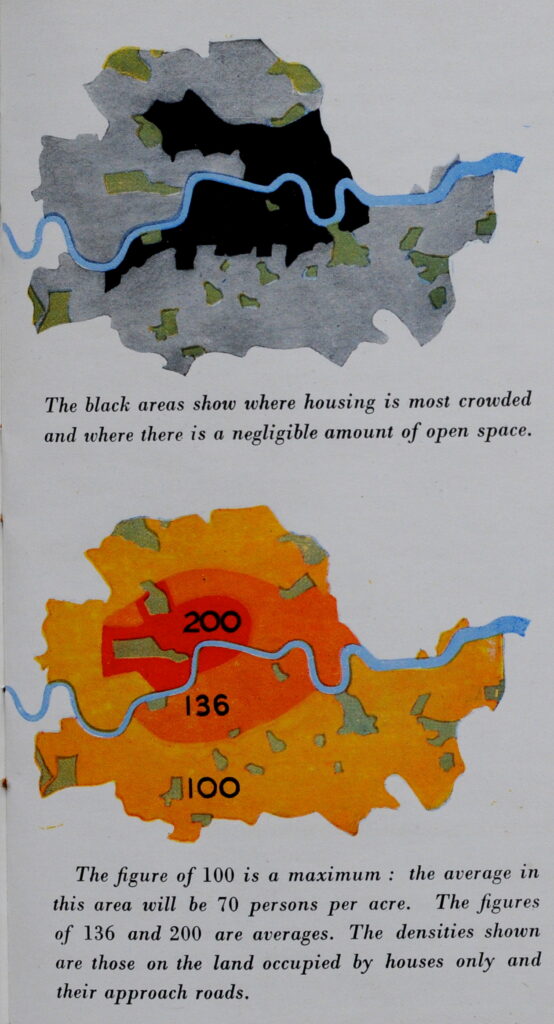
However, even achieving these population densities would cause rehousing problems. Open space was also a consideration as many areas of London had very little public open space. The upper map shows the areas of London where housing is most crowded and there is a negligible amount of open space:
The lower map shows the target population densities defined by the County of London Plan.
The central area would have the highest population density of 200 people per acre, however this figure was much below many areas of London which had densities up to 360 people per acre. This would require the challenge of rehousing and averaging out population densities if a reduction was to be achieved.
As well as housing, London at Work was a key consideration of the plan. At the time of the plan, an estimated 2,990,670 people was employed in Greater London.
The trade with the most people was the Distributive Trades with 563,540, followed by Engineering and Metal Trades at 443,380 and Building and Public Works Contracting at 280,440.
Interesting that the majority of people were involved in some form of manufacturing industry. We tend to think that the city had always been a centre for finance and the professional and service industries, however the report listed 55,360 people in Finance and Commerce, 71,080 in Professional Services and 184,170 in Hotels, Restaurants, Club Services etc. Today, I suspect the numbers for manufacturing and those for the finance, professional and hotel services have swapped.
The booklet includes a map showing the built area of London, with the division of industrial and built areas:
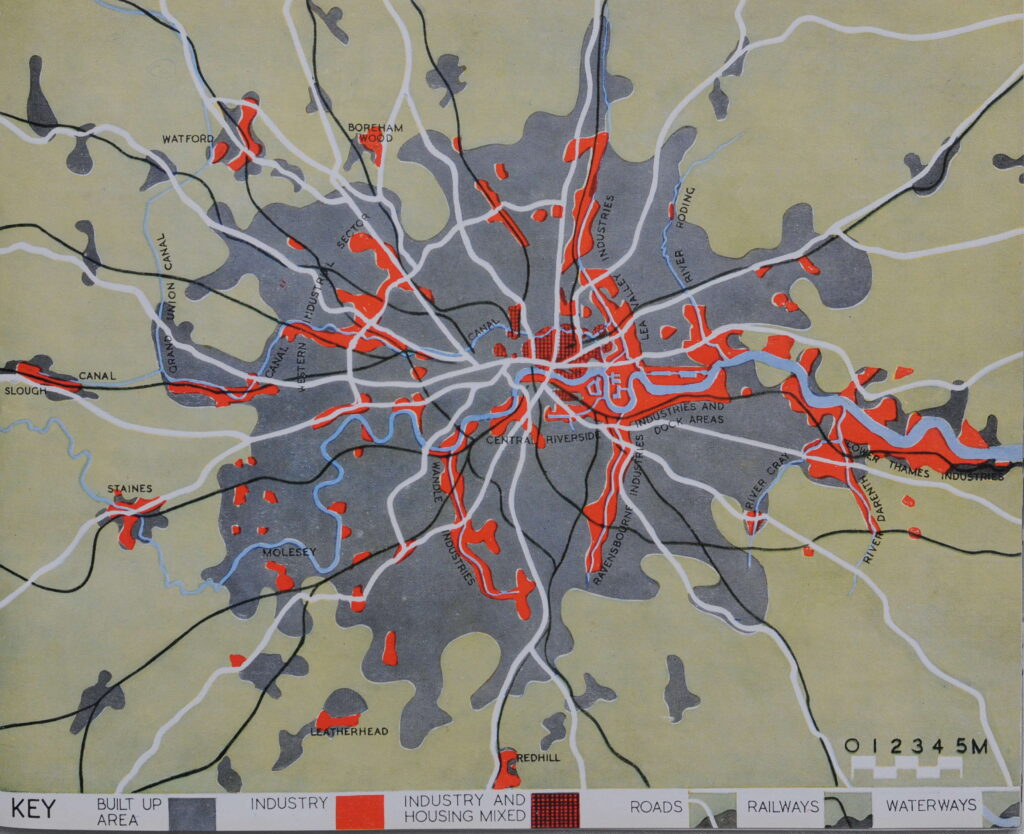
What is interesting is how the growth of industry has followed the rivers of London. Not just the Thames, but the Lea in east London, and if you look in south London, the string of industry along the Ravensbourne and Wandle.
The following map shows the future locations of industry and commerce proposed by the plan. Red being industry and Yellow for Commerce.
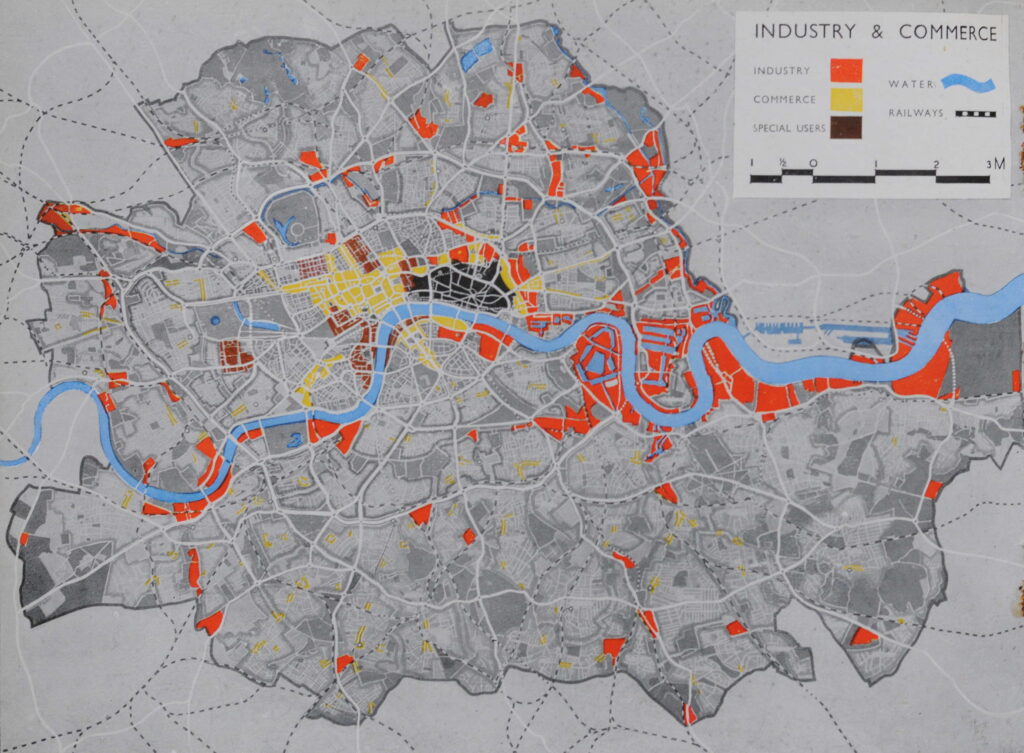
National Government focused on Westminster, Local Government on the South Bank (County Hall), Law to the west of the City, Bloomsbury being the centre for University education and Kensington being the location for museums.
The County of London Plan was concerned with the lack of public open space. During the 19th century London had grown exponentially, with industry surrounded by dense housing estates and very little land available for those living in the city. Whilst to the west there were the Royal Parks, the east of the city was very poorly served as illustrated by the following map, where the dark area indicates areas deficient of open space:
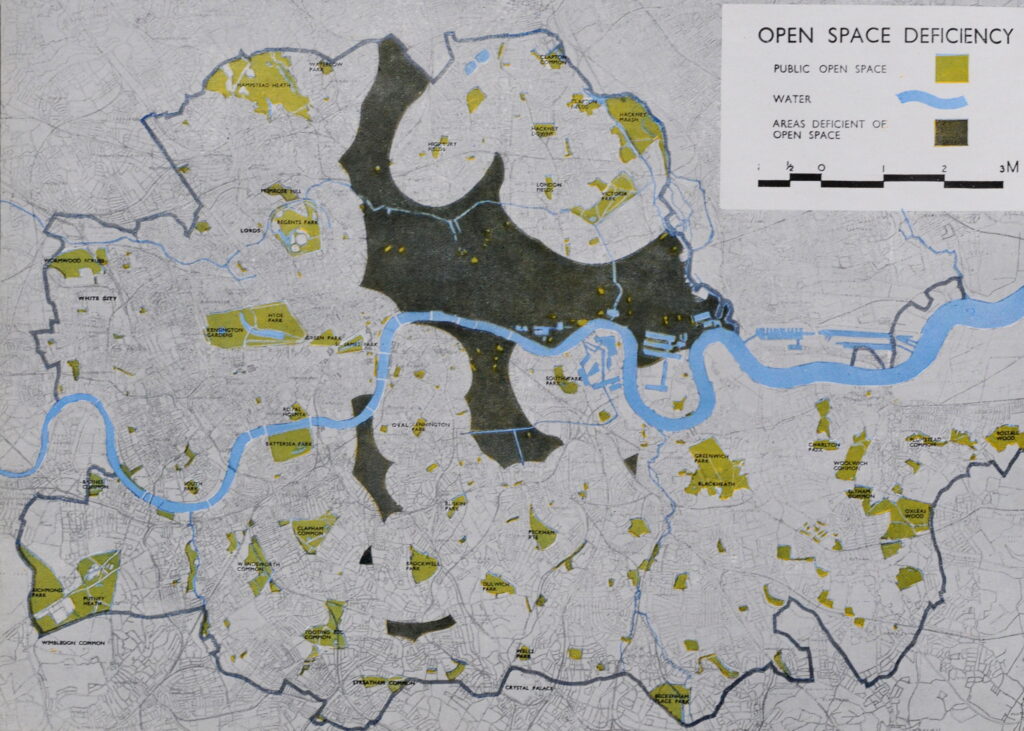
The County of London Plan proposed a system of new parks, mainly in the east and south of the city as shown in the following map:
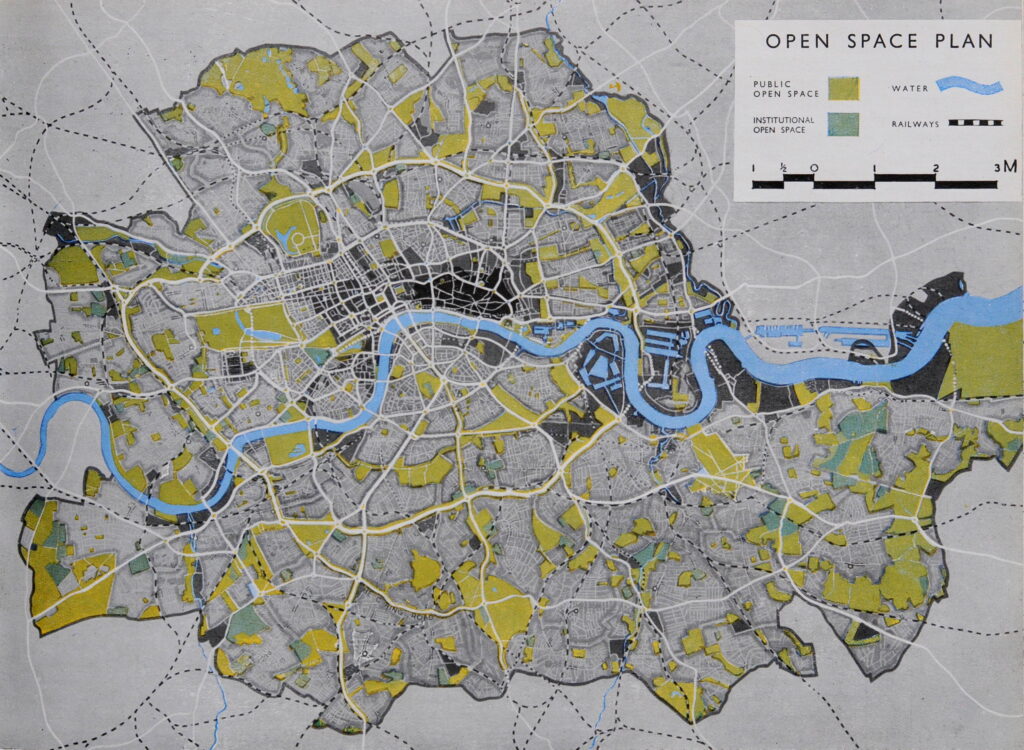
It would be interesting to compare how many of the sites marked in the above map are open space today (adds projects to ever increasing list of things to write about).
The growth in traffic was a key consideration of the County of London Plan. The post war growth in car and lorry traffic was a theme of the majority of post war city development plans. The City of London’s plans proposed dual carriageways through the City (of which the section of London Wall between Aldersgate Street and Moorgate was one of the very few sections to be built, along with underground car parks and raised pedestrian ways.
The County of London Plan offered a desperate view of what could become of the city if measures were not taken:
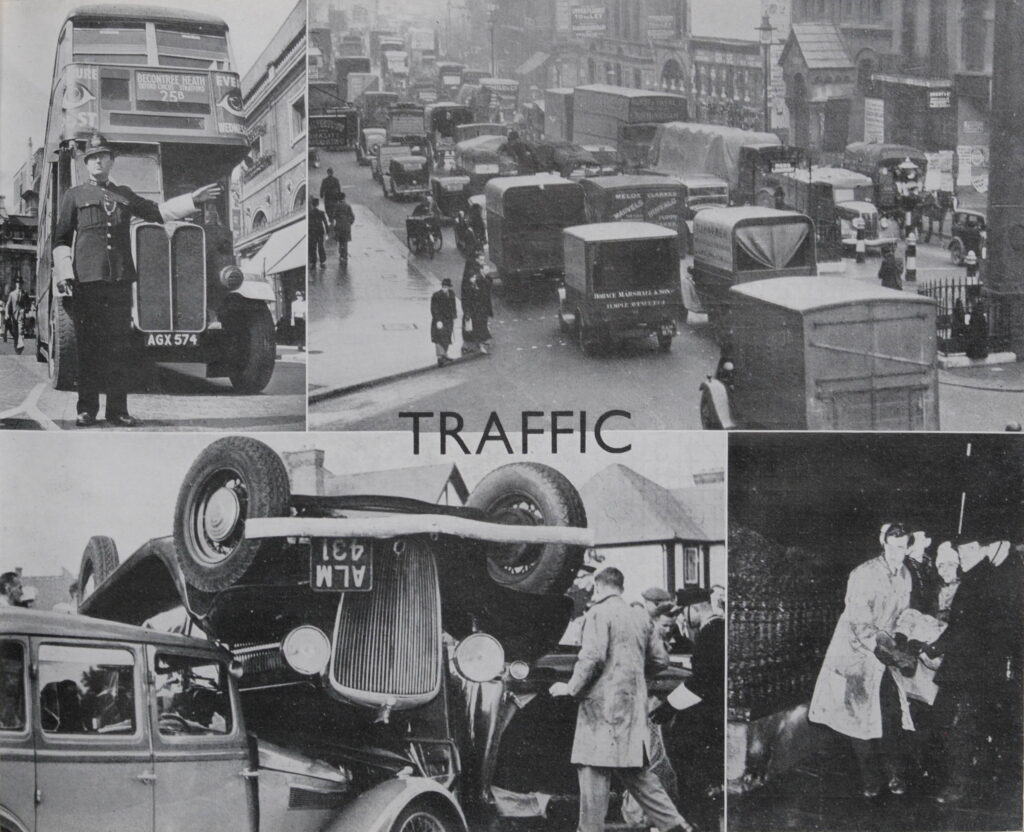
Pre-war, many of the city’s streets were not designed to support the expected volumes of vehicle traffic, or the speed at which these vehicles were expected to travel – much faster than the horse drawn transport of previous centuries.
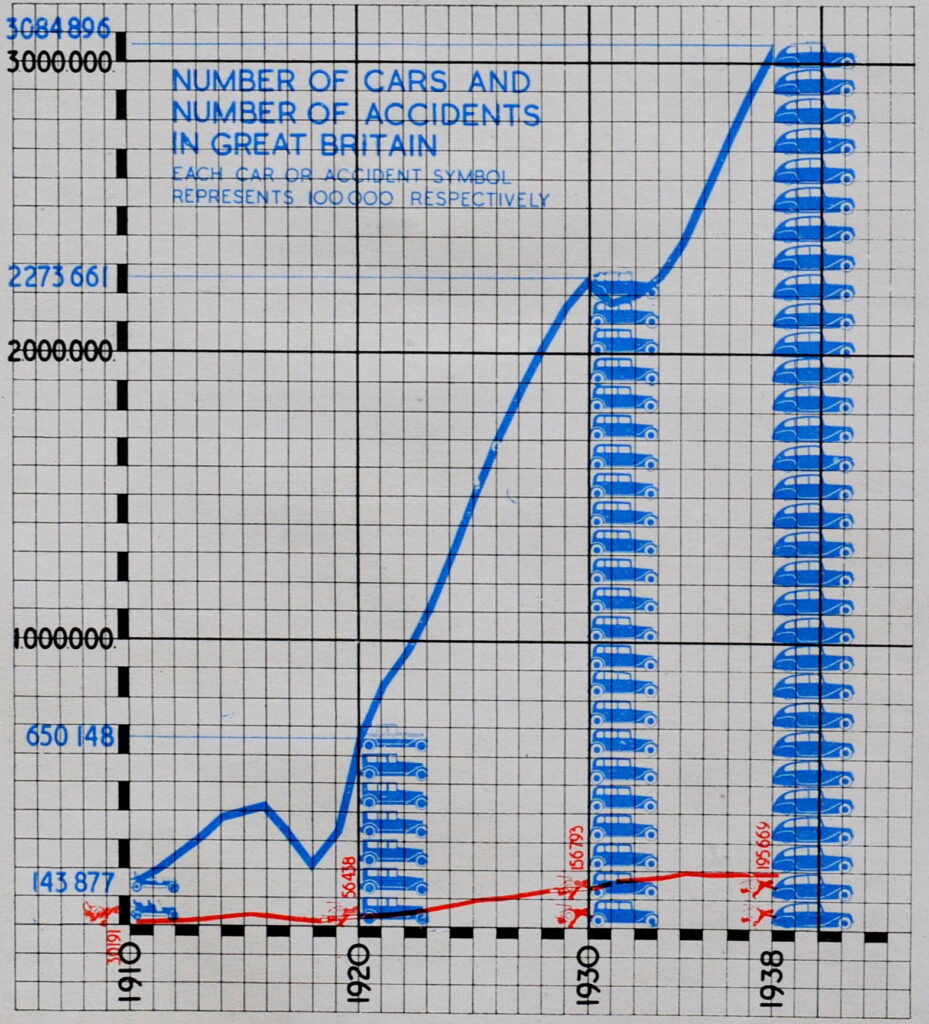
This was illustrated by the increasing numbers of cars in the country up to 1938 (blue) along with the increasing number of road traffic accidents (red):
To address the problem, the County of London Plan proposed a series of arterial and ring roads that would help take traffic from the smaller surrounding roads, and speed this traffic to their destinations. The following map shows the proposed new roads on the south-east of London, marked in red:
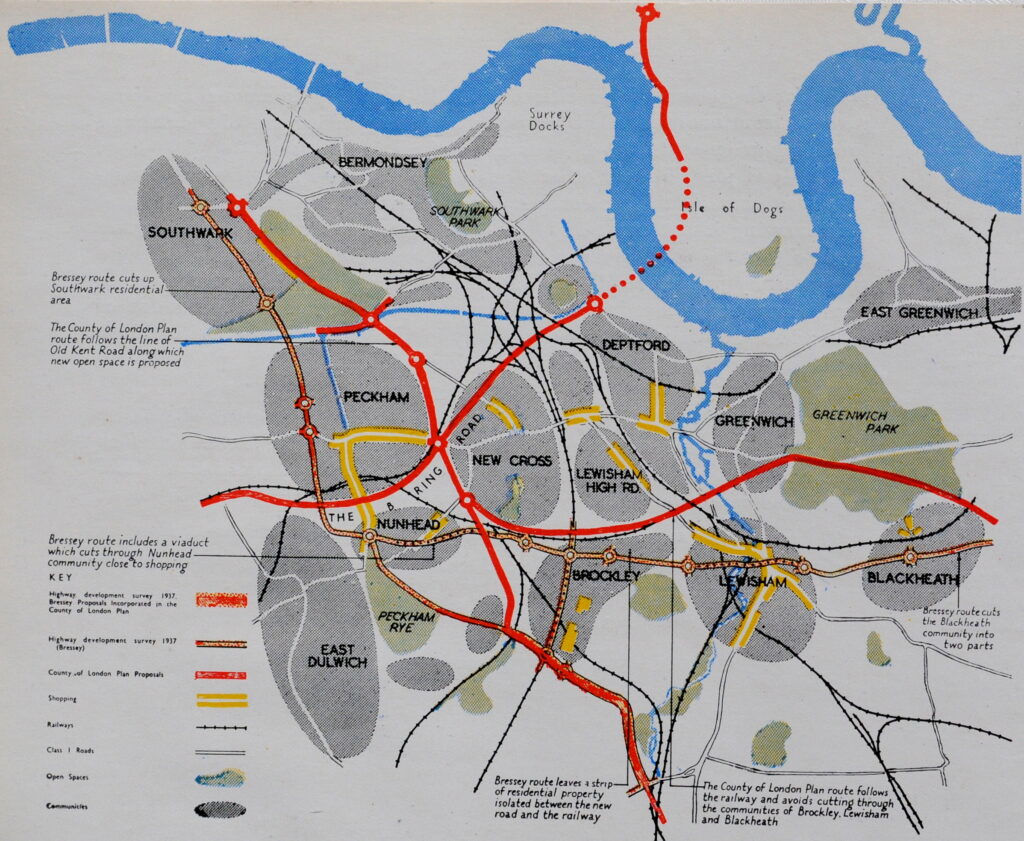
Note the intention for a new road to the west of the Isle of Dogs, that would cross under the river to the south of London. Many of these plans would not be built, or would be built along different routes.
The route through the Isle of Dogs was part of an inner arterial road that would ring the city. The following map shows this road, along with the arterial roads that would connect this ring road out to the rest of the country.
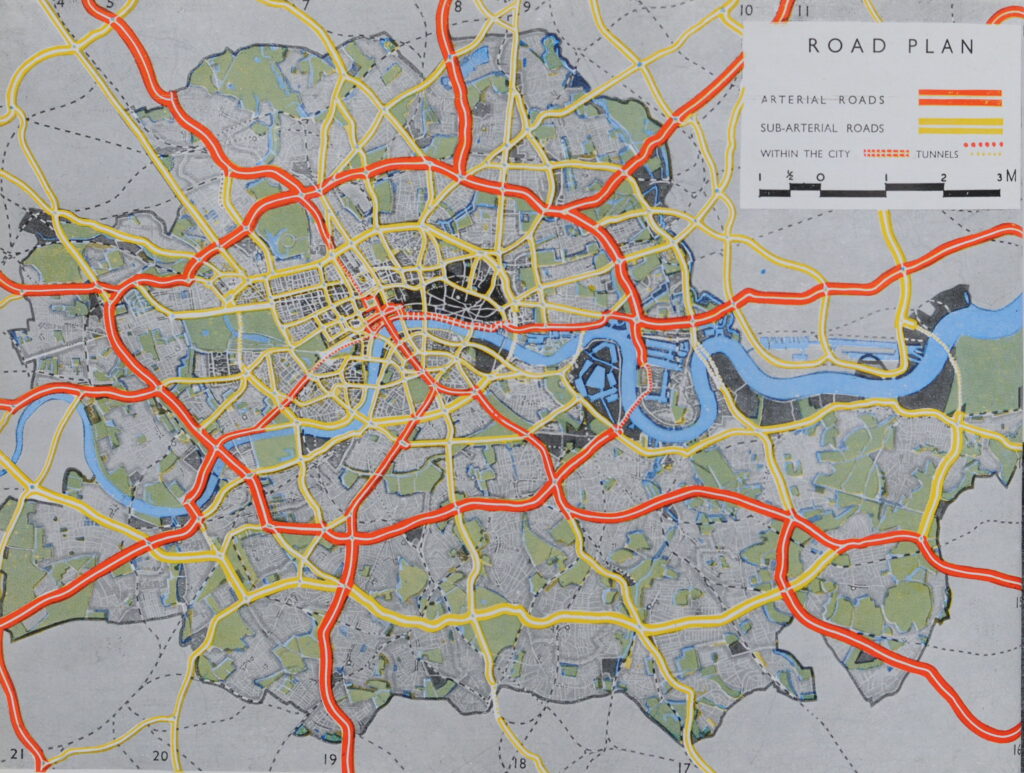
The black area in the centre is the City of London. The red dashed lines between the City and river represent the arterial road that would be created with the construction of the dual carriage ways along what is now Upper and Lower Thames Street. This, as shown in the map, would create a the main east – west route through the City.
The arterial roads stretching out from the city are roads such as the A1, A2, A13, A3, A4 etc. all of which have been rebuilt as major routes into and out of the city to the wider country.
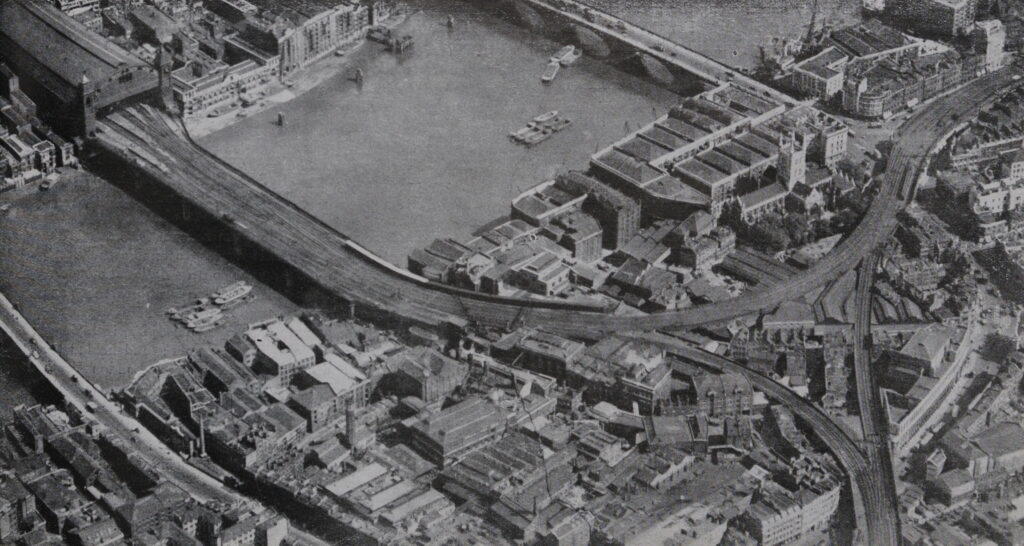
Railways were also considered in the report. A major concern was the impact that railway viaducts had on the city. Viaducts cut through neighbourhoods, dividing areas, and as the booklet described “were signs of incredible squalor, with trains rumbling in front of bedroom windows, day and night”.
The booklet used an aerial photo of Southwark as an example of the impact of viaducts:
The booklet has a bit of a negative view of rail transport, which probably influenced the following decades of under investment in rail and investment in road transport.
For example, the following paragraph from the booklet covering the London Underground:
“In recent years the Underground Railways have contributed an additional problem for planners. Without thought for the total welfare of London they have pushed their lines out to the open country, encouraging uncontrolled speculative development. It was said at one time that London Transport needed a London of 12,000,000 inhabitants if it was to operate profitably. growth to such dimensions in the districts to the present railway network is the worst possible thing from the point of view of London as a whole.”
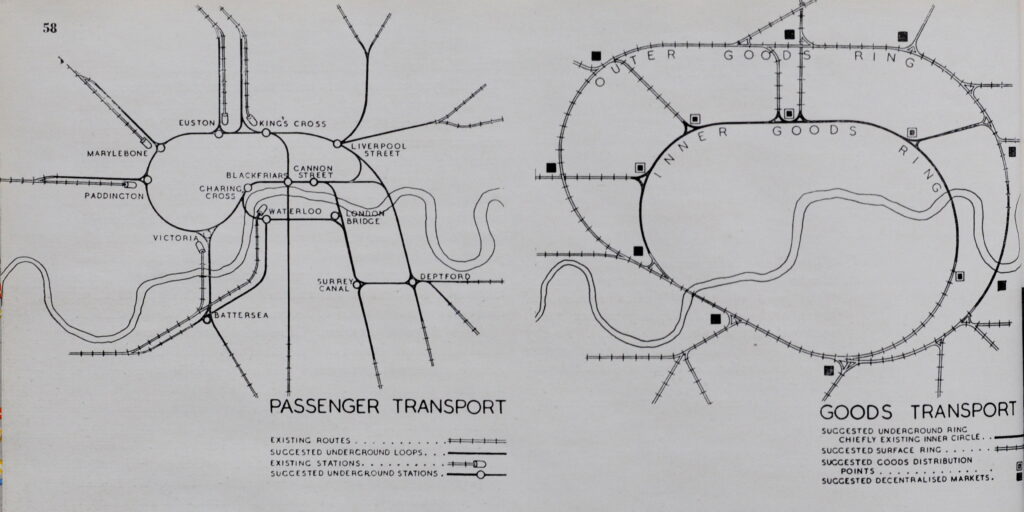
The plan makes a number of recommendations for London’s railways, including “increased electrification, better interchange between main lines, underground and suburban services; removal of viaducts; better receiving and distributing services for goods; and possibly the use of air-freight services”.
It is interesting comparing the 1943 plan, with today’s approach, where in 1943 air travel was being suggested as an alternative method for transporting freight, rather than the railways.
The booklet complained that whilst the County of London Plan “tackled the railway problem boldly”, the Central Government or Local Authorities did not have the powers to plan railway companies activities.
The plan suggested the use of underground loops to link stations, an inner and outer ring for goods traffic and the removal of viaducts. Some of the proposed new routes are shown in the following maps from the booklet:
The plan used the South Bank as an example of what could be achieved. The area between Westminster and Blackfriars Bridges had long been the target for improvements. In the late 19th century, newspapers moaned that the area was the first view of London that Americans arriving on the boat train from Southampton would see, and it was an industrialised area with dense, poor terrace housing.
Improvements along the South bank had started in the first couple of decades of the 20th century with the construction of the London County Council’s County Hall, and the plan proposed the South Bank up to Blackfriars Bridge should be transformed as a cultural centre, offices, improved housing, open space and a river walkway.
The plan’s vision for the South Bank was shown using the following model:
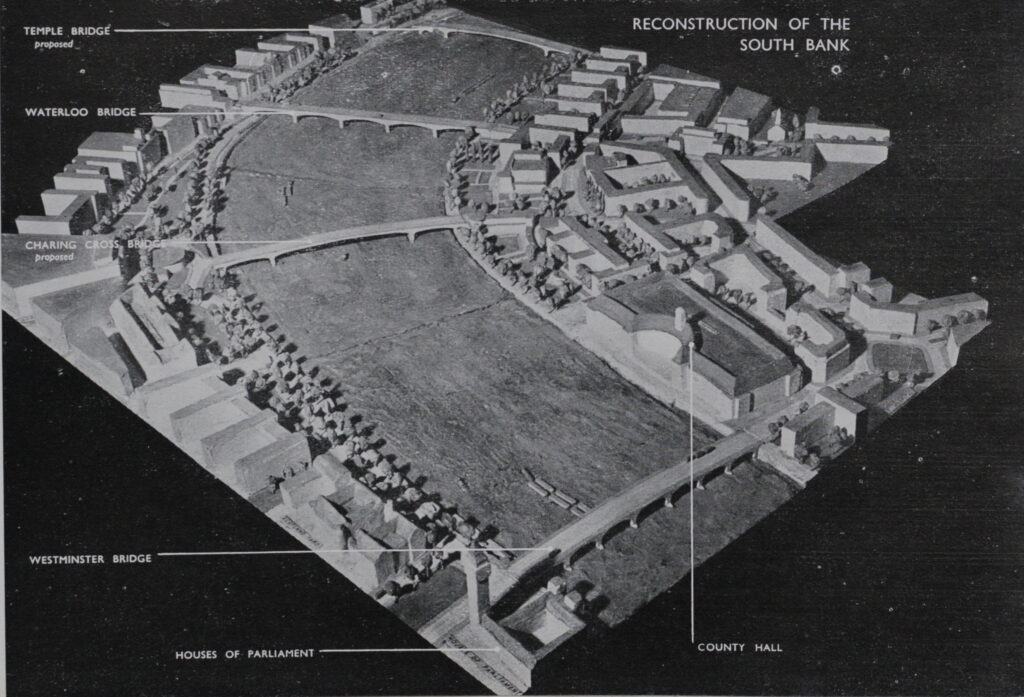
As well as the development of the South Bank, proposals included the removal of Hungerford Railway Bridge, and two new road bridges; a new Charing Cross road bridge and a new Temple Bridge. The car rather than the railway was seen as the post-war future of transport.
The booklet includes a section titled “Putting Theory Into Practice”, which deals with the challenges of implementing the complex and extensive plans proposed in the County of London Plan.
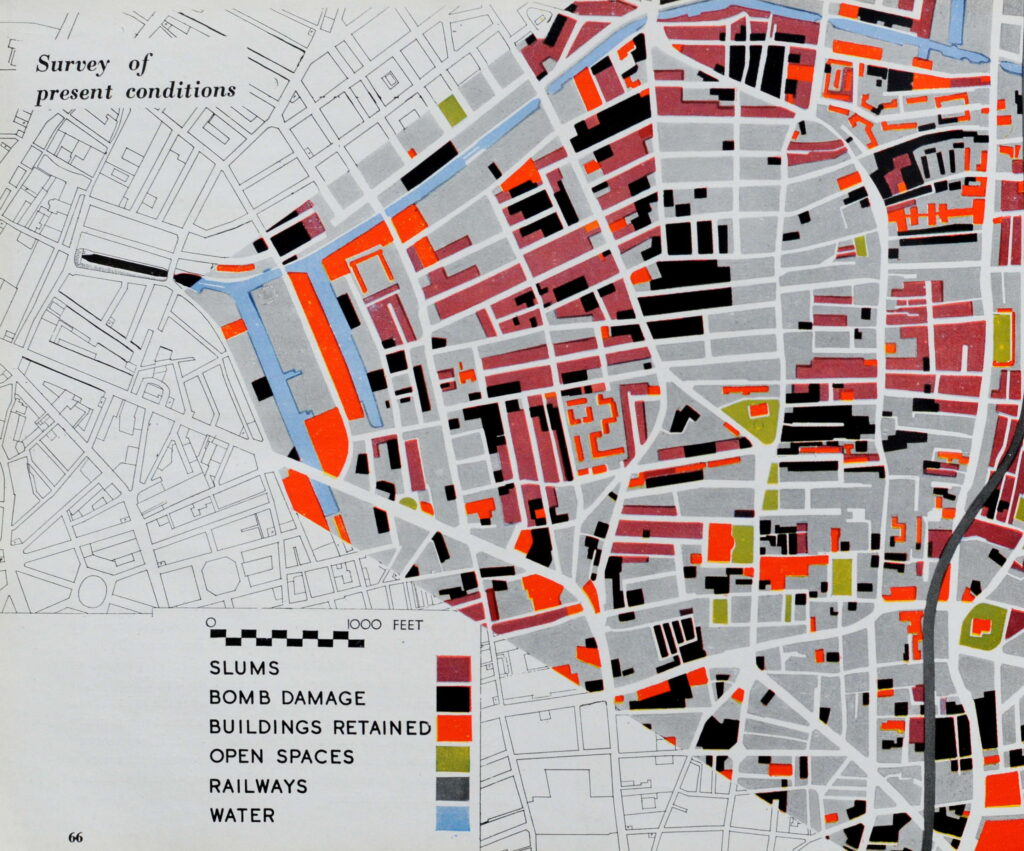
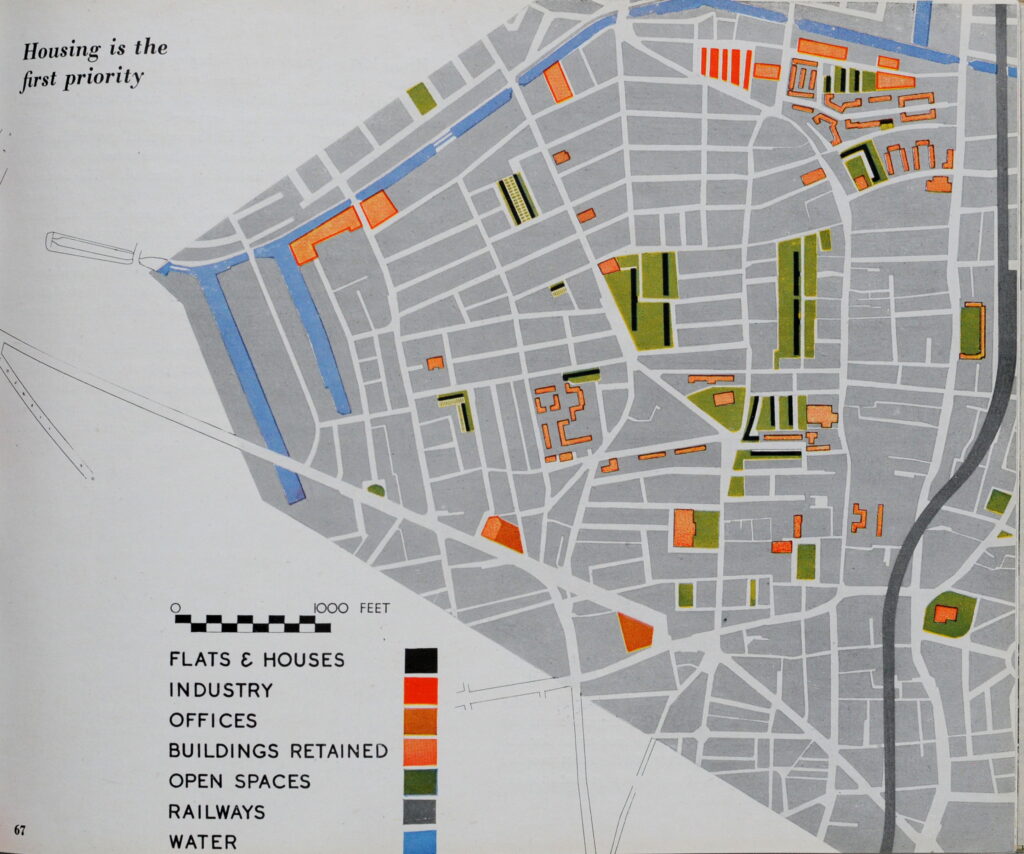
It makes a comparison with Russia, stating “We all know the great Russian Plans were actually named by the number of years work they involved – the Stalin Five Year Plans – so in due course the County Plan must be divided up into periods and, if we secure sufficient means and powers, we can get the planners a real confidence that each stage will be completed within a limited and stated time.”
To illustrate how this might happen, the booklet includes a series of maps showing how a area could be transformed, starting of with a “Survey of present conditions”:
Followed by Housing as the first priority:
Places of work would be key:
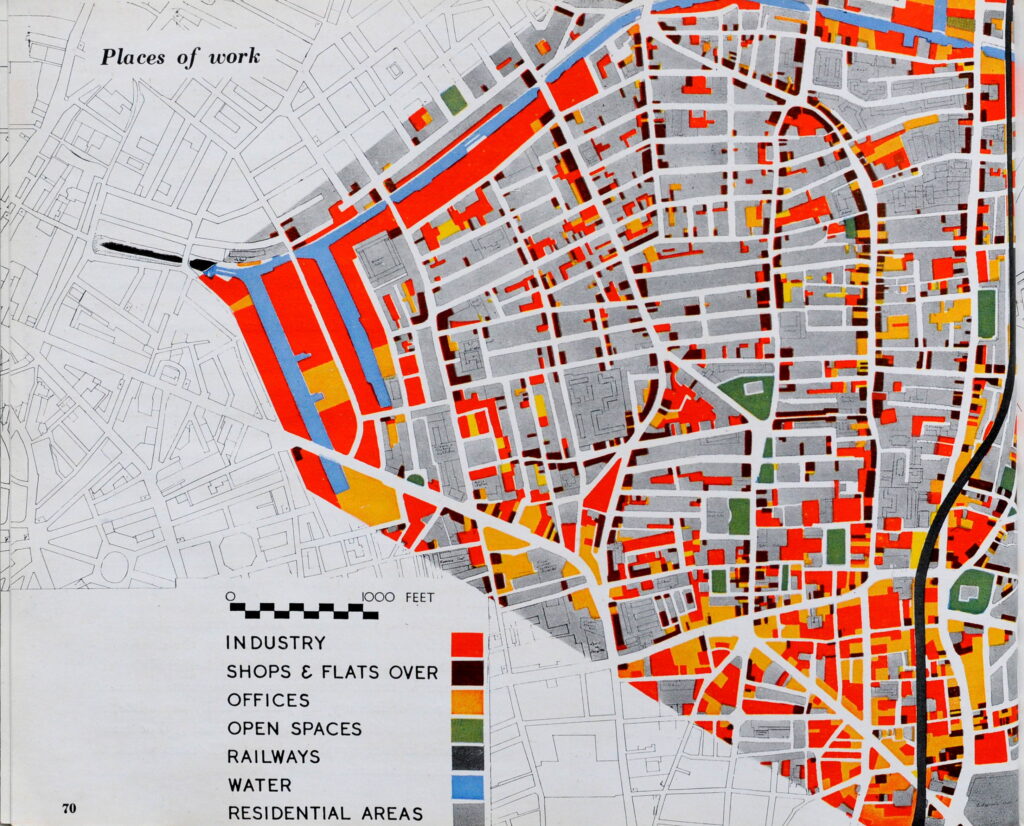
With the need to re-plan the places of work so they move from being packed within areas of housing (above map), to dedicated industrial areas away from residential areas (following map):
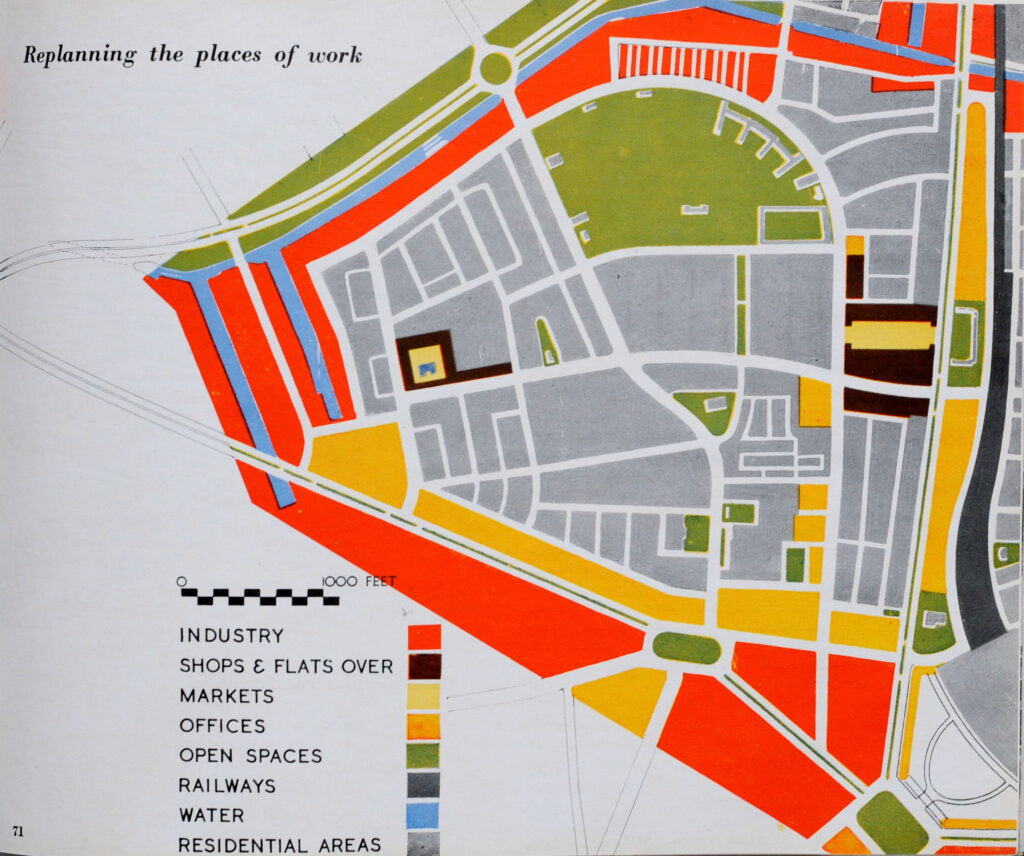
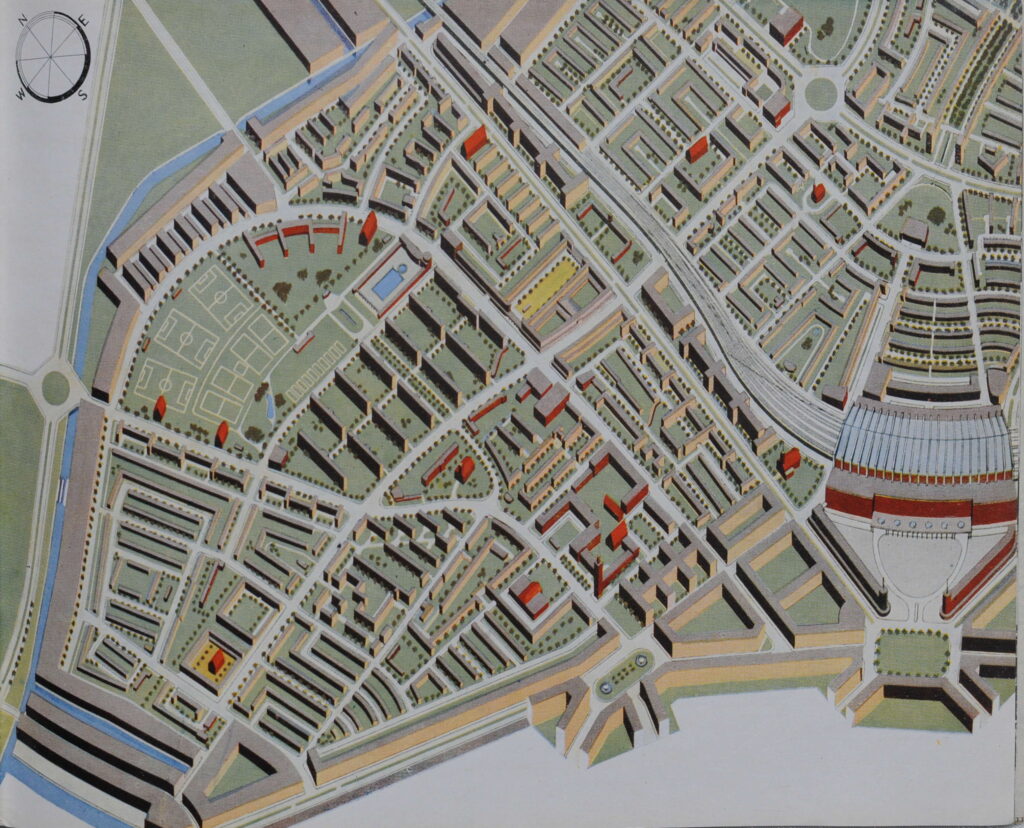
The following diagram shows an aerial view of the completed transformation. A planned and completely rebuilt area of London consisting of ordered residential areas with plenty of public open space. Industrial areas along the edges of the residential to provide local jobs, but not on top of where people lived.
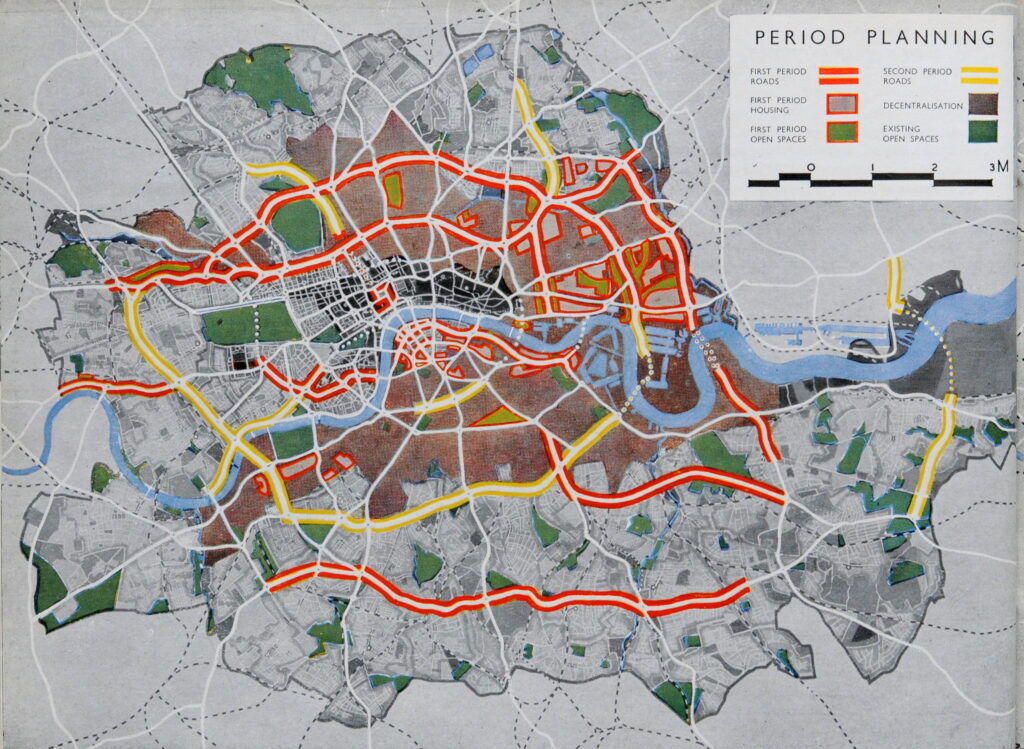
A map titled “Period Planning” identified the priorities for the first period of development, with the key arterial roads and the areas that needed the most attention. The areas outlined in red are those where the plan recommended that work should start immediately.
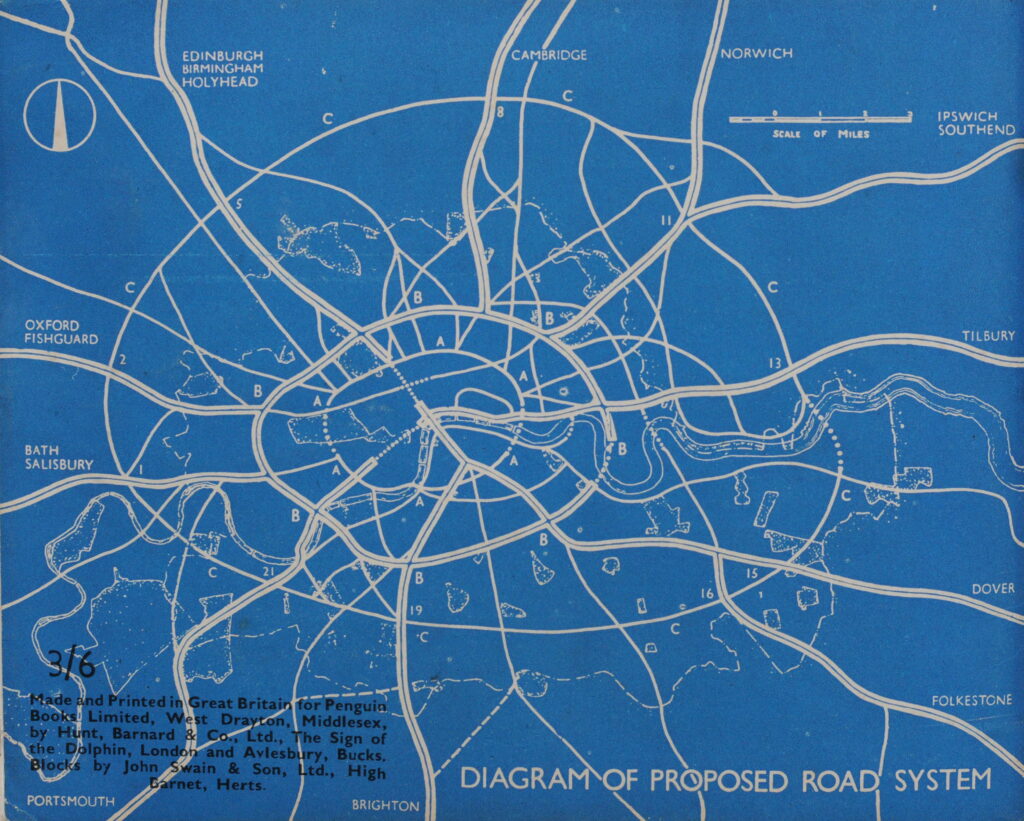
The rear cover of the booklet has a diagram of the proposed road system, with the first indication of an outer ring road, a proposal that many years later would evolve into the M25, although further out from the city than shown in the diagram.
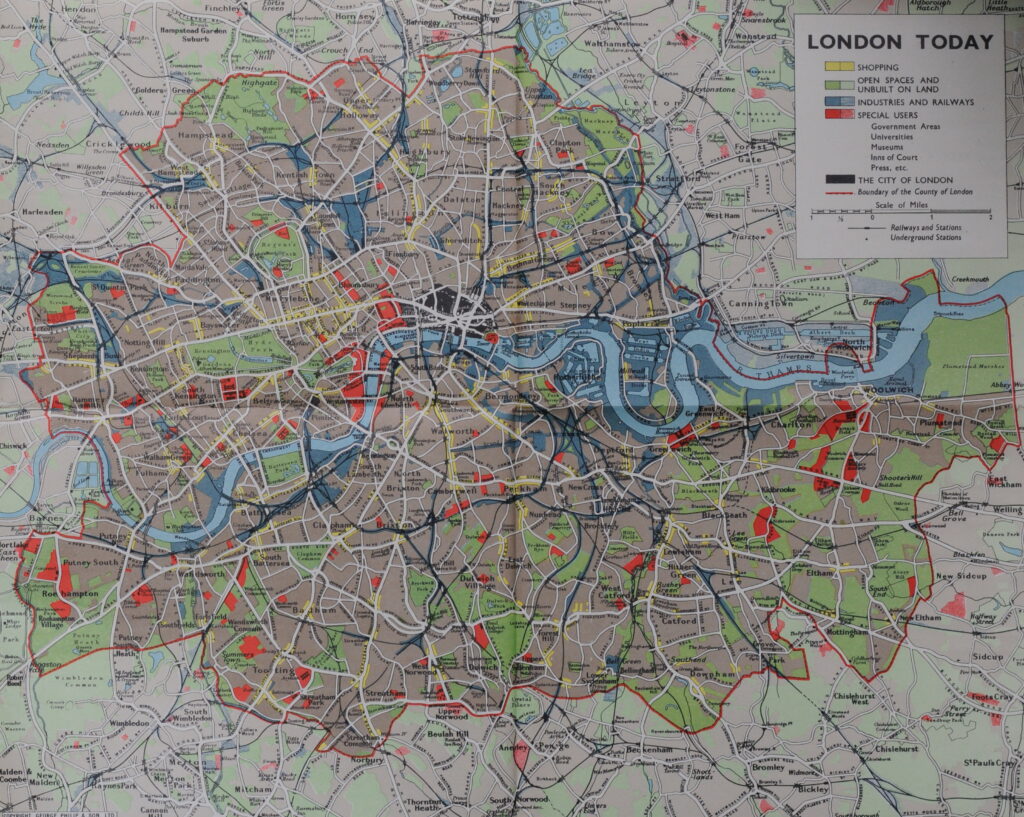
On the inside rear cover of the booklet is a wonderful fold out map titled “London Today”. the map shows a high level view of the use of land within the County of London. What is interesting is that the map shows the boundary of the County of London, with east London places such as Canning Town, Stratford and West Ham being outside the boundary. These were originally within the County of Essex (click on the image to open a larger version).
The booklet provides a really good summary of the 1943 County of London Plan, and it is interesting that the architect Erno Goldfinger was one of the two authors of the booklet. The planned developments of housing probably aligned with Goldfinger’s view of the possibilities of new residential buildings as can be seen with those he was responsible for, such as the Balfron Tower.
The County of London Plan and the booklet used some really creative graphics to illustrate the key themes of the plan.
Many of the developments proposed within the County of London Plan would not take place. Some would still be debated decades after the plan. If you go back to the map titled period Planning, you will see at the right edge of the map, there is a road in yellow routing under the Thames. This was the original East London crossing that caused major controversy in the early 1990s when the proposed route would take the road through the ancient Oxleas Wood.
That scheme was cancelled, but it is interesting that over 40 years later, there were still plans to implement some of the recommendations of the 1943 County of London Plan.
Planning for London has always been a challenge. Never enough money, changing politics and changing public attitudes.
The Mayor of London continues to produce a London Plan, the latest March 2021 plan can be found here.
The current strategic plan is a total of 526 pages and after wading through it, it would really help if an equivalent to Carter and Goldfinger could produce a booklet explaining the key points of the plan.
I do wonder how much of the current plan will be implemented. The word “should” is used a total of 1,540 times in the document to describe a recommendation or target, rather than words such as “will” or “must”.
There are some fascinating statements in the 2021 plan, for example at paragraph 10.8.6:
“The Mayor will therefore strongly oppose any expansion of Heathrow Airport that would result in additional environmental harm or negative public health impacts. Air quality gains secured by the Mayor or noise reductions resulting from new technology must be used to improve public health, not to support expansion. The Mayor also believes that expansion at Gatwick could deliver significant benefits to London and the UK more quickly, at less cost, and with significantly fewer adverse environmental impacts.”
I always wonder how much politics is involved in these decisions. Are there fewer voters for the London Mayor under Gatwick’s flight paths than under those of Heathrow?
The 2021 plan includes proposals for major transport projects such as the Bakerloo line extension and Crossrail 2. In the section on funding the plan, there is the statement that:
“There is a significant gap between the public-sector funding required to deliver and support London’s growth, and the amount currently committed to London. In many areas of the city, major development projects are not being progressed because of the uncertainty around funding.”
The Covid pandemic has really hit Transport for London’s finances, and a long term reduction in those working five days a week in London will further reduce fare revenue. The national Government also has a focus on the so called “leveling up” agenda which may focus funding on developments outside of London.
Long term planning for a city with the complexity of London is extremely difficult. Funding, politics, the impact of external and unforeseen events all contribute to the very high risk that plans will need to change, will not be implemented, or will be implemented in different ways.
What these plans do help with though, is an understanding of the city at the time the plan was developed, challenges facing the city, and how these challenges were expected to be addressed.
As such, booklets such as that by Carter and Goldfinger really help with understanding how London has developed.
They also include some wonderful graphics and maps.

Another great article. I wonder where you find the time for the research!
I think you should be given the job of explaining the current plans. With a suitably hefty stipend, naturally. It is interesting that, as you say, the same old problems come up each time and are dealt with (to a certain extent) but there is a constant need for money and resources. On a more cheerful note, London today is definitely cleaner and more wholesome than it was even forty years ago when I was living there – got to be a good thing.
Thank you for, as always, an immensely absorbing read. I too am in awe of your meticulous, and time-consuming, research. And not just reflections on the Plan but your observations of modern London, how things changed, are changing and will have to change in the future.
Well, “architectural squalor” and “absence of coherent architectural treatment in recent building” are of course code phrases for ‘we must embrace Modernism and comprehensive redevelopment as the mechanism to achieve it’… As far as the Paln itself is concerned, and gettig it across to the public, ‘The City of London – A record of destruction and survival’ by C.H. Holden and W.G. Holford (Architectural Press, 1951) did the same for the Square Mile a few years later. Best bit is an extraordinary chapter envisaging a walk through the City in perhaps 20 years’ time, illustrated by Gordon Cullen’s exquisite colour plates of the architecture and landscaping envisaged. Broad avenues, elevated roads with parking below, sunken pedestrianised concourses lined with shops and services, maritime-themed observation points from which to watch the river traffic – still very much industrialised – and small courtyards and spaces made from ruins and historic buildings.
My friend’s father architect Kenneth Browne was redesigning Leicester Square in the mid 1960s and was interviewed on the Tonight programme on BBC showing those plans etc. It never came to anything though.
Thank you. Interesting to see where my ancestors lived in the Canning Town and later Romford area, now part of Greater London, was then the responsibility of the county of Essex !
Thank you for another interesting article.
You describe the outer ring road in the Proposed Road System as an idea that would evolve into the M25. Comparing the route to the map of London Today, it looks to me to be a rationalisation of the North and South Circular roads, with a new river crossing in east London.
Superb blog, yet again. I studied this plan as part of an A Level Geography syllabus in the early 1970s, which fitted in really well with one of my other subjects, Economic History. That combination was a game-changer for me, and, for a good few years, career-determining. Thank you for reminding me of it!
This is really interesting, thank you for all your time and effort to make it so.
Another fantastic article. Fascinating to read and the maps are brilliant. Thank you
Bravo, another wonderful read. Love being able to click on maps and enlarge.
As having spent my Childhood in London and enjoying history & genealogy your articles bring things
into prospective. Thank you once again.
Another interesting read, Admin, although as this was published in 1943 it wouldn’t have taken into consideration the further destruction wreaked on London by the V weapons.
Loved those diagrams of how much space there should be between various housing blocks, with ten storey buildings warranting 200ft.! Have you seen how much space there is between the new blocks around Lewisham Station? Almost a case of good neighbours by being able to shake hands across the void. But then I saw the blocks at Vauxhall, well………….
At least the inhabitants can save money by watching the tv in the flat next block over. 😉
Very interesting read as usual
Fascinating booklet. Our love of the motor vehicle stems from planing ideas such as discussed here. Luckily rail has prevailed. Although as you say the recent pandemic has hit rail services financially. How will the changes to the way we work and where we work change London and all cities? Thank you for sharing this with us.