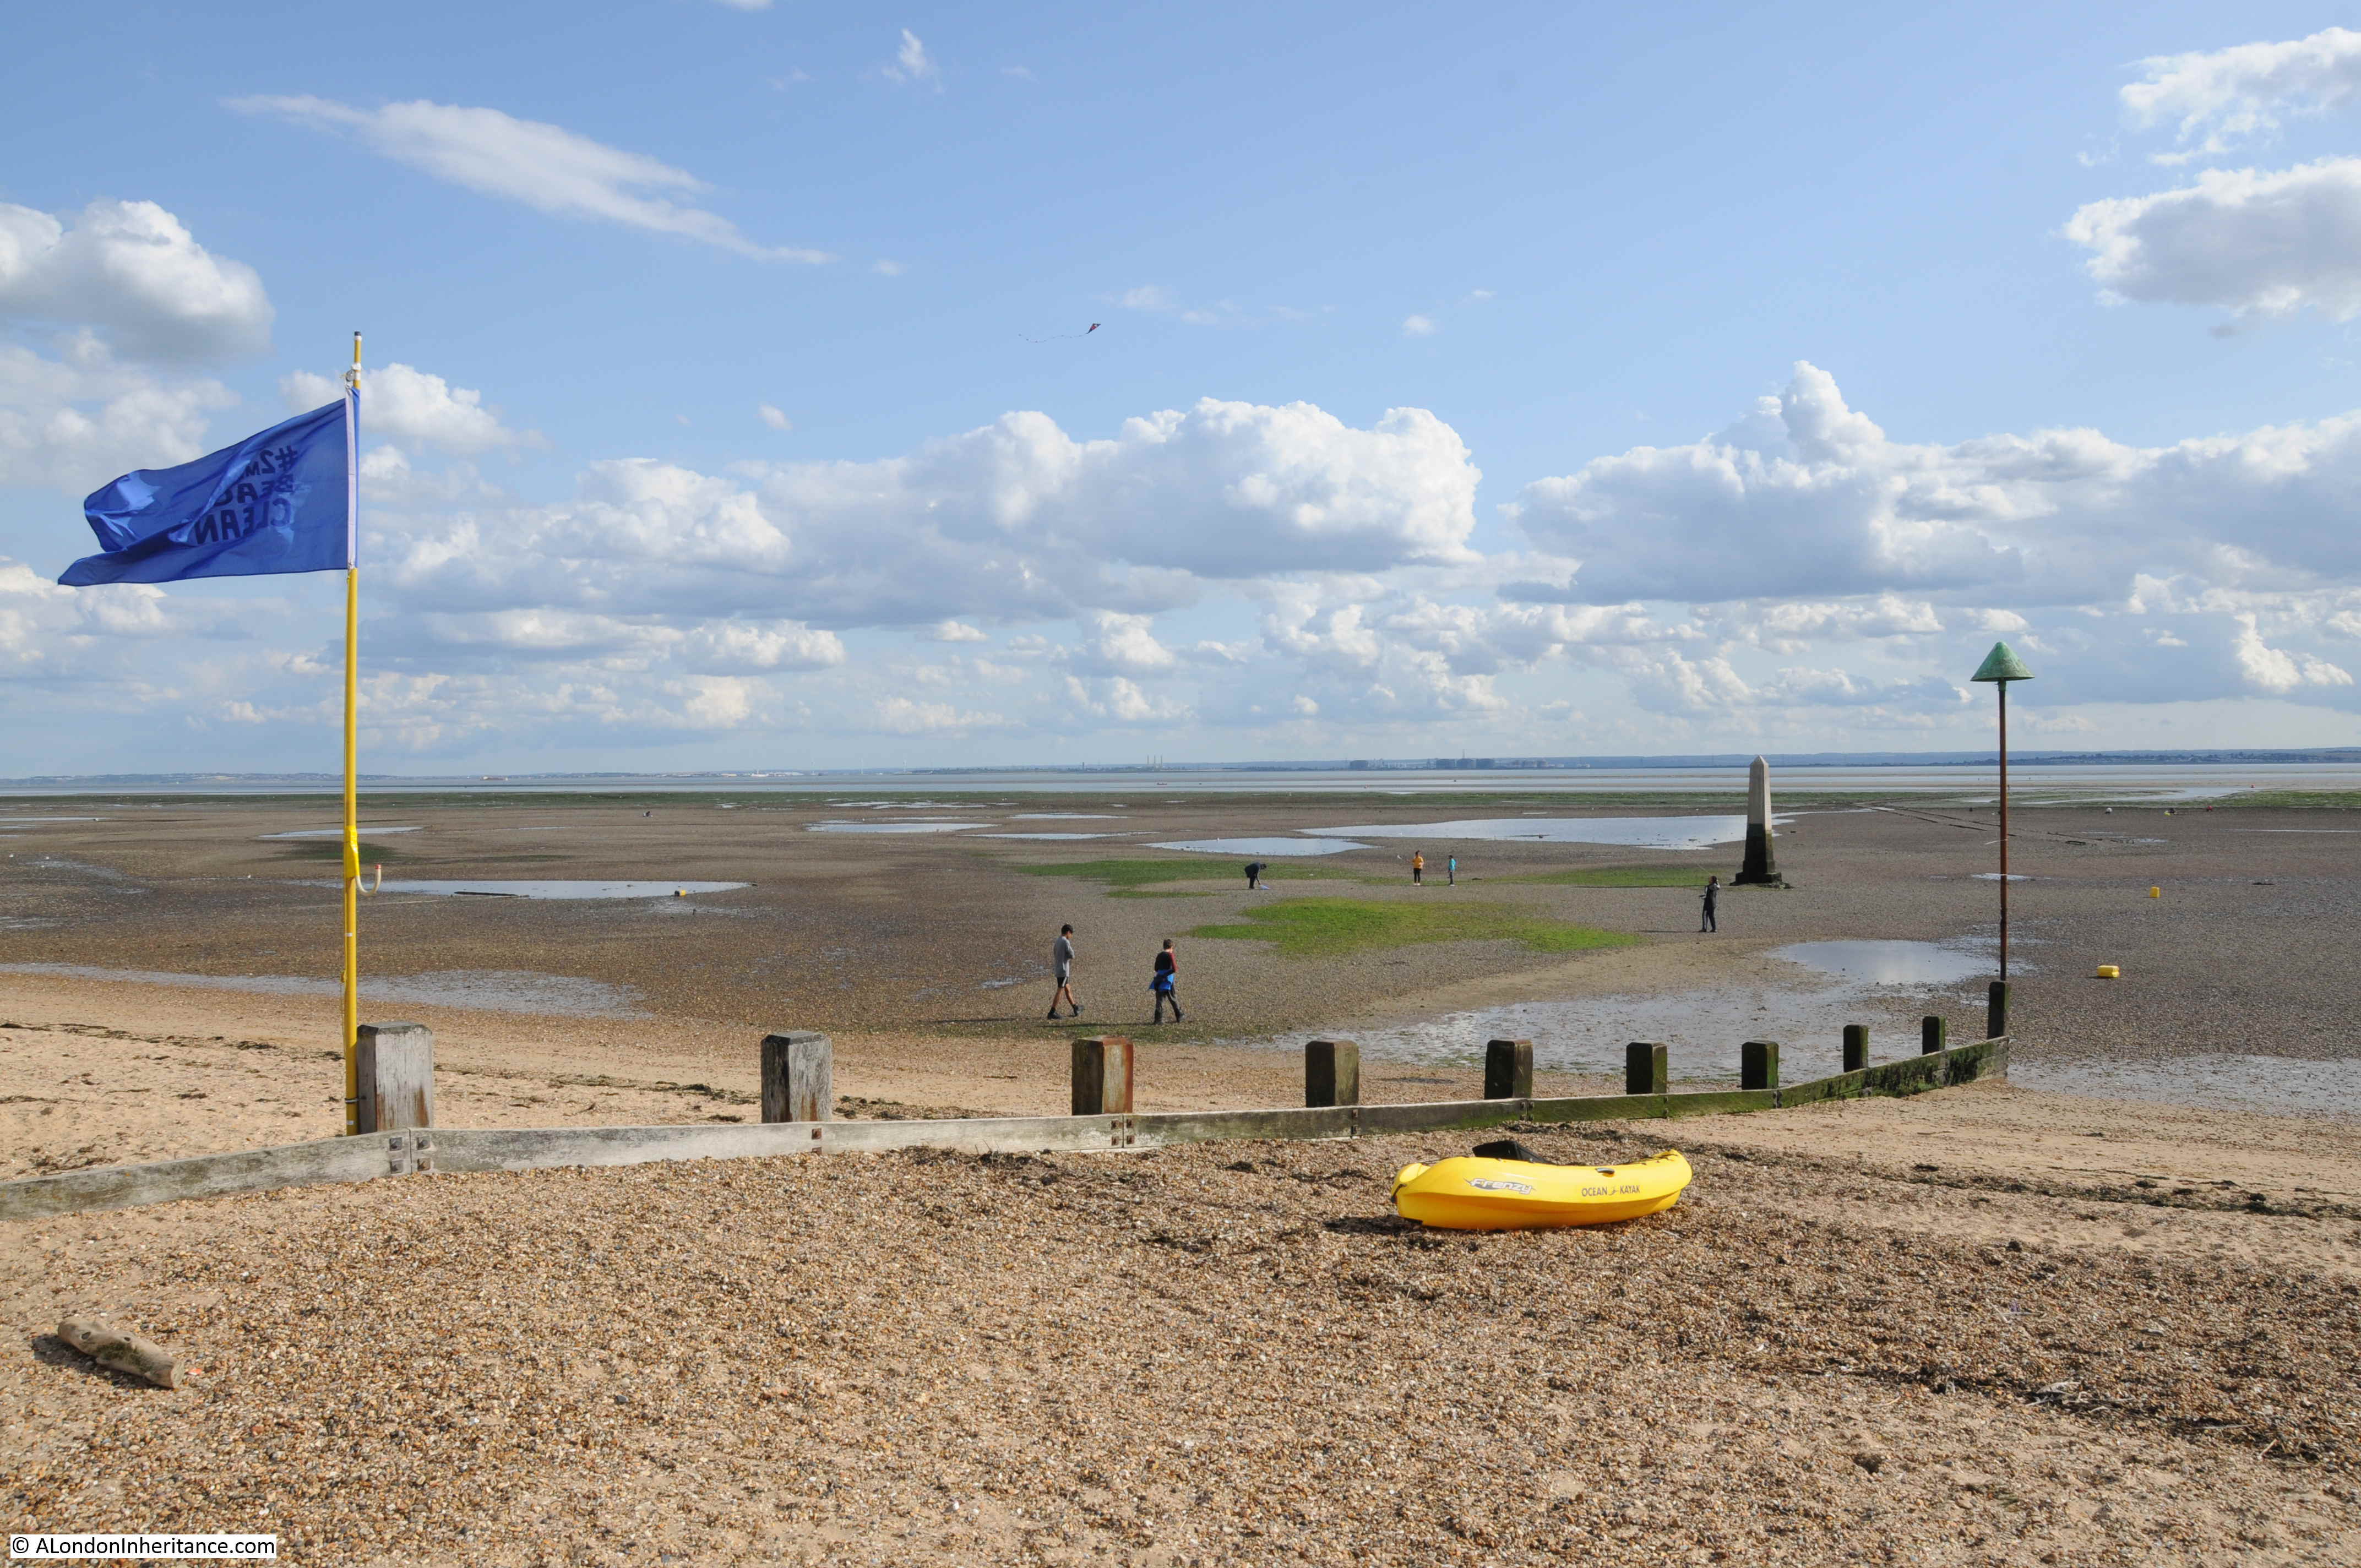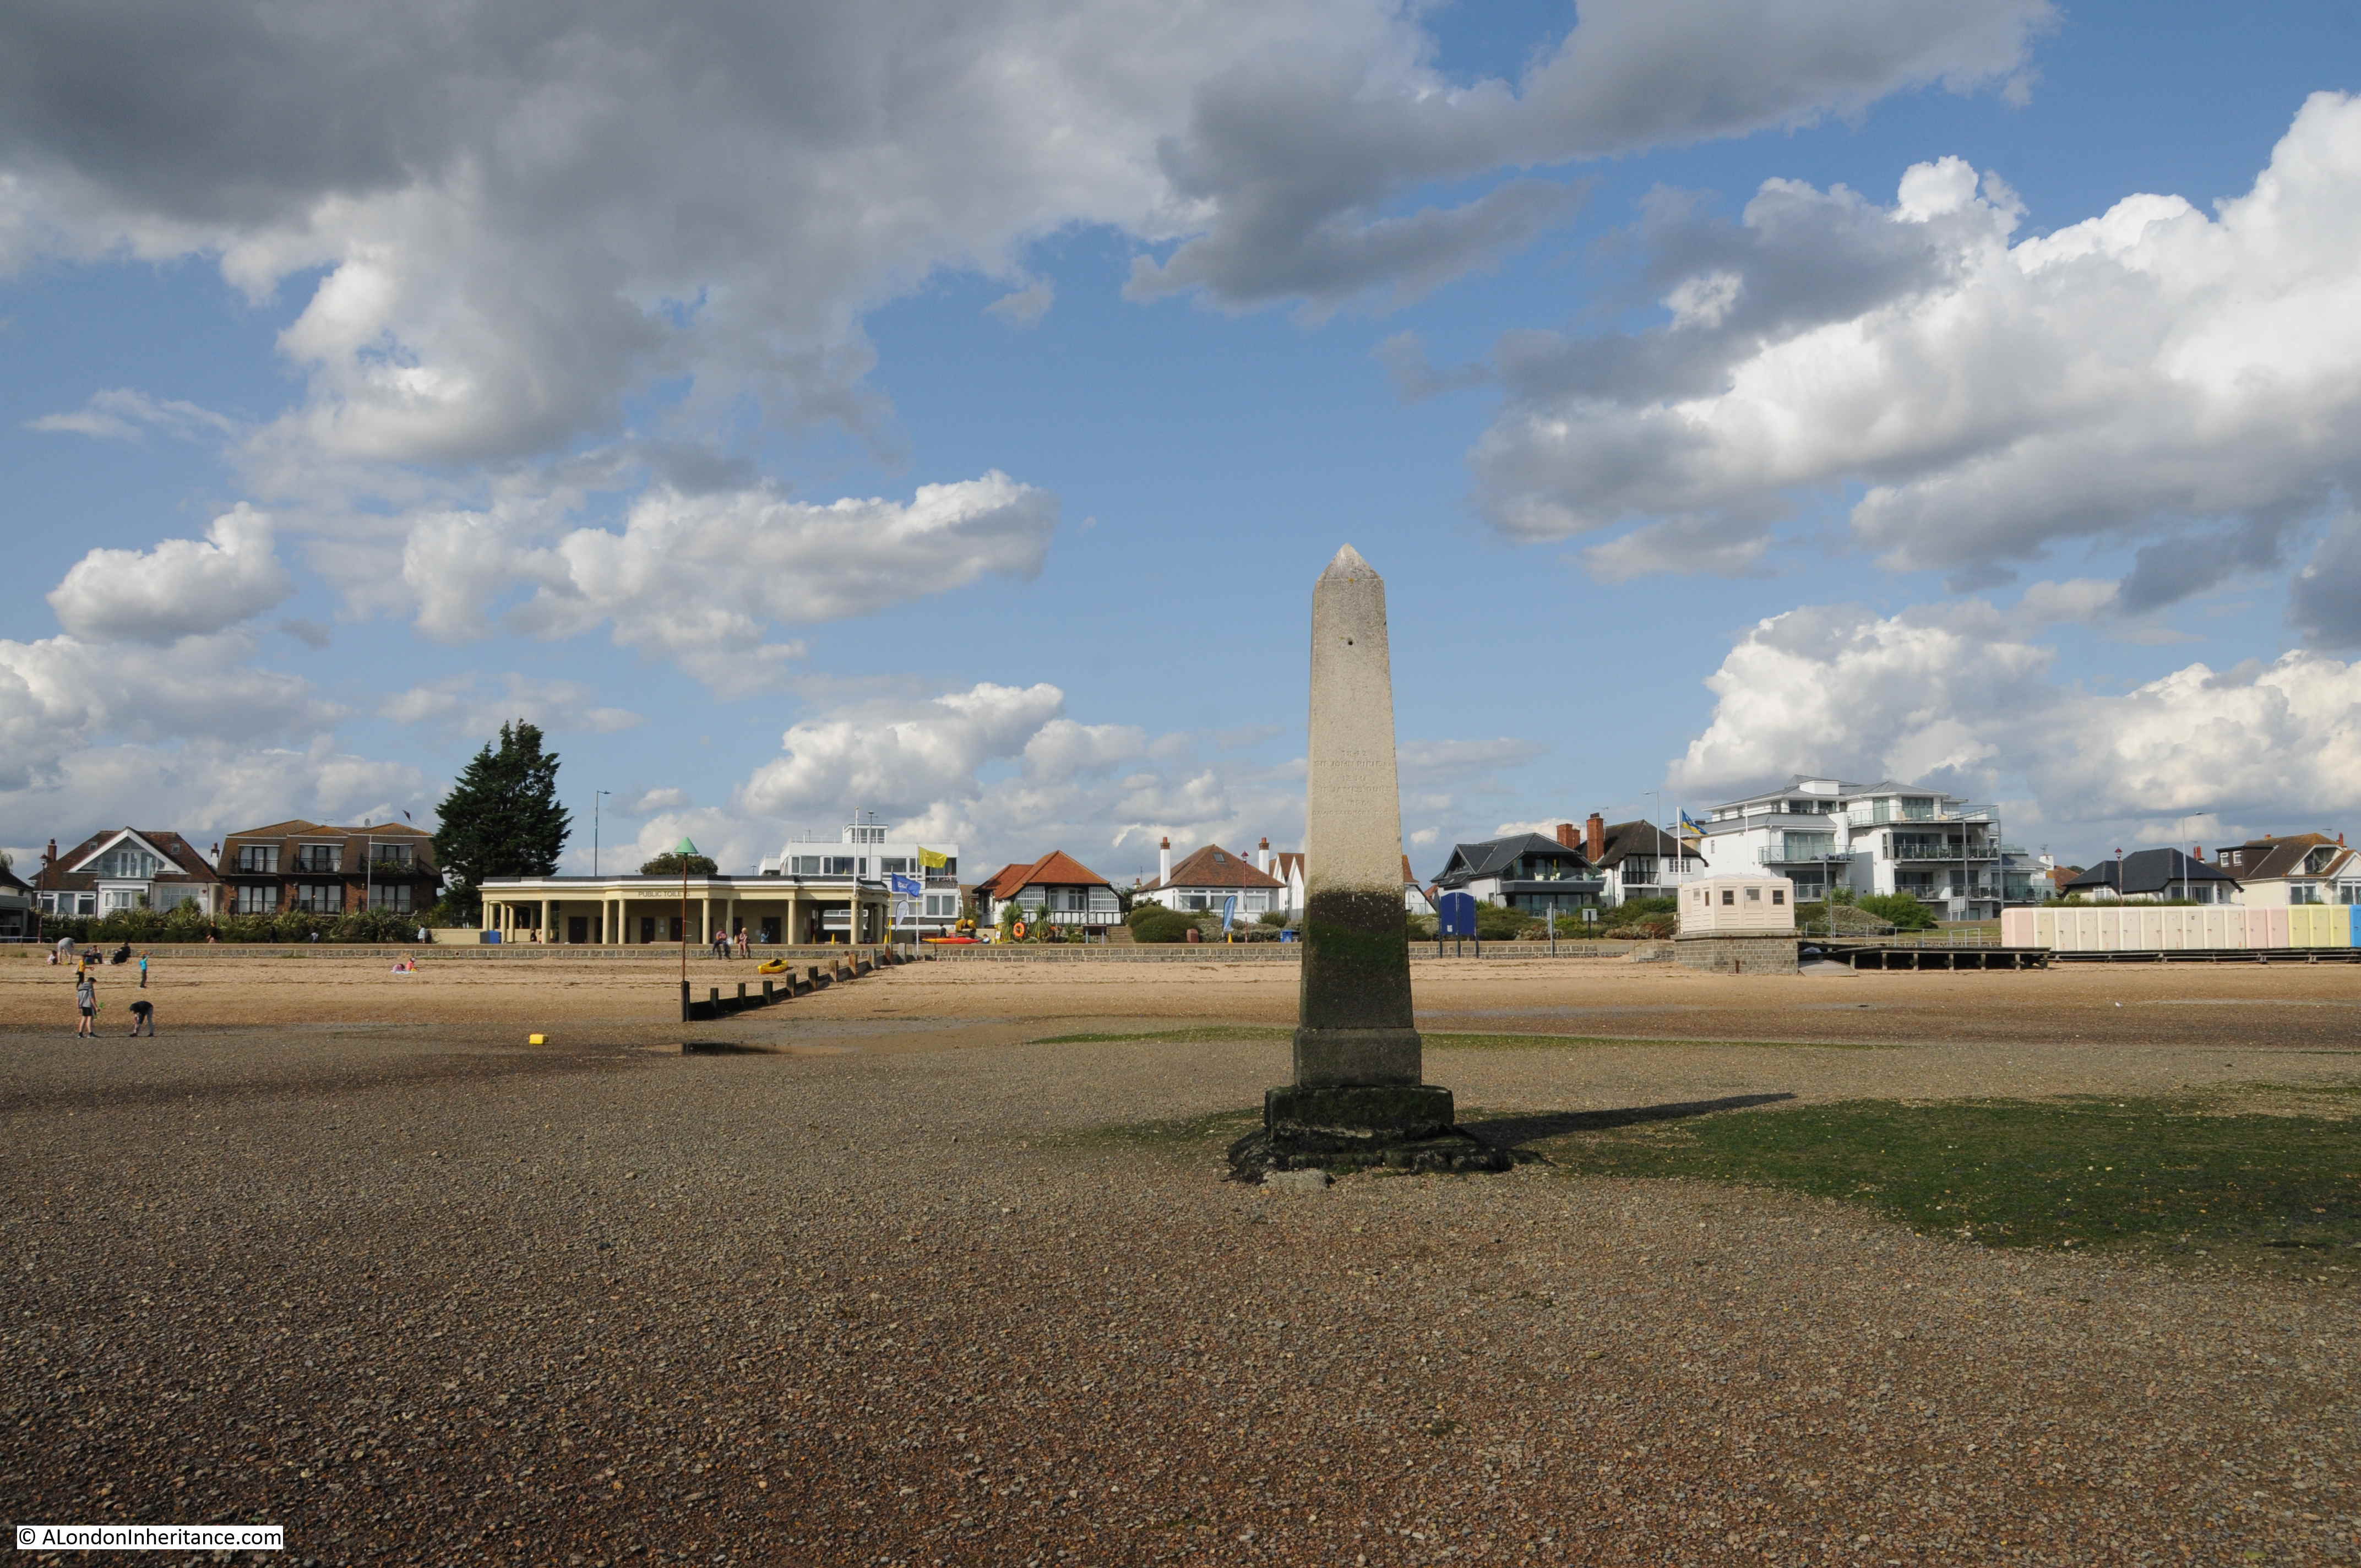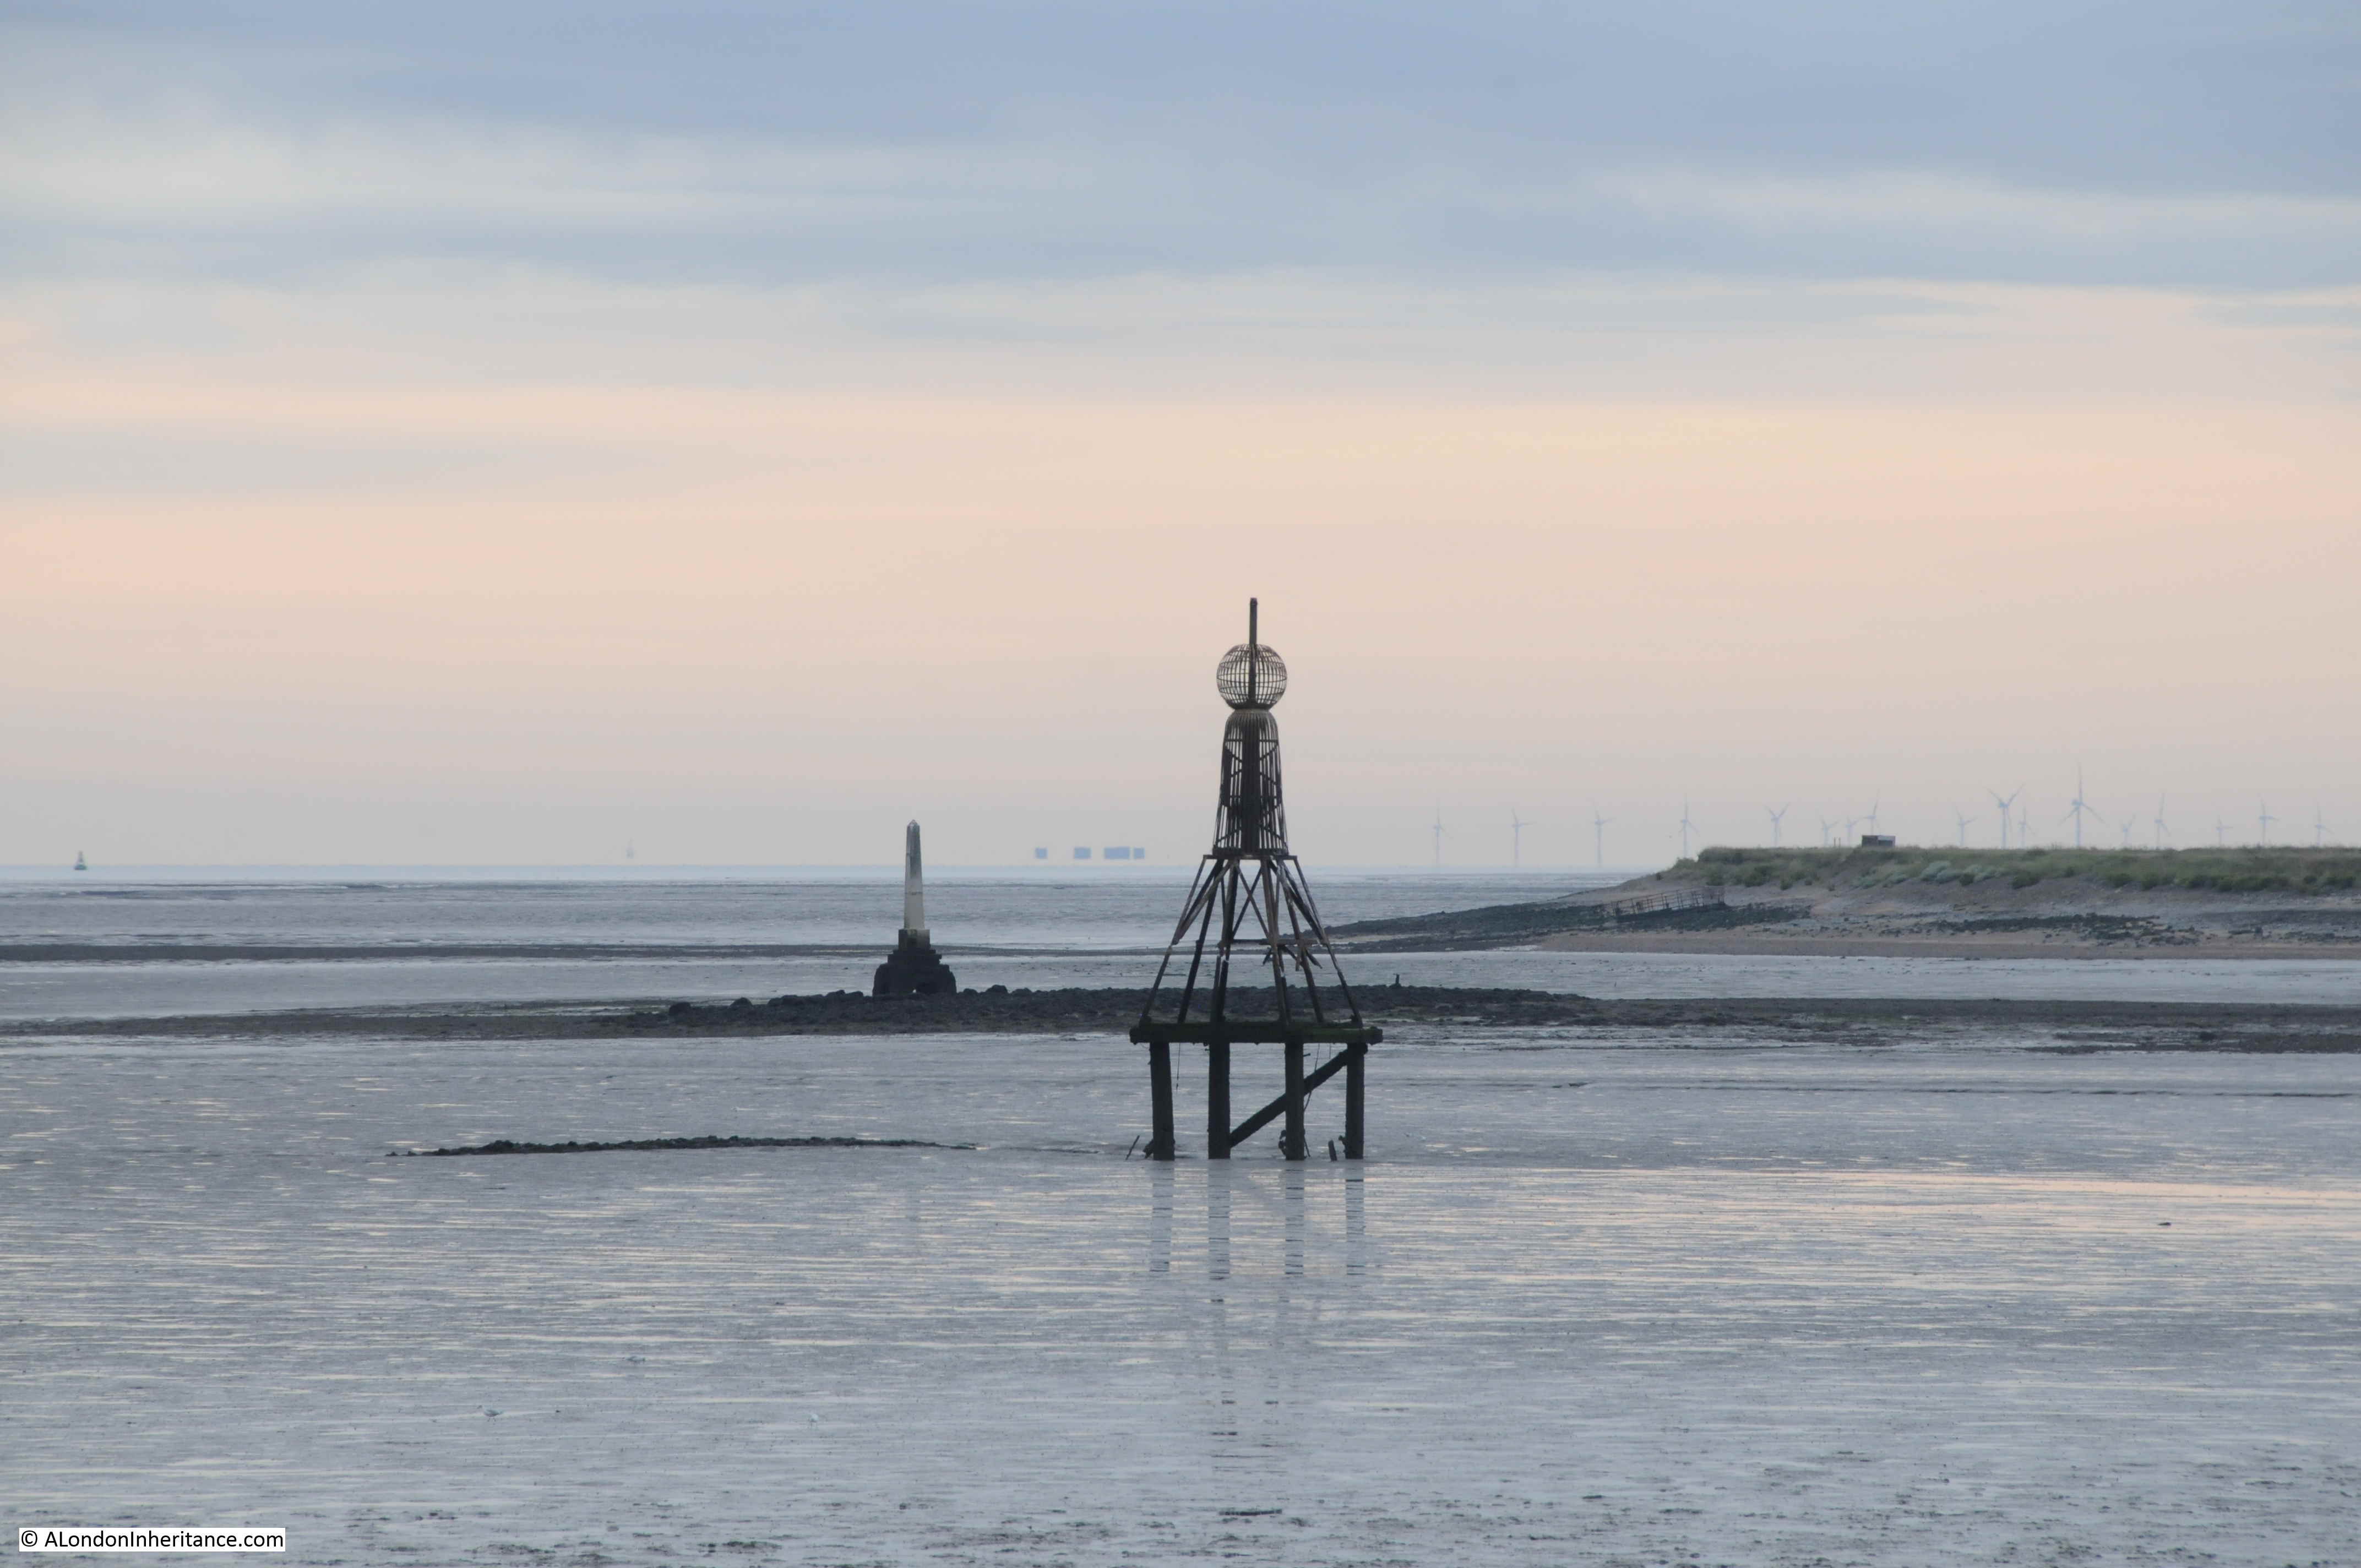
A couple of week’s ago, I wrote about the Crow and London Stones that marked the boundary on the Essex and Kent coasts of the City of London’s jurisdiction over the River Thames.
The City of London also claimed part of the River Medway. This ran from the southern end of Yantlet Creek to a point at Lower Upnor just to the east of Rochester. Lower Upnor also has stones marking the City’s claim, so I went to find these stones, and also took the opportunity to visit a number of other sites in north Kent, and understand how London has influenced the development of this part of Kent.
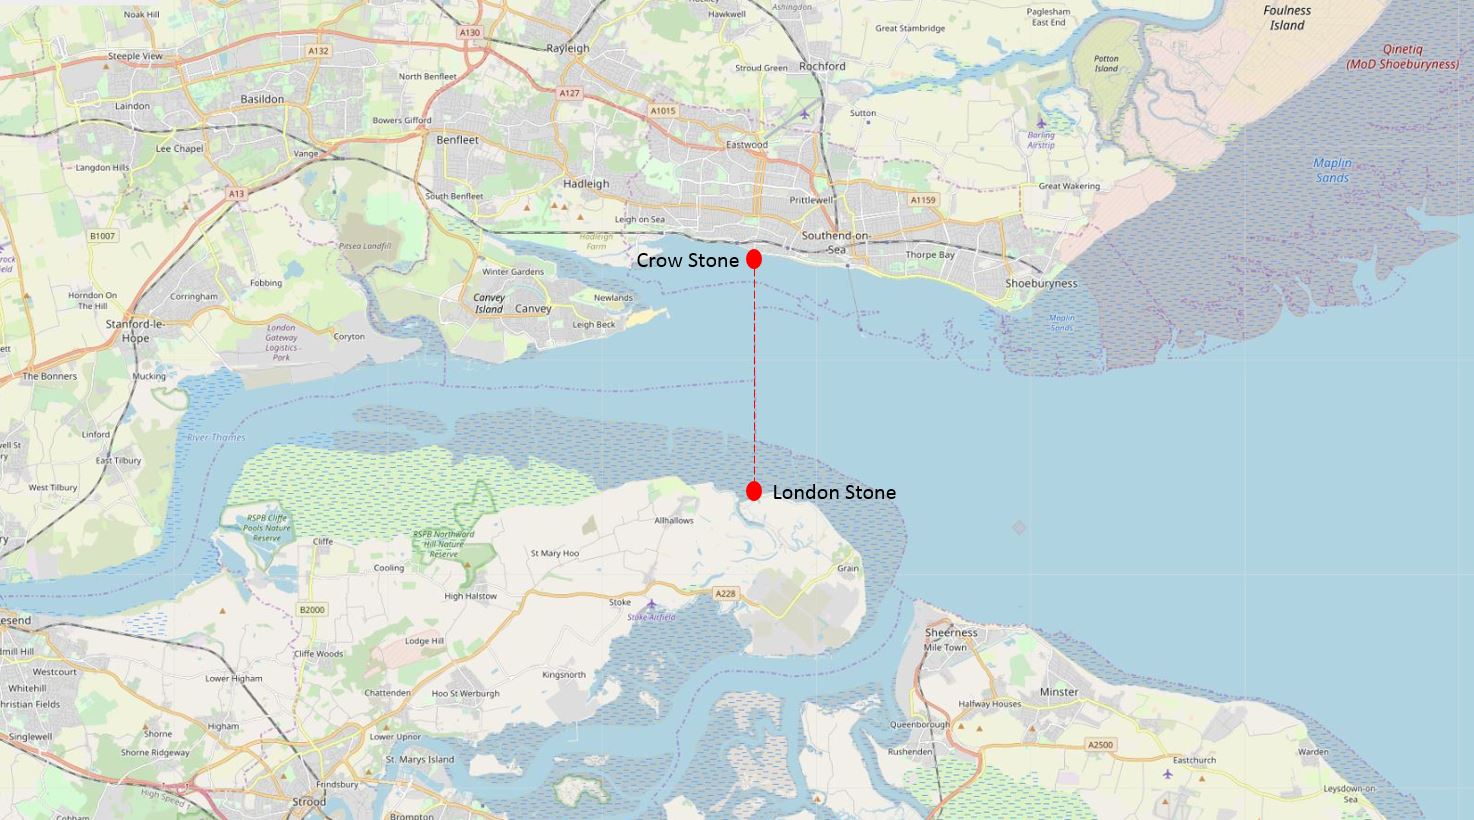
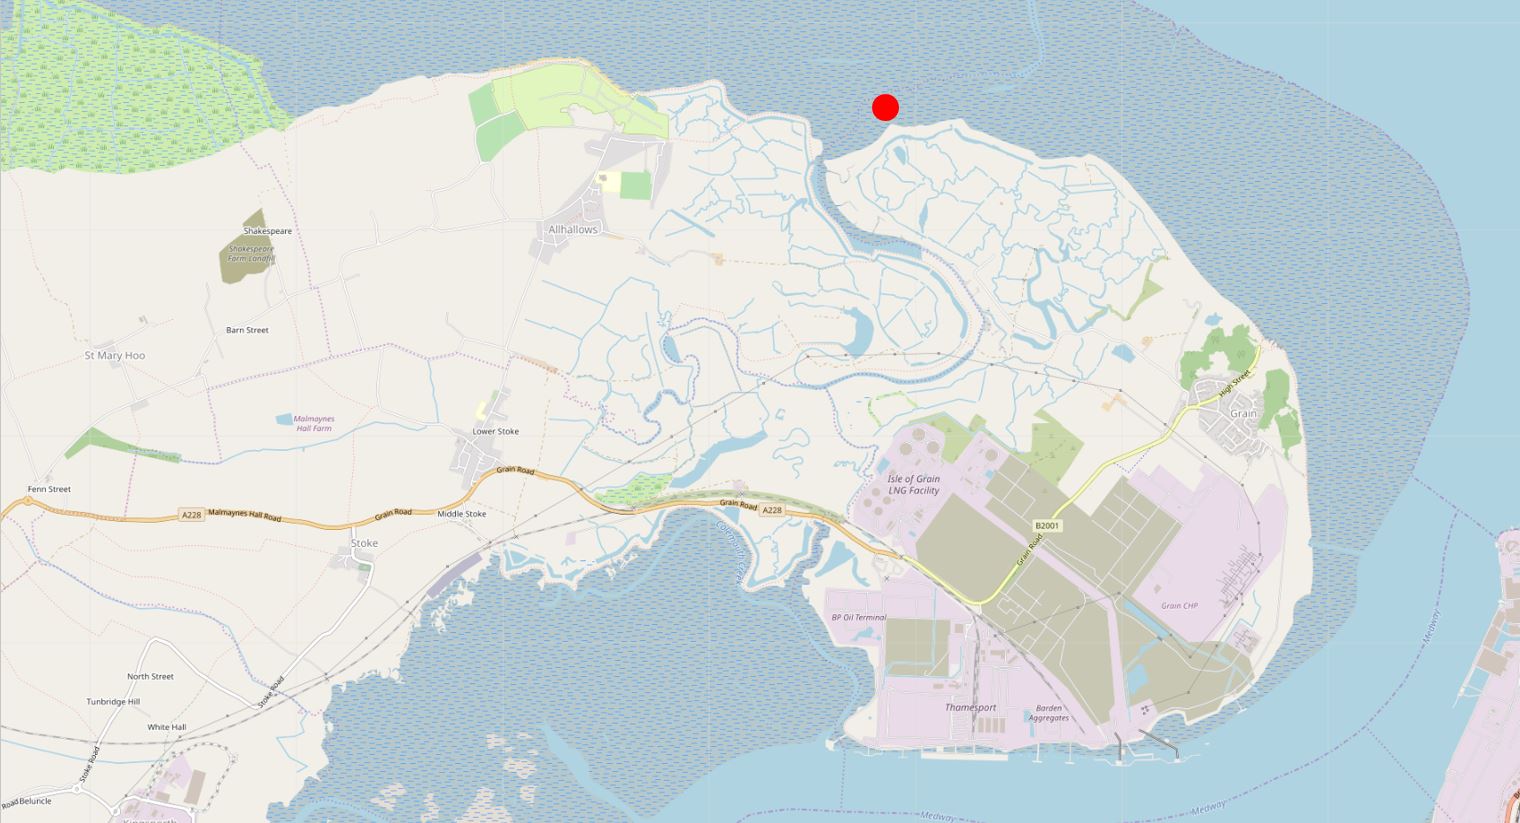
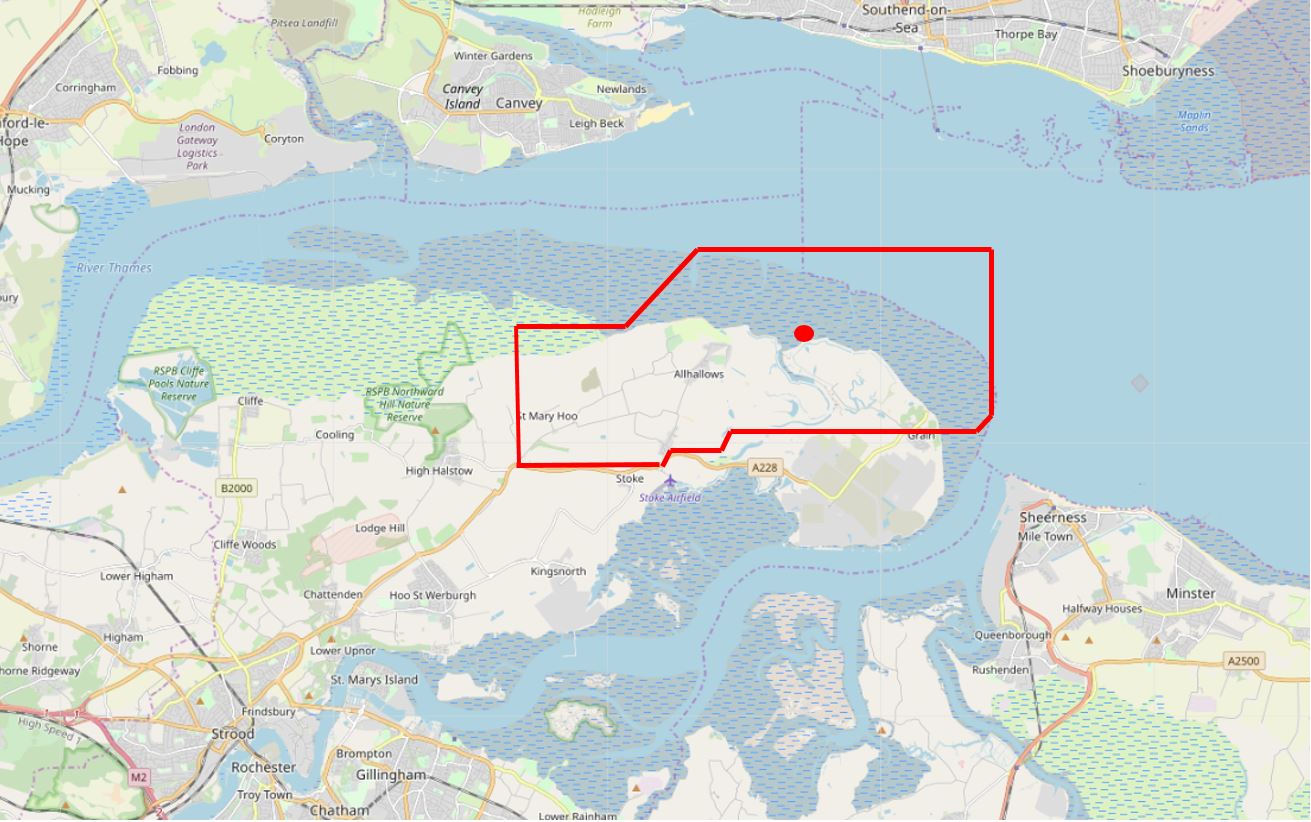
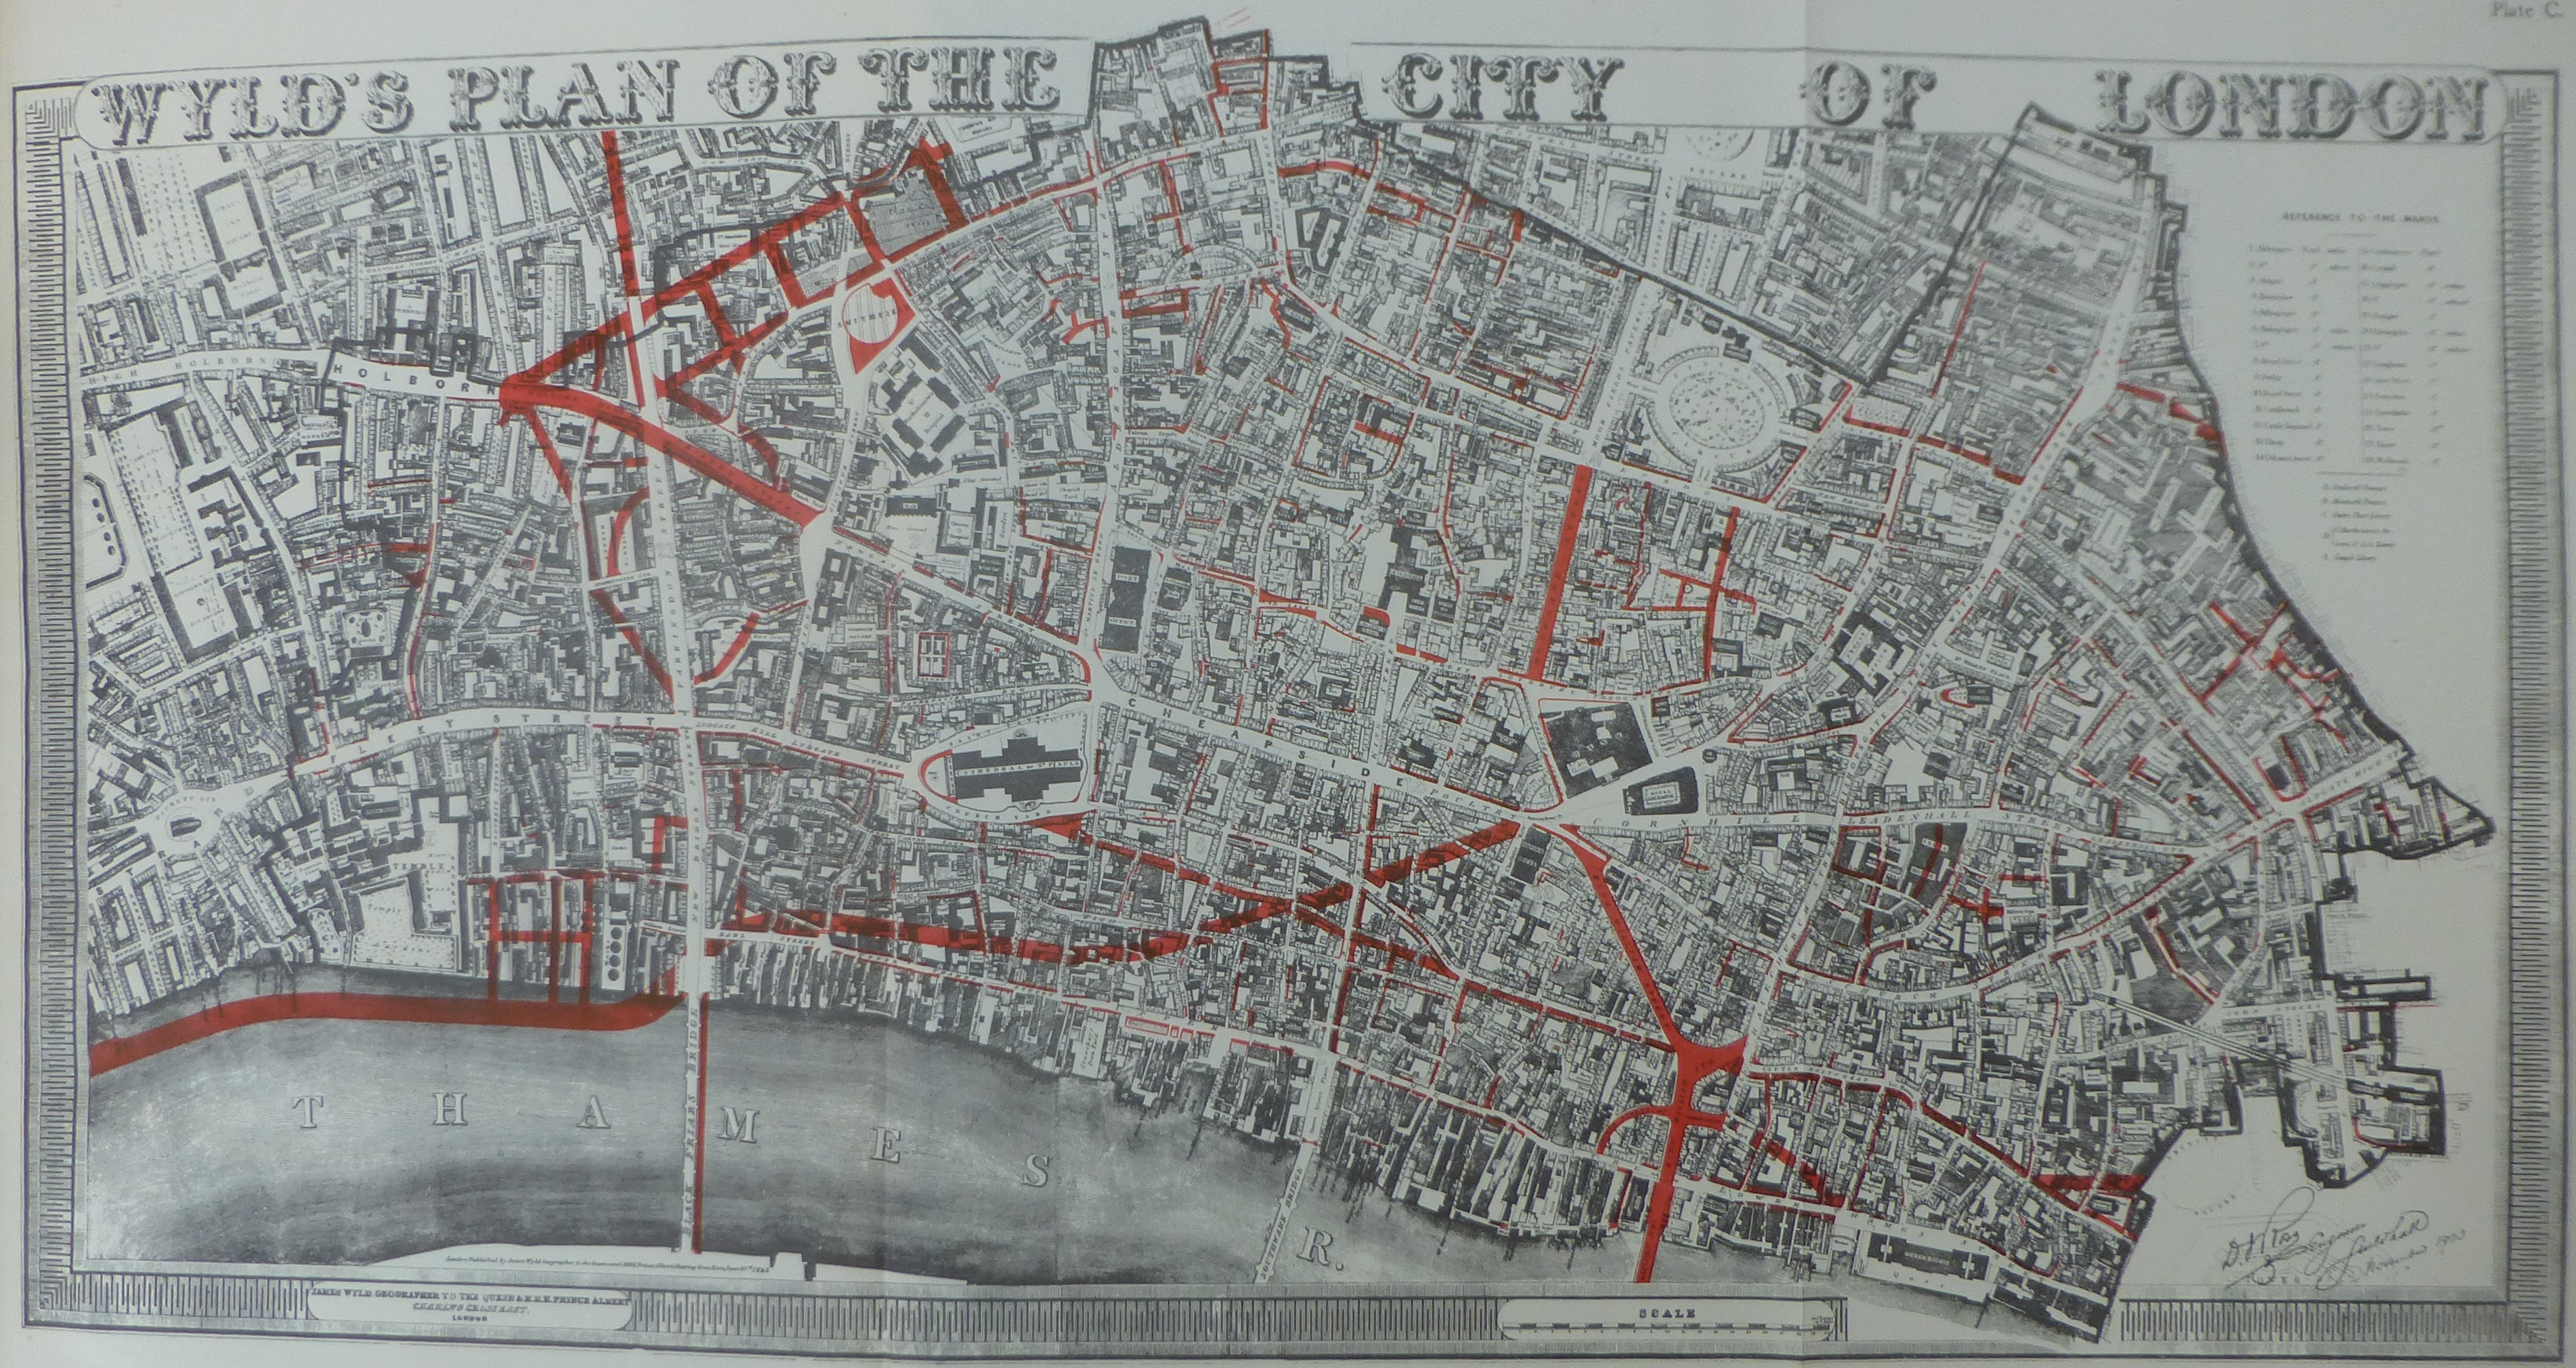
The following map shows the City’s boundaries on the River Thames and River Medway, and the other places I will visit in this post (Map © OpenStreetMap contributors)..
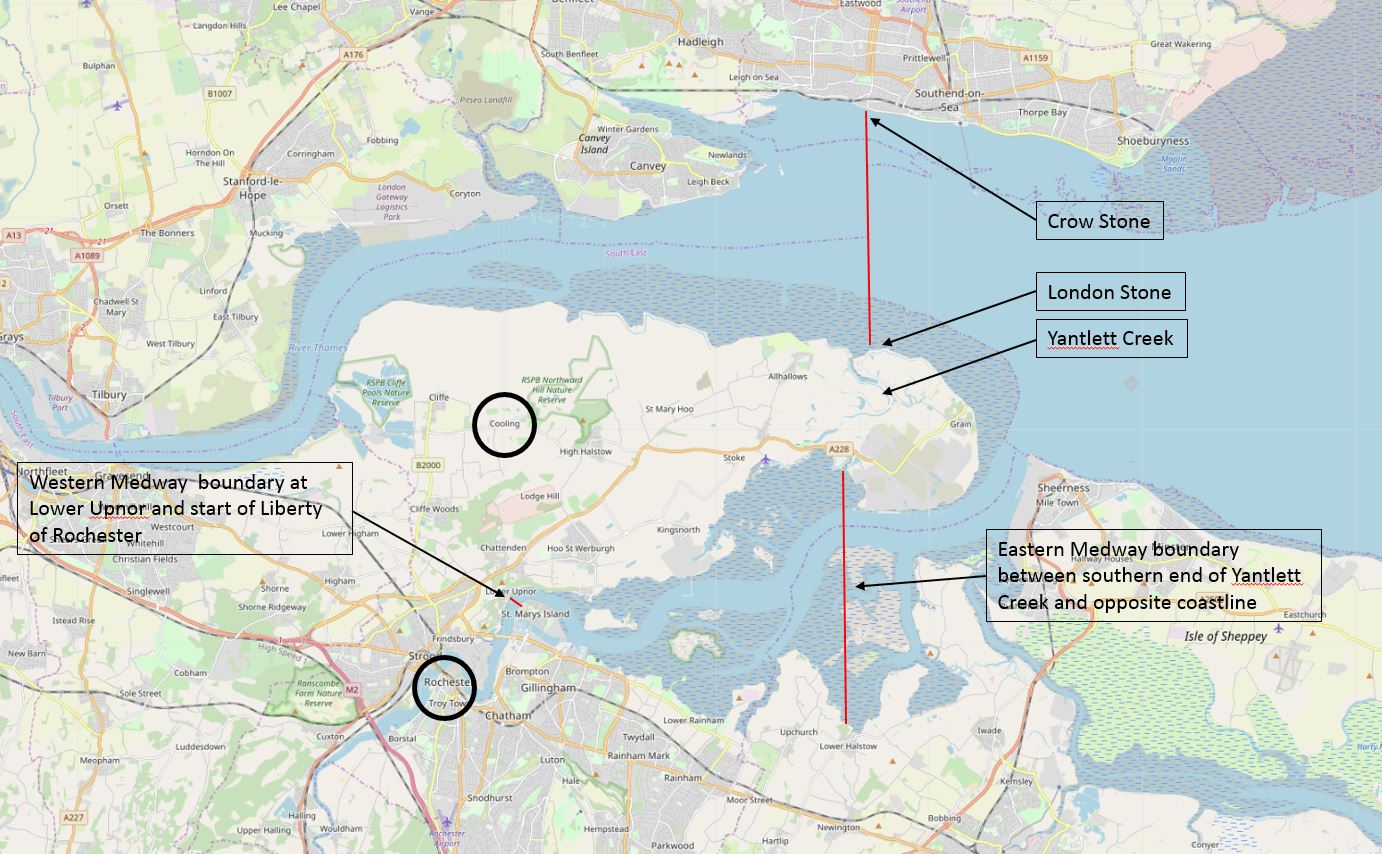
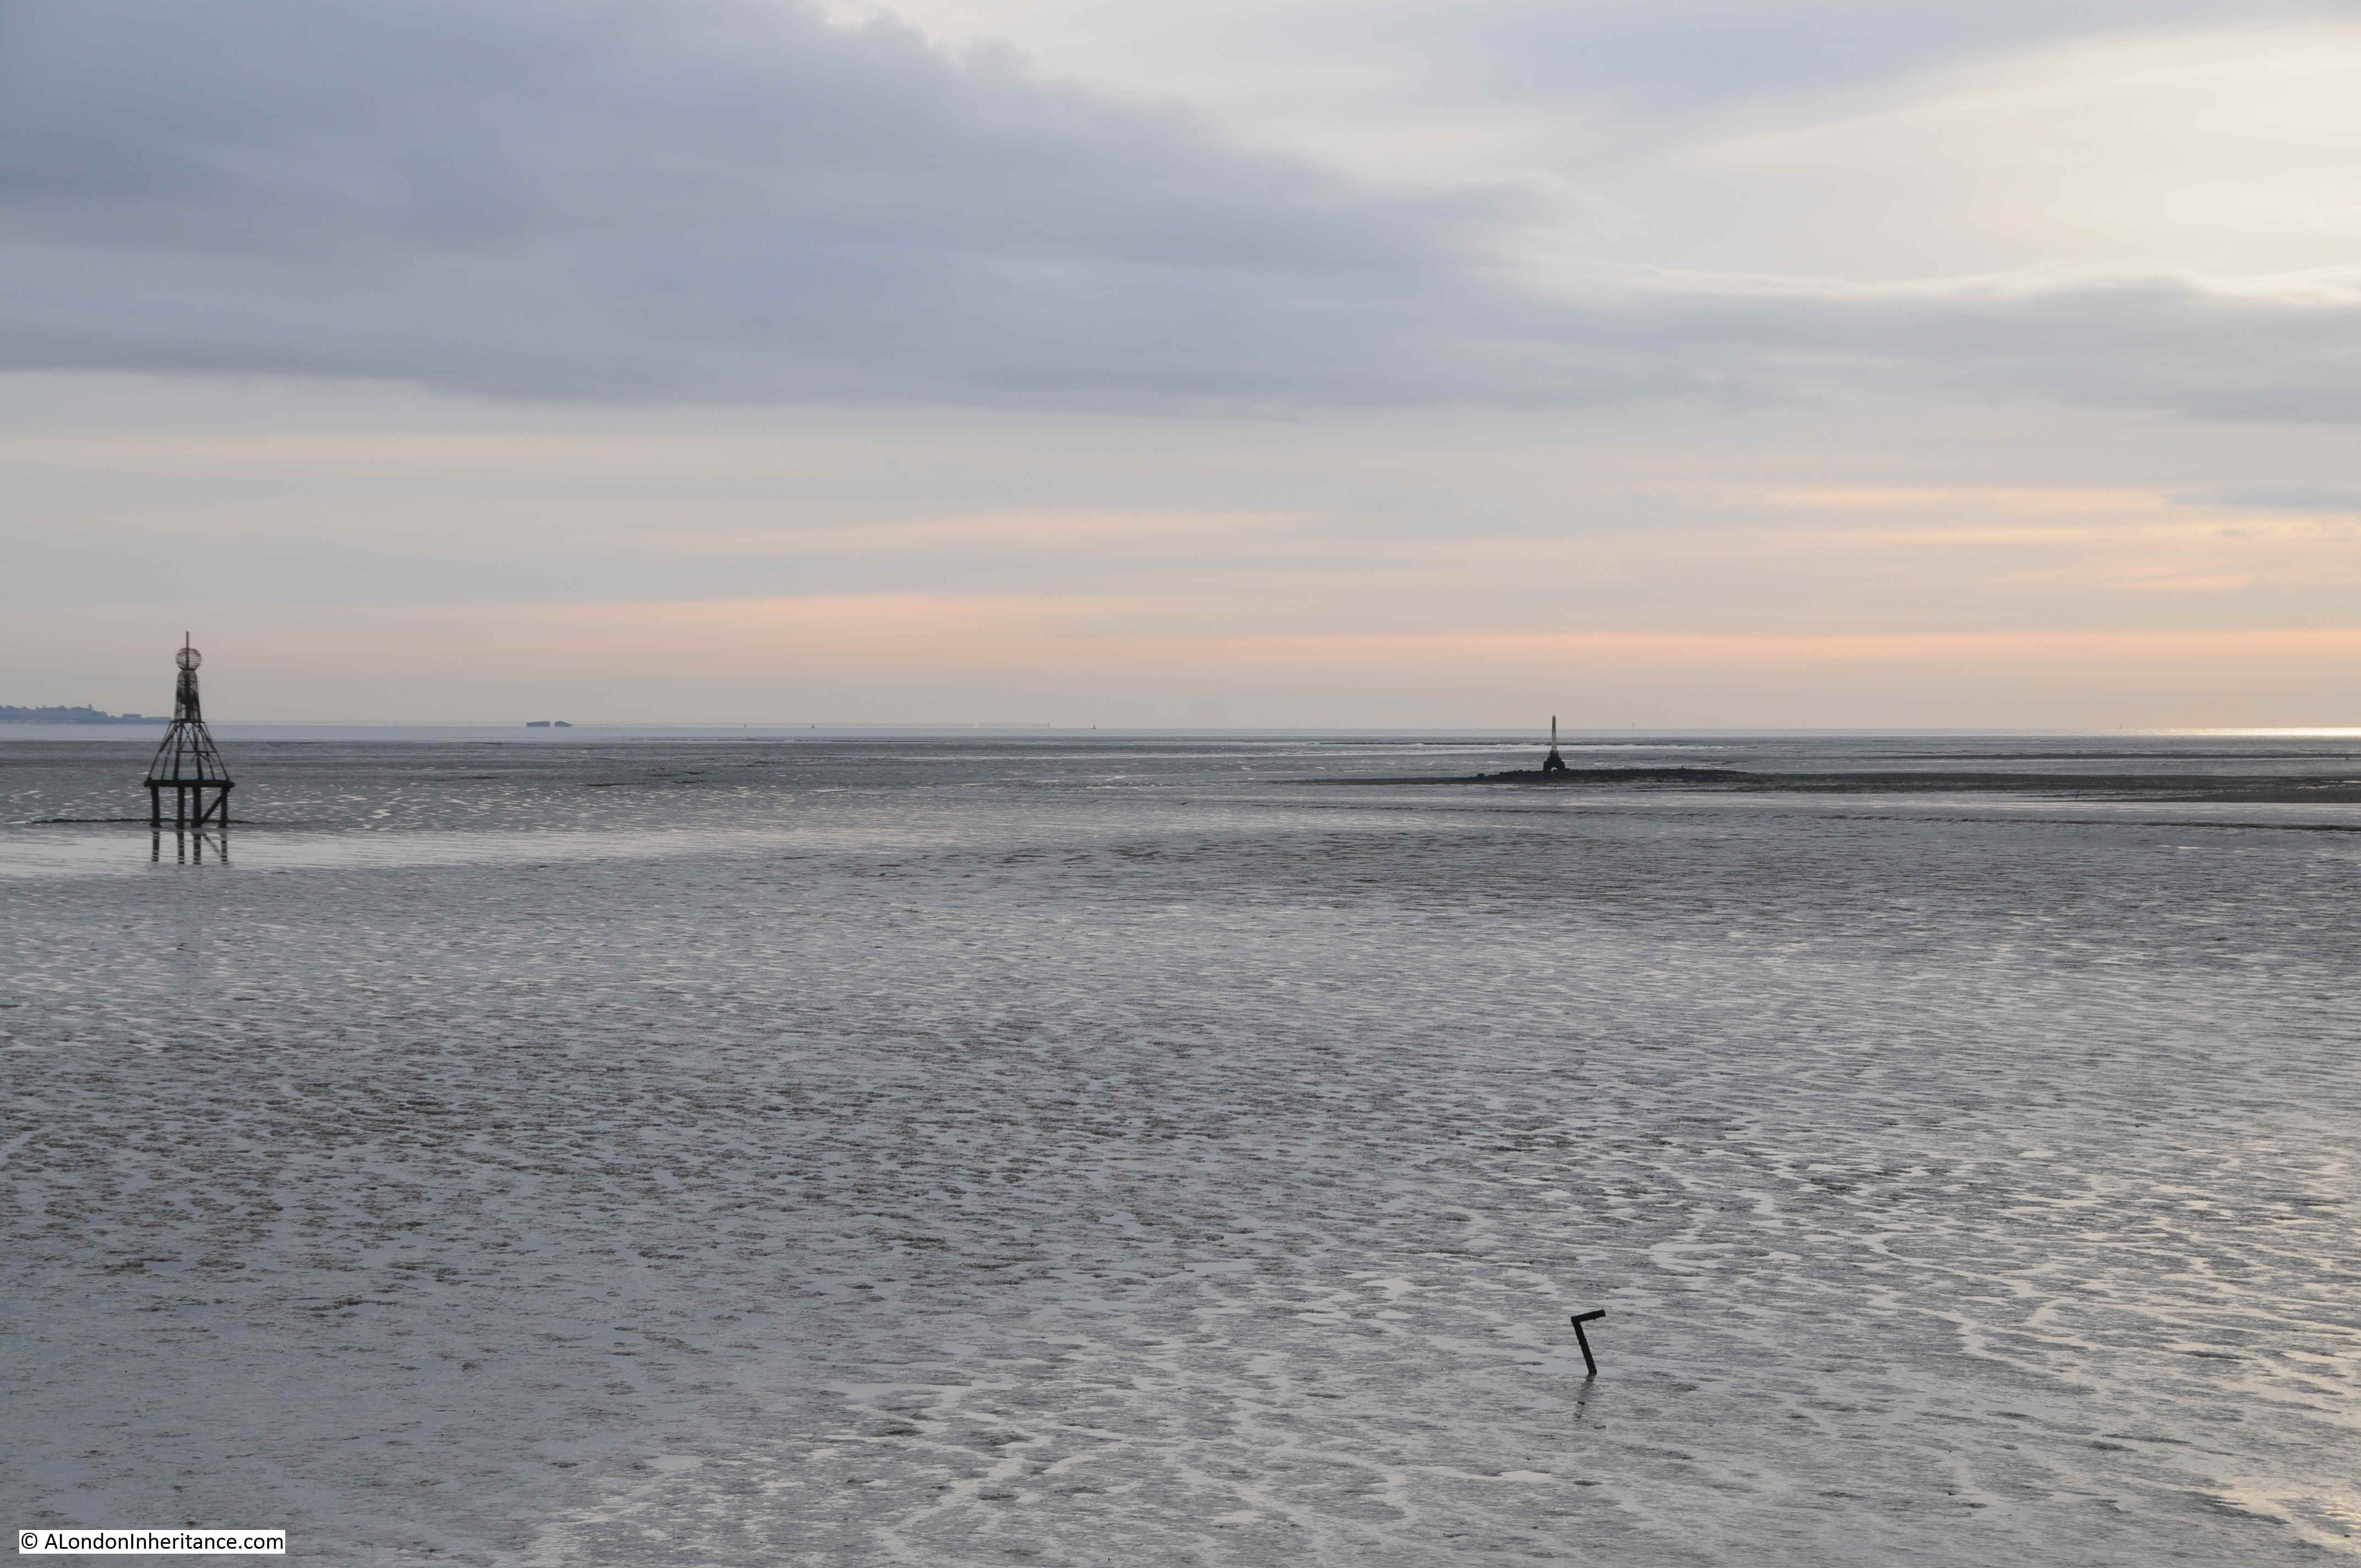
The upper red line shows the City of London’s boundary between the Crow Stone at Southend and the London Stone at Yantlet Creek at the Isle of Grain.
Yantlet Creek did provide a navigable route between the Thames and Medway, and it is this short cut that seems to have formed the basis for the City’s claim over part of the Medway.
The eastern boundary on the Medway was from the southern end of Yantlet Creek to the opposite shore, as shown by the lower red line.
The western boundary on the Medway was at Lower Upnor, a short distance before Rochester, see the short red line on the map. This was where the City of London’s claim over the Medway met the Liberty of Rochester.
The lower black circle on the map highlights the location of Rochester which I will visit in this post, and the upper black circle covers the church of St James at Cooling which I will also visit.
Lower Upnor London Stone
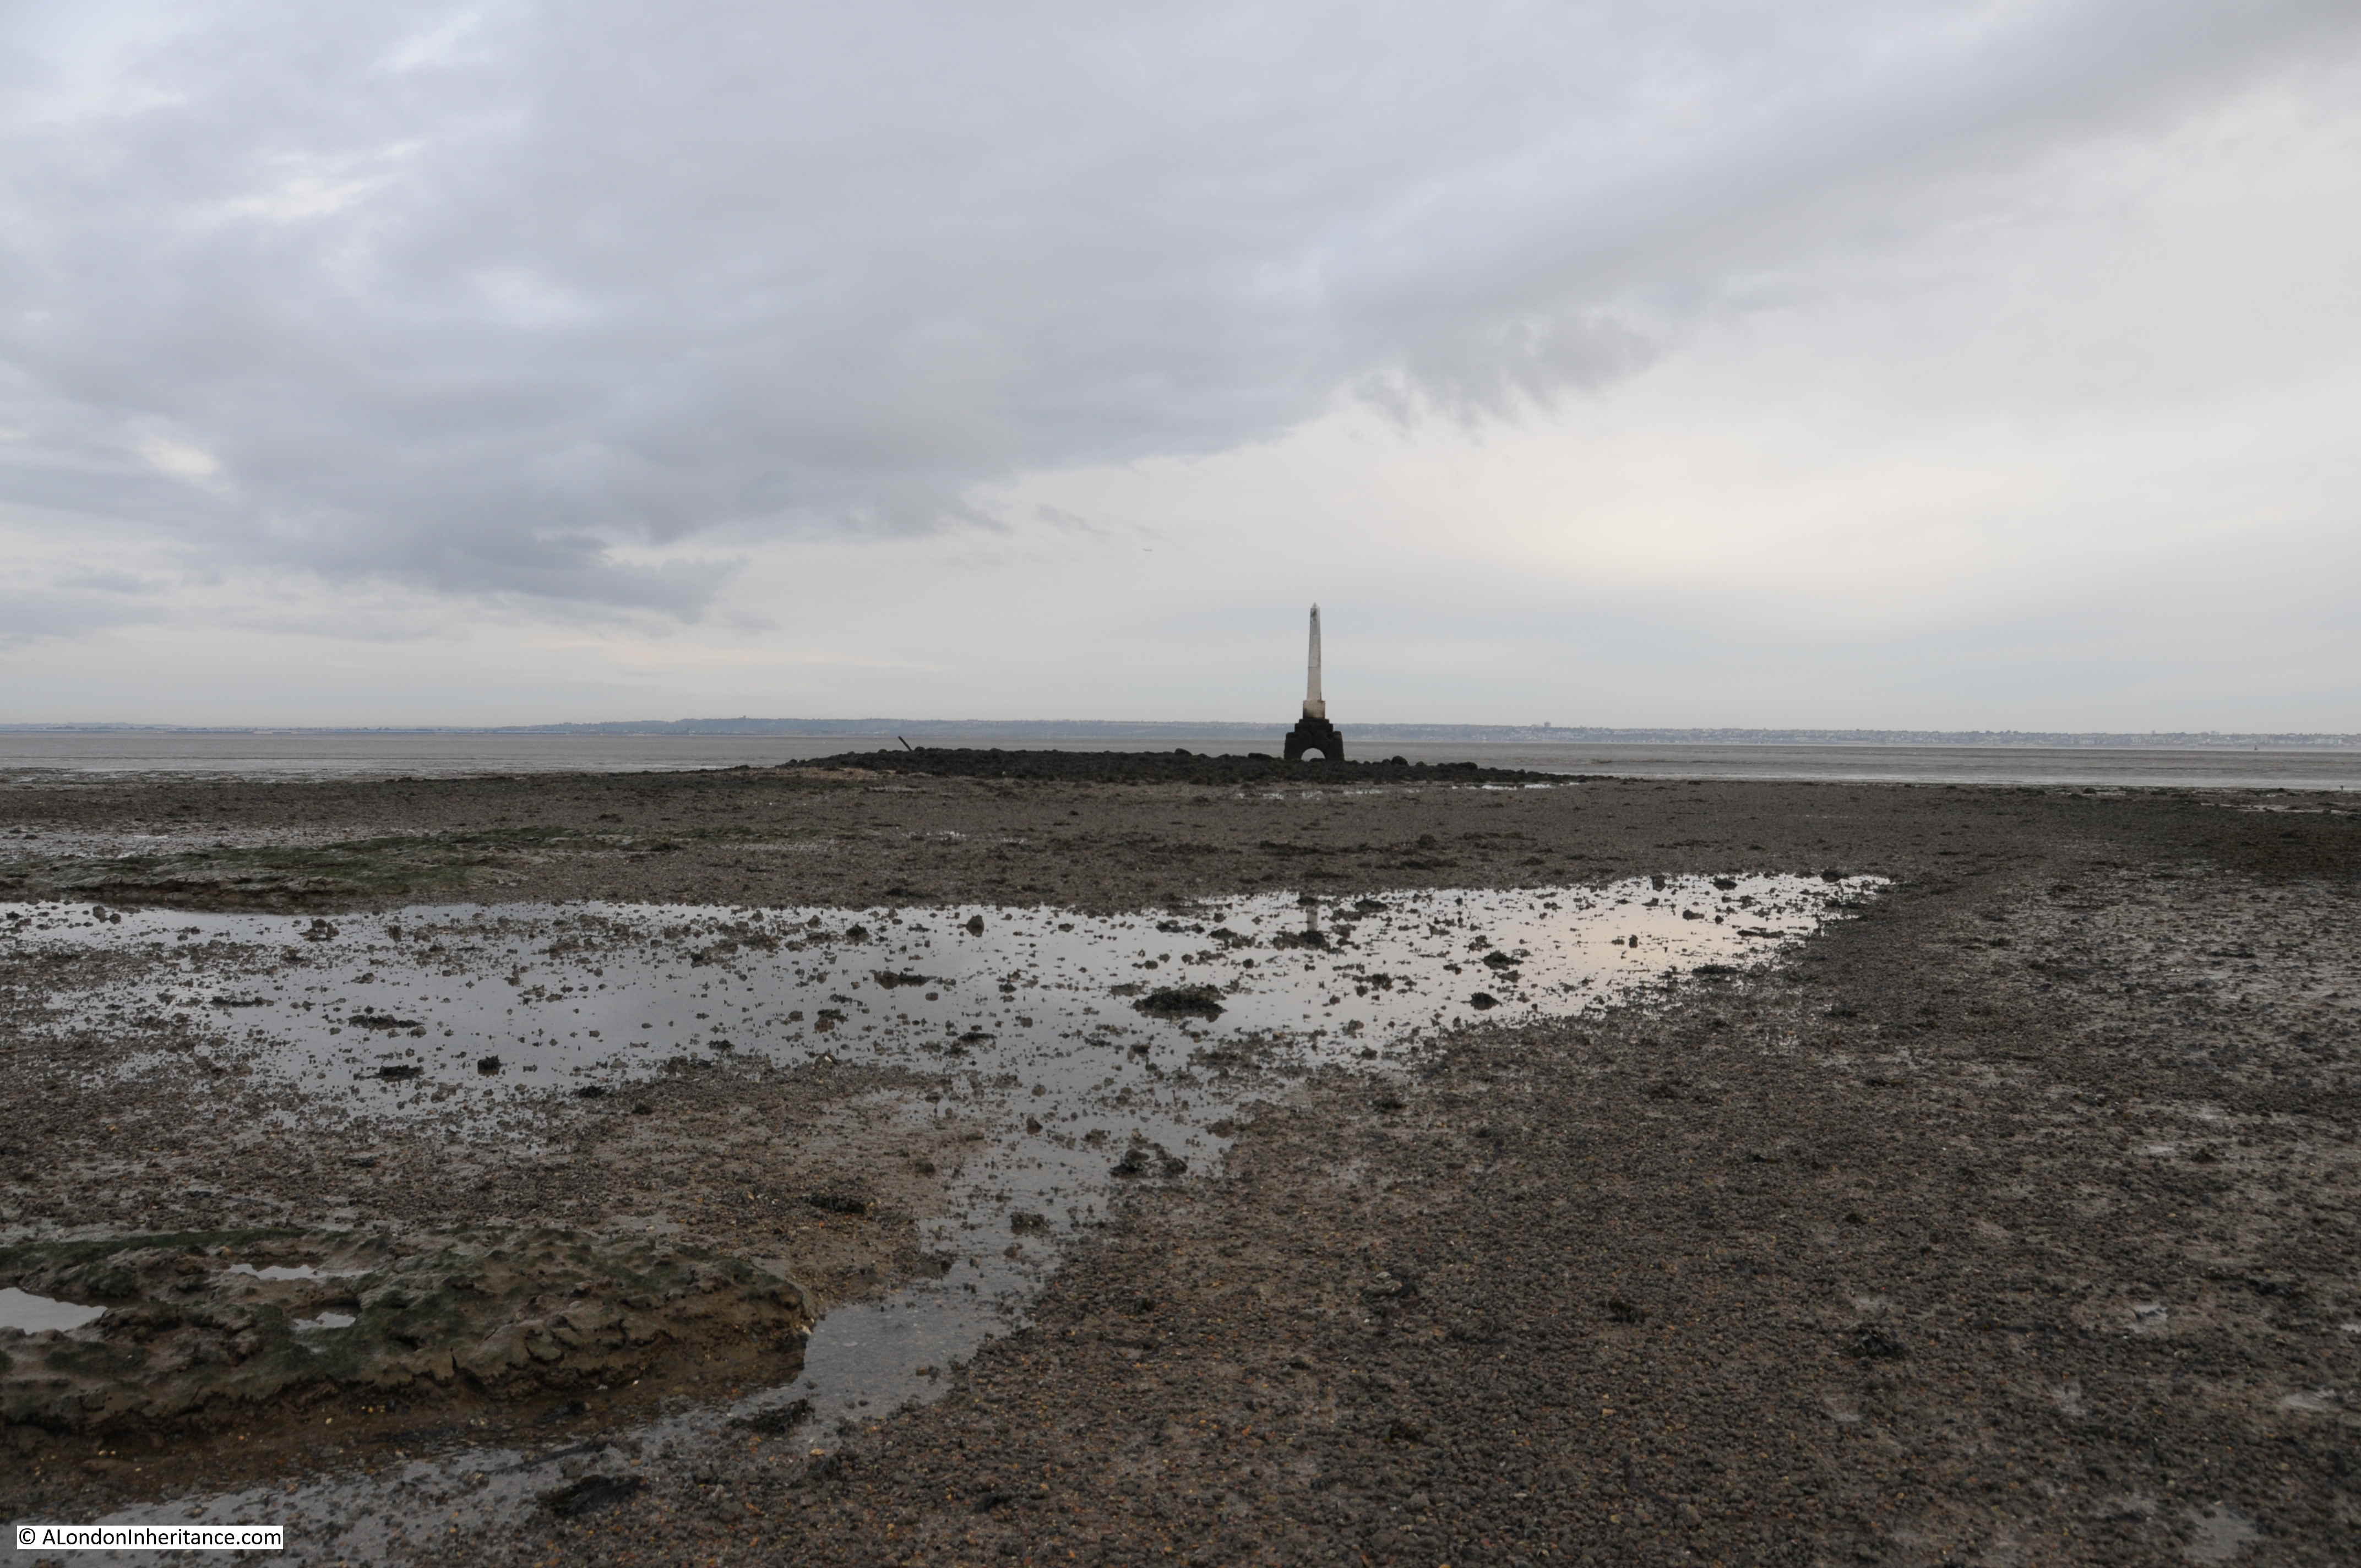
My first stop was at Lower Upnor to find the City of London’s boundary stones:

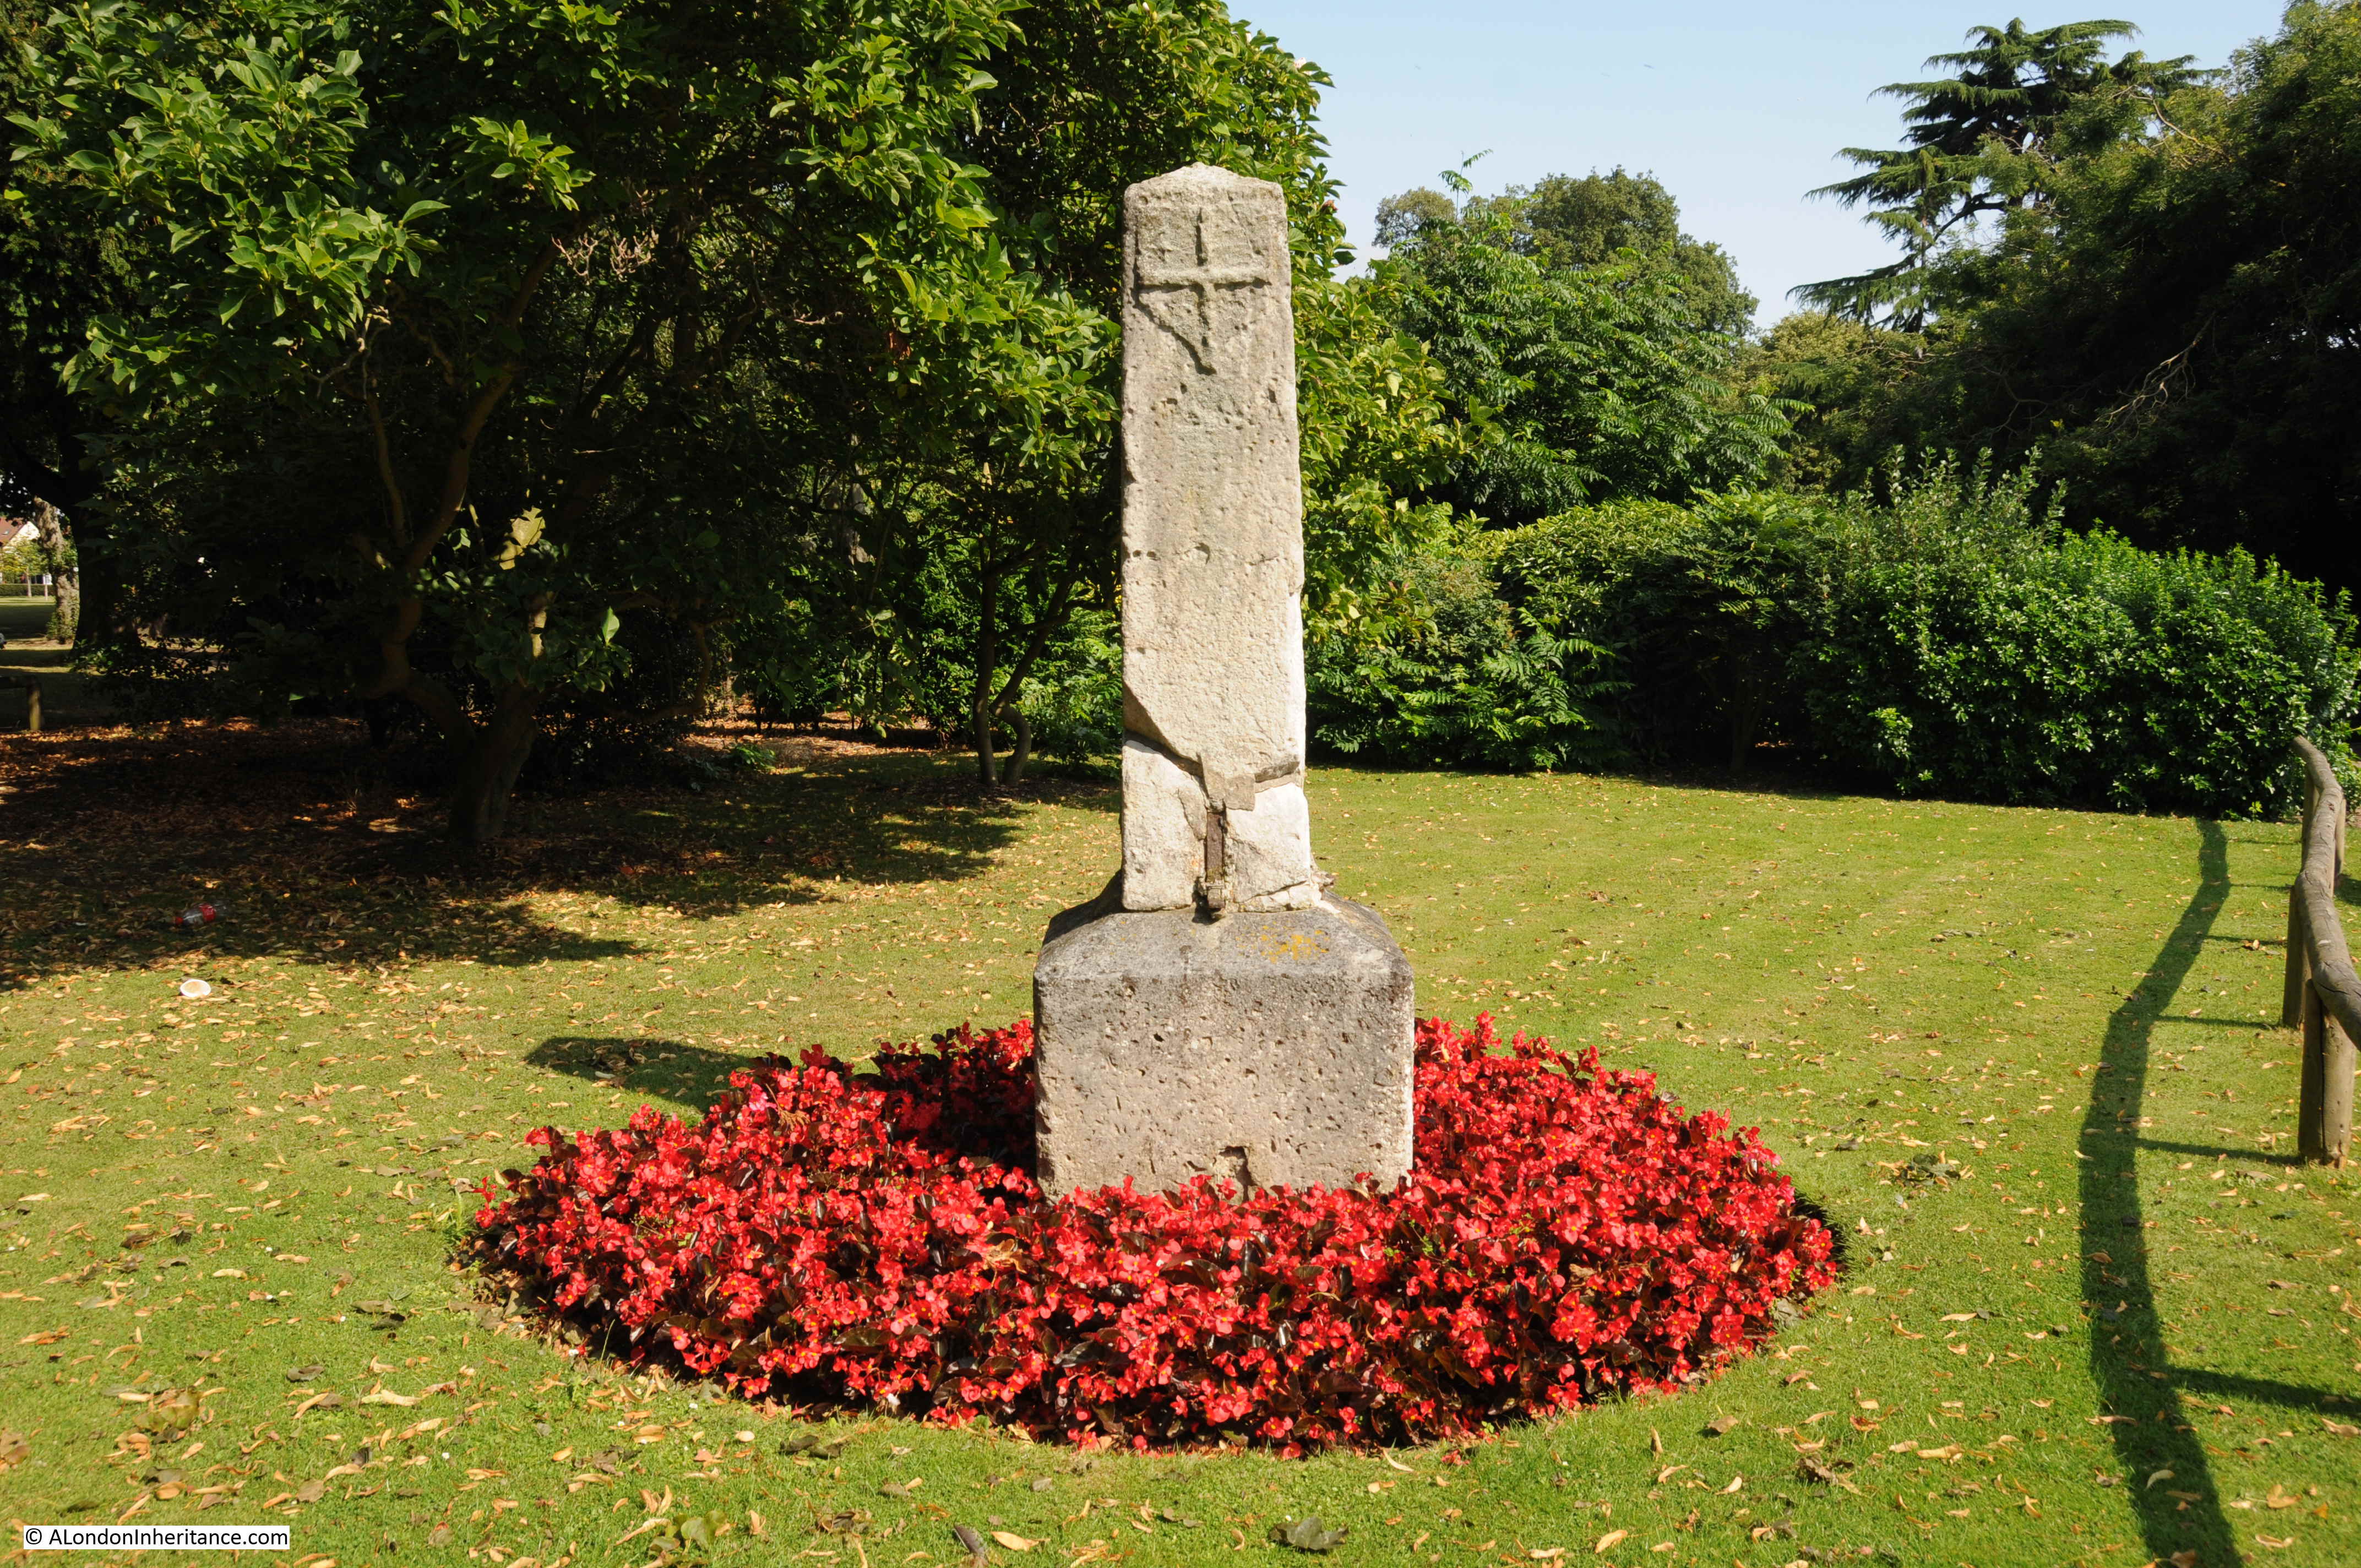
There are two stones marking the City of London’s western boundary at Lower Upnor, on the roadway alongside the River Medway. The smaller stone to the right in the above photo is a footpath marker.
The stone at the rear is the older of the boundary markers and is believed to date from the 18th century.
The year 1204 is carved at the top of the stone. The refers to the original charter which granted rights over the River Thames, given by King John to the City of London, although the charter was dated a couple of years before 1204.
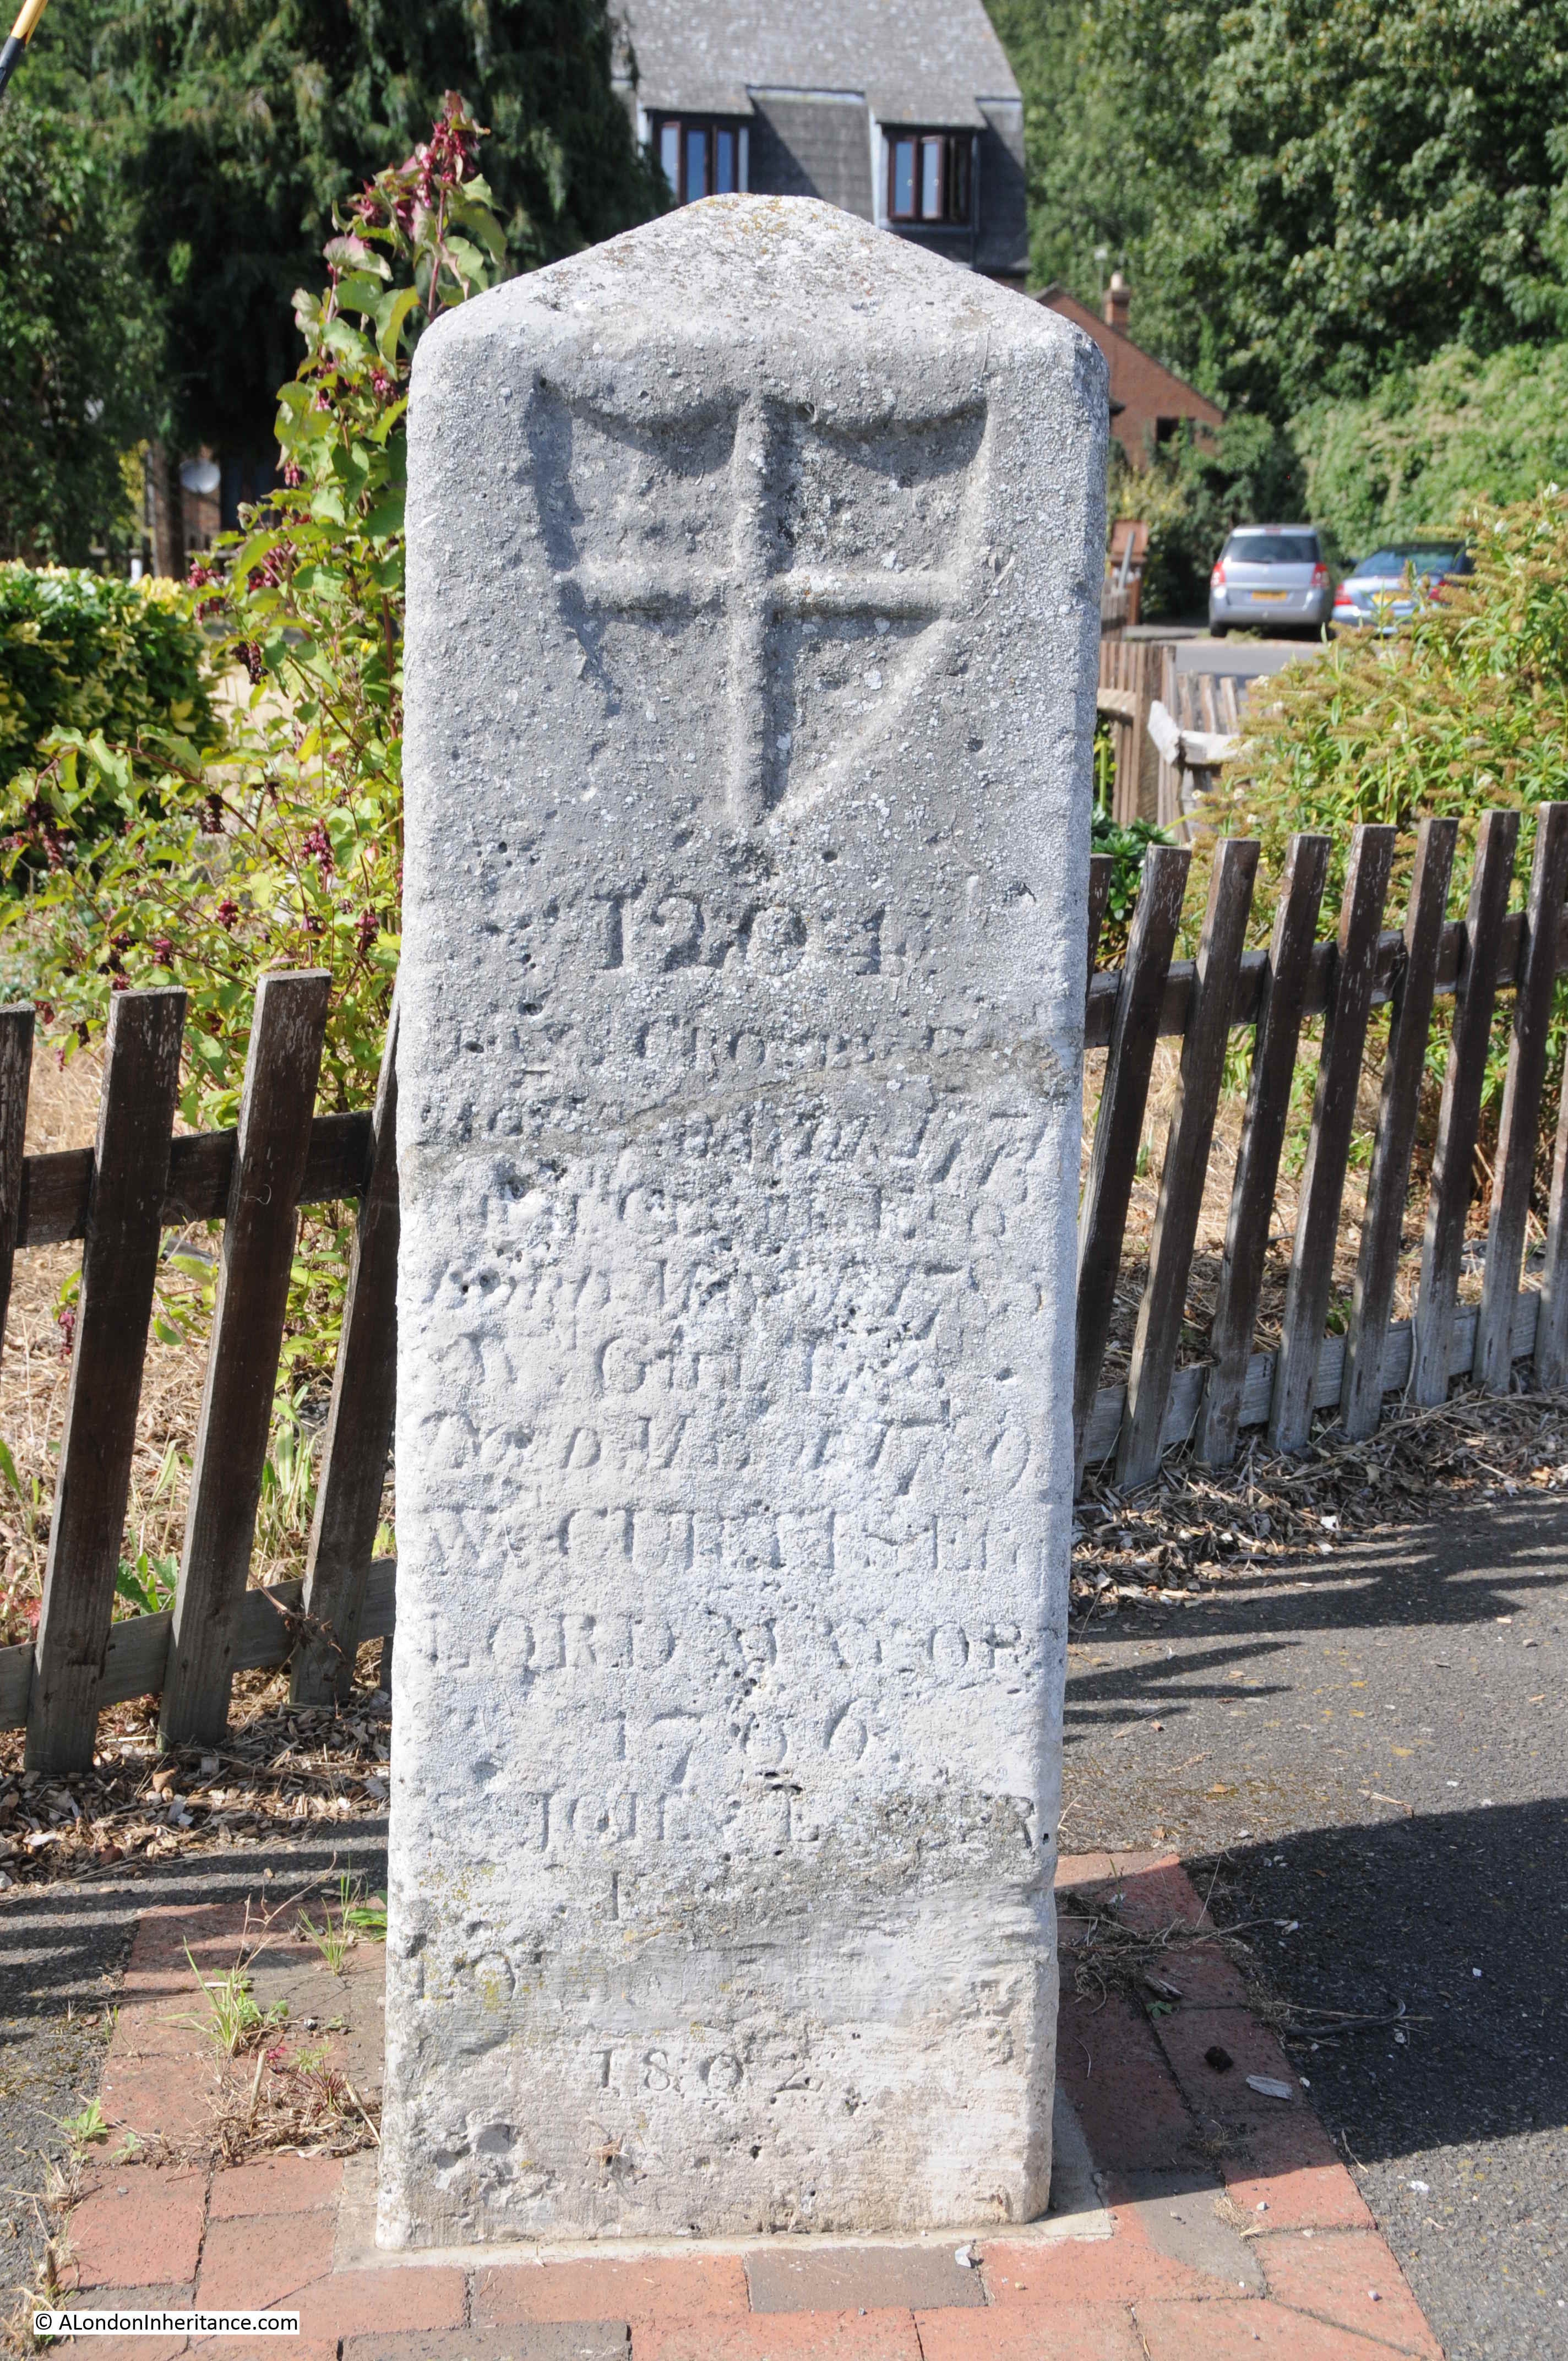
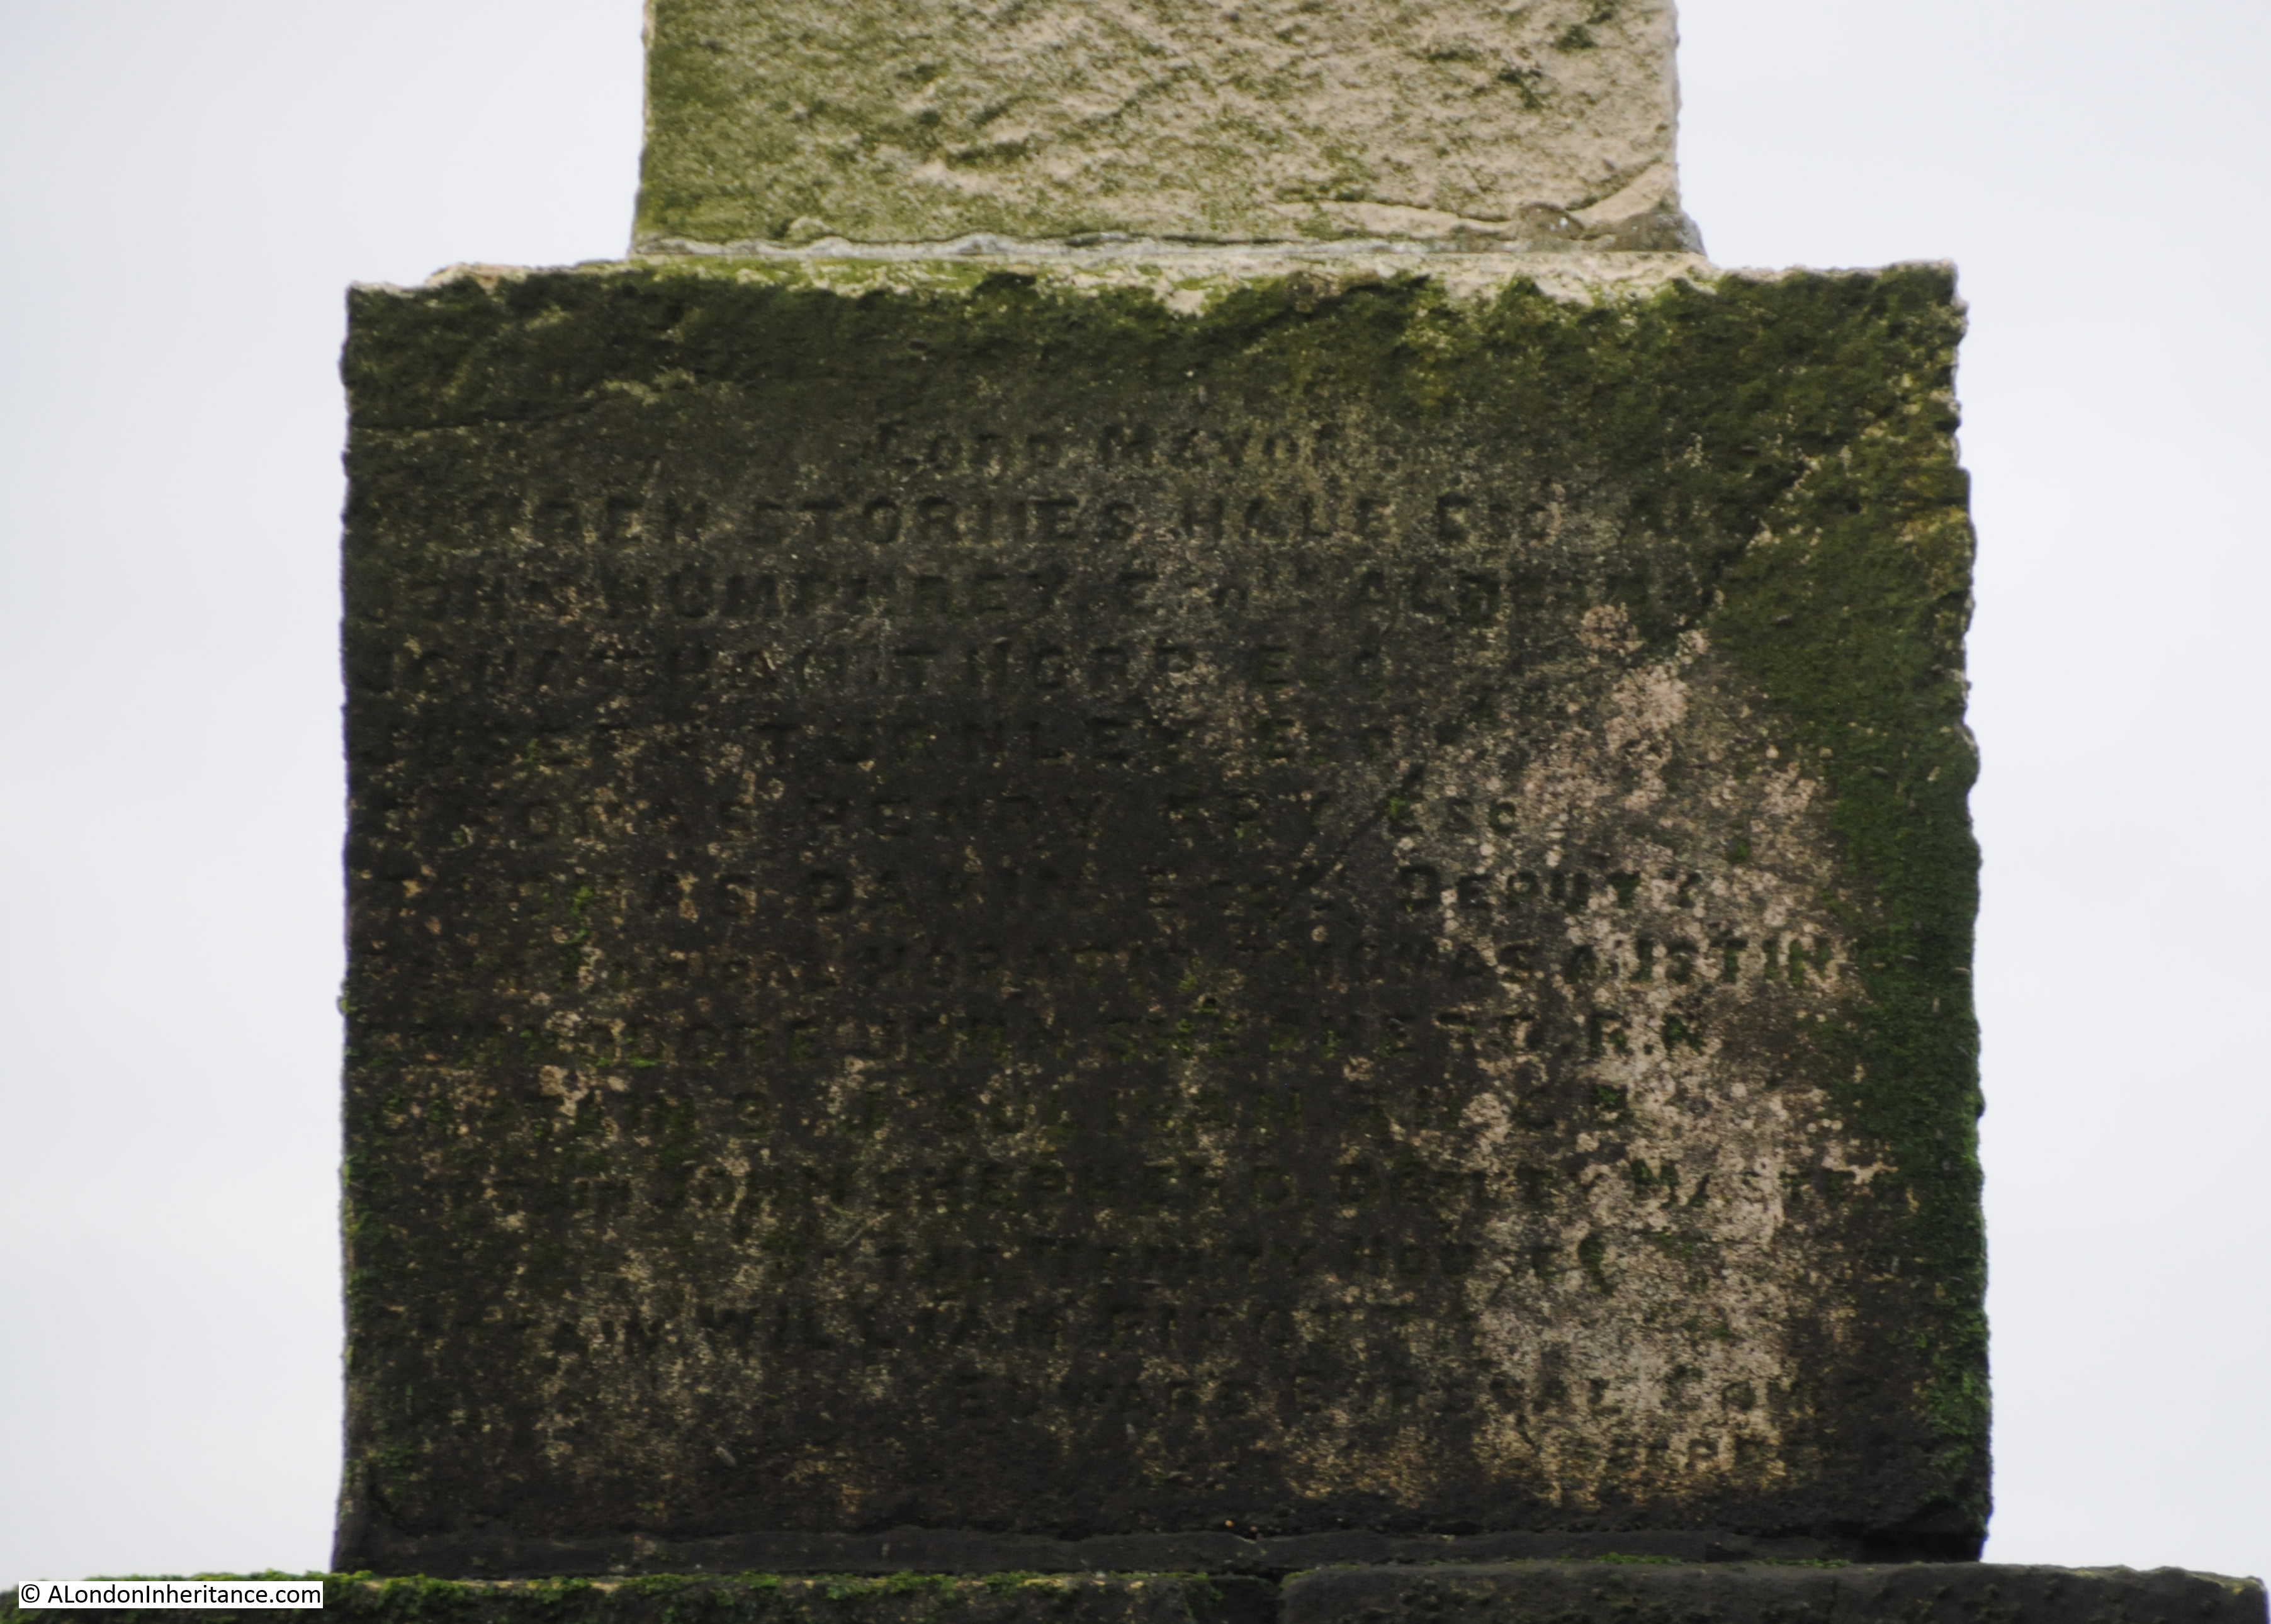
The City of London’s crest is also on the front of the stone, and on the rear is the legend “God Preserve the City of London”.
This section of the Medway has a rather strange history, and at times it was a very contentious issue that the City of London regarded the stretch from Yantlet Creek to Lower Upnor as within their jurisdiction.
As one point, a local landowner’s name was carved into the boundary marker stone to replace the City’s claims. This was discovered on one of the routine visits of the Lord Mayor to the stone, to re-assert the City’s claims.
The following print is dated 1830 and is titled “View of Upnor Castle near Chatham, Kent, with boats on the River Thames and figures on the river bank in the foreground“. Upnor Castle is further to the west of the boundary stone, close to Rochester, yet the print references this being on the River Thames.
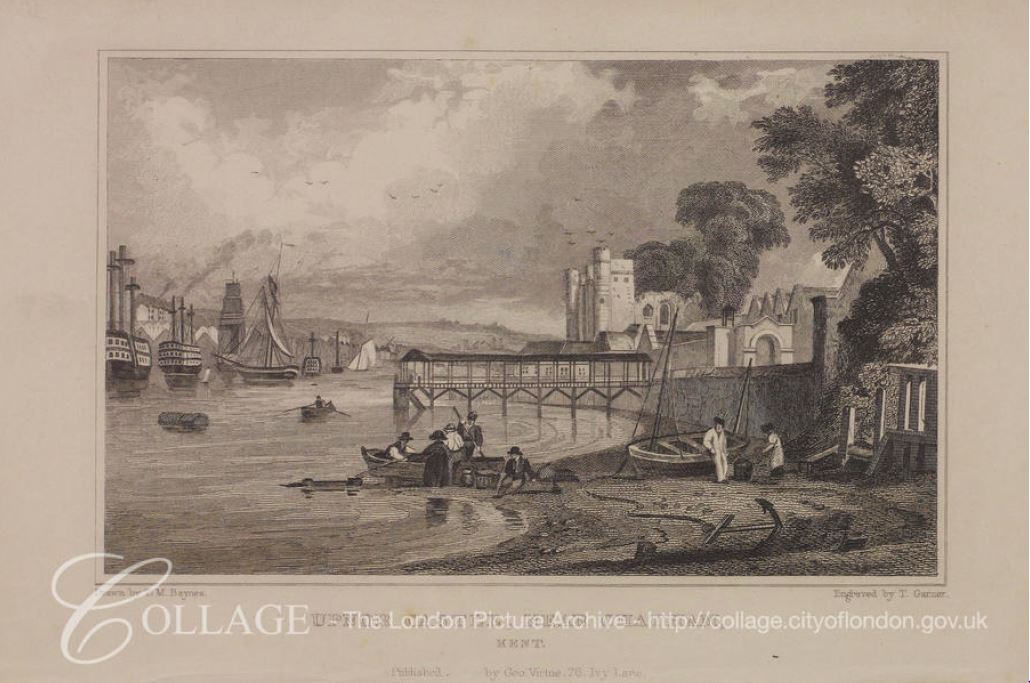
Image credit: London Metropolitan Archives, City of London: catalogue ref: k124617x
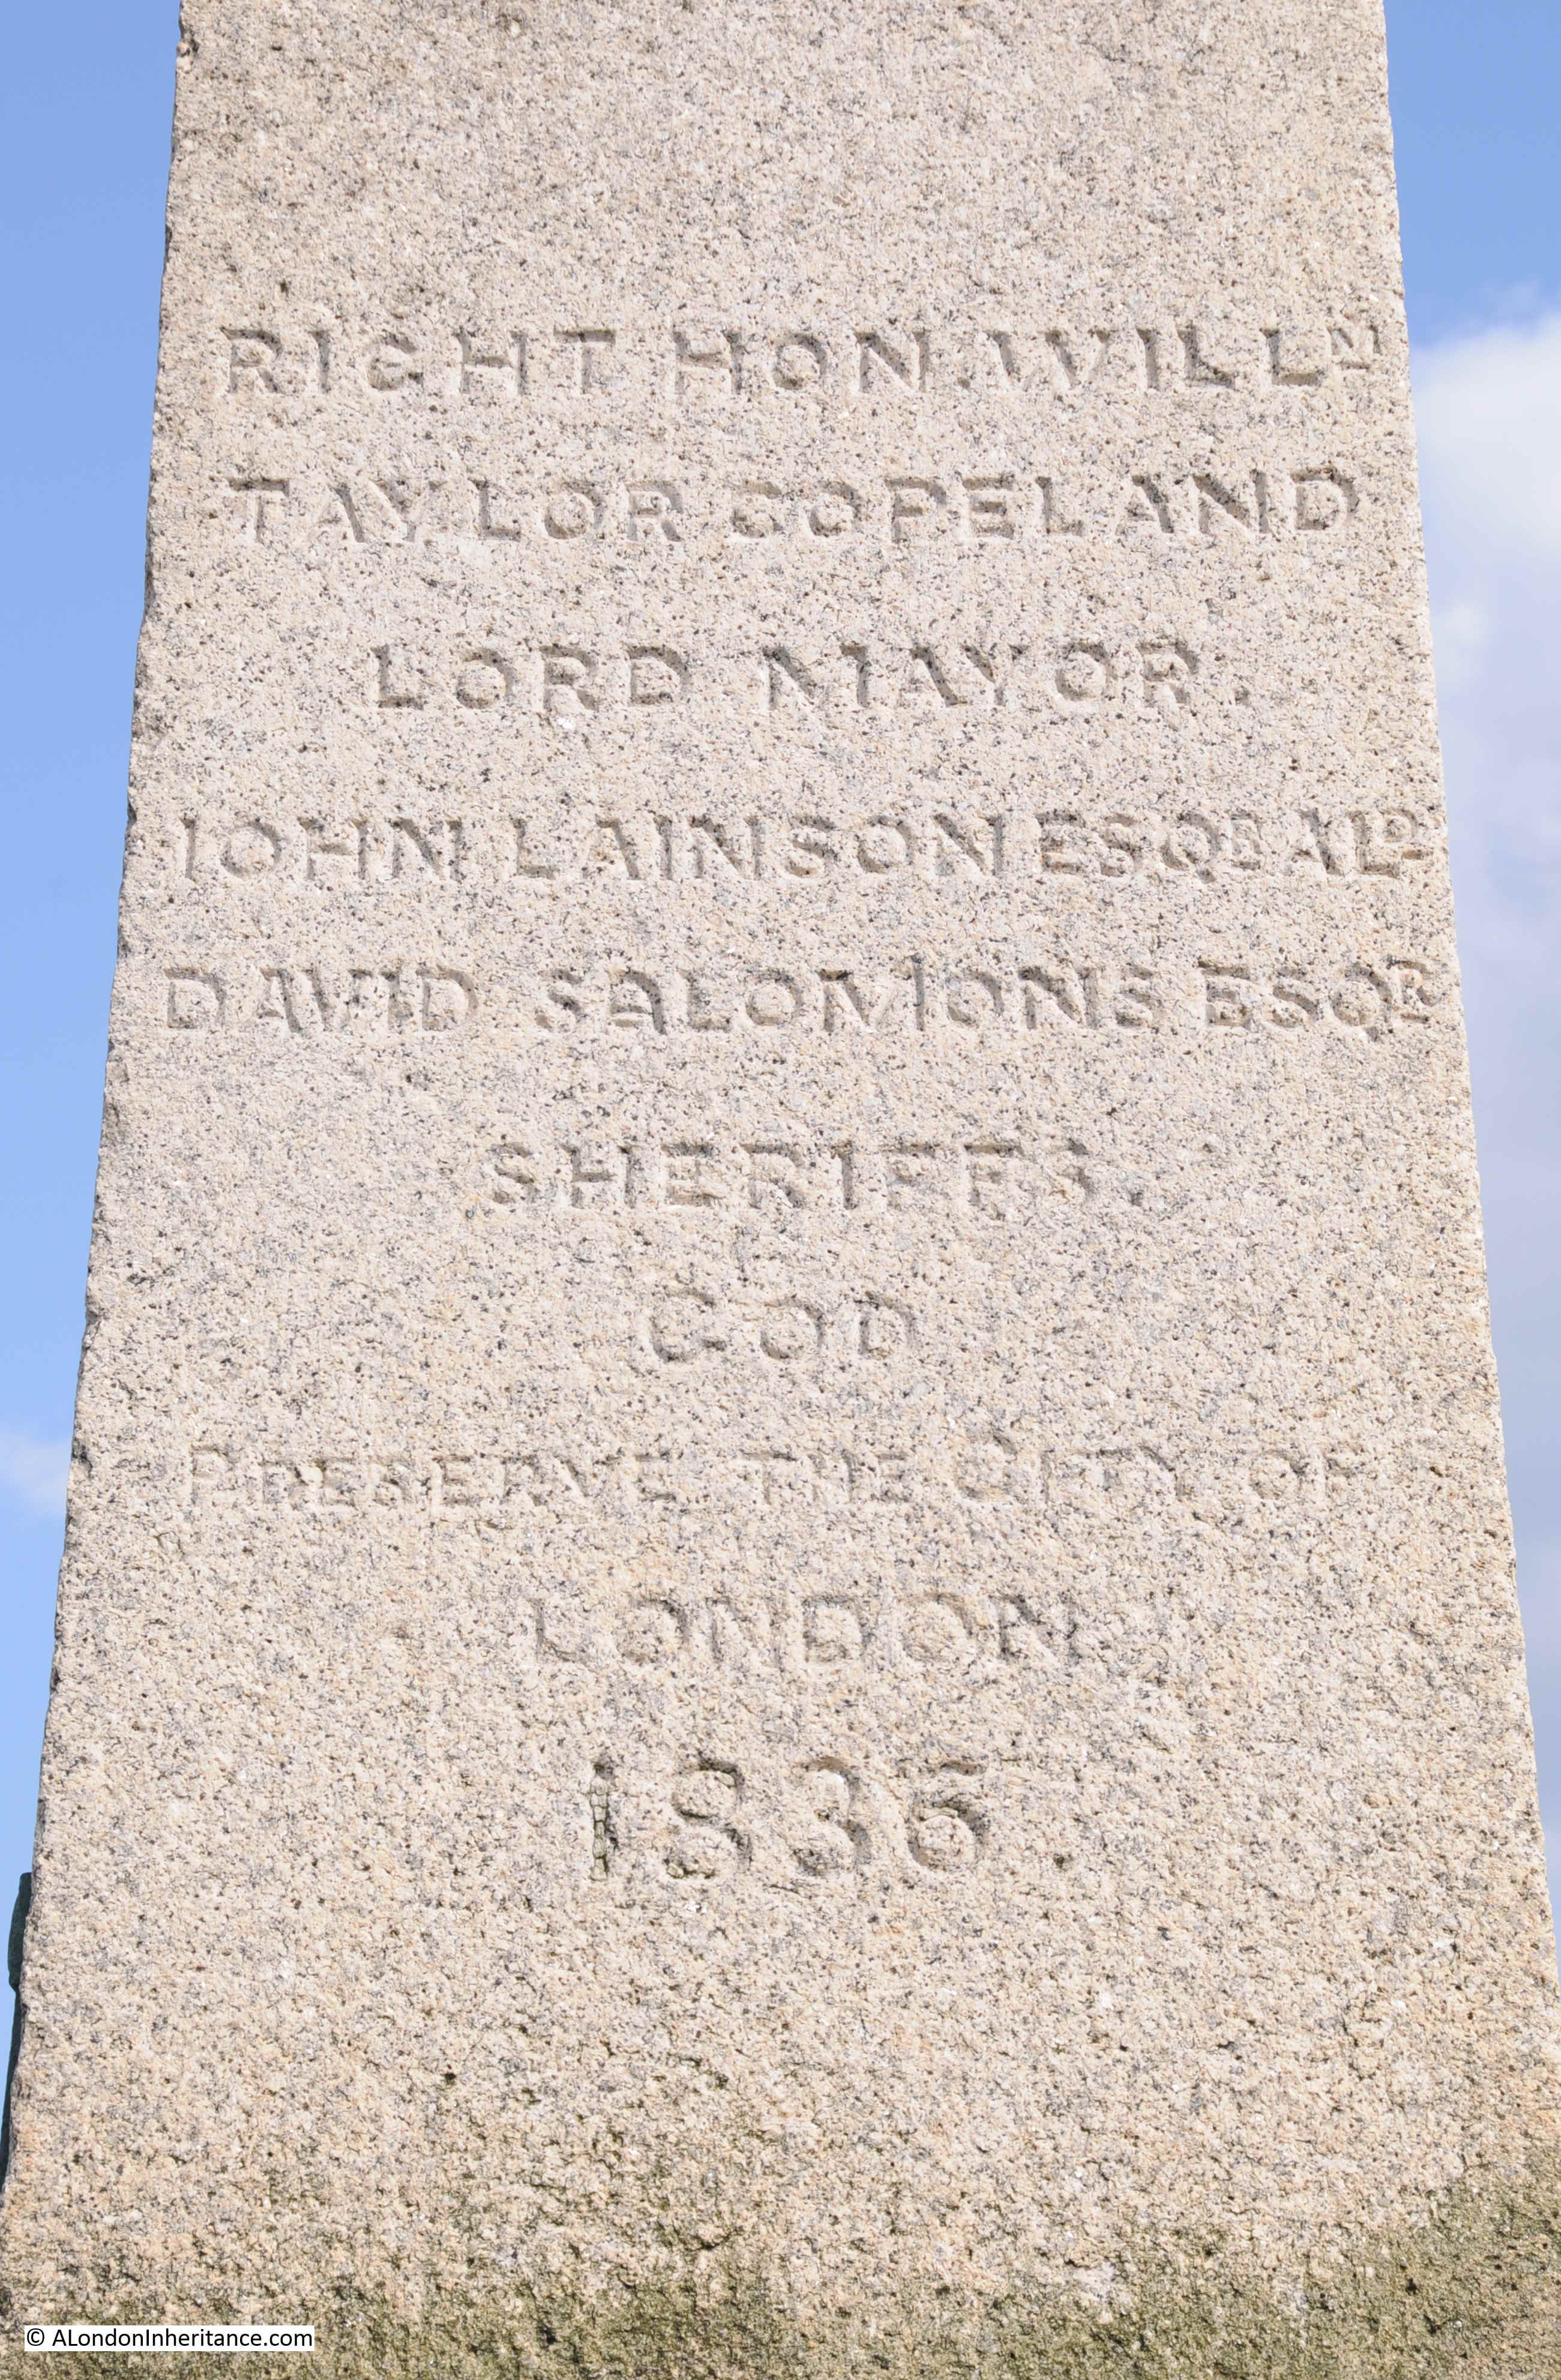
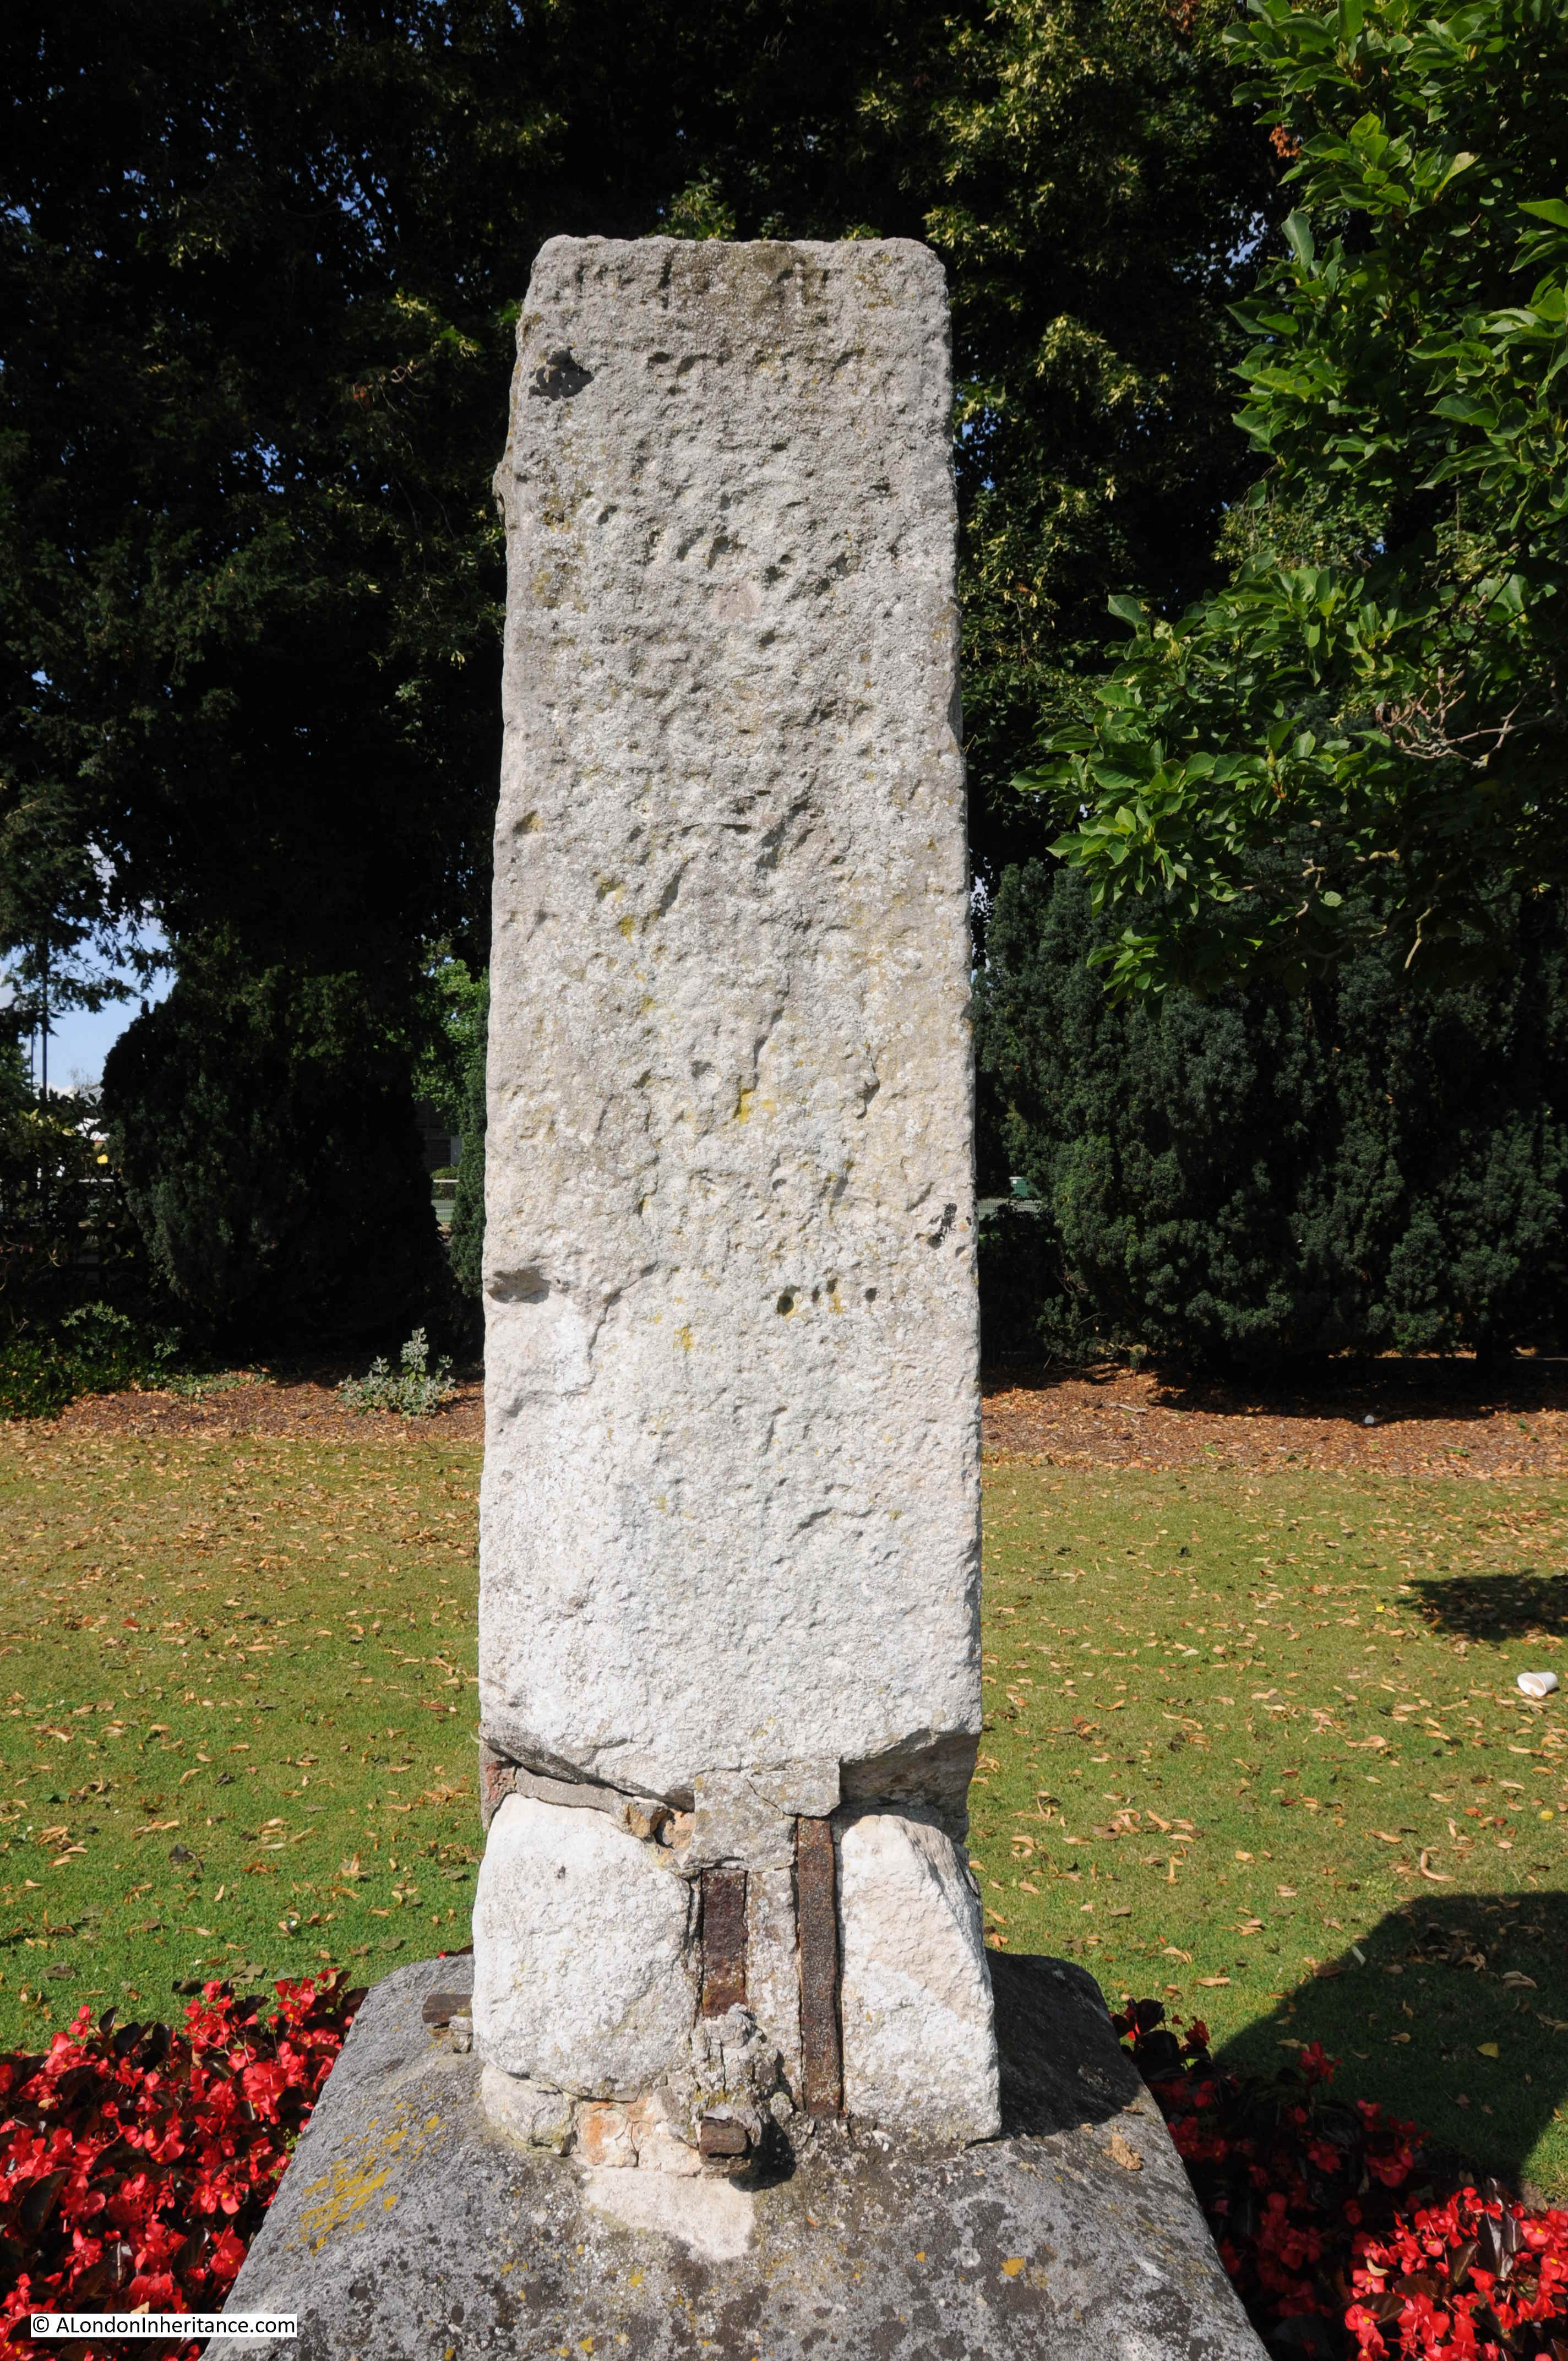
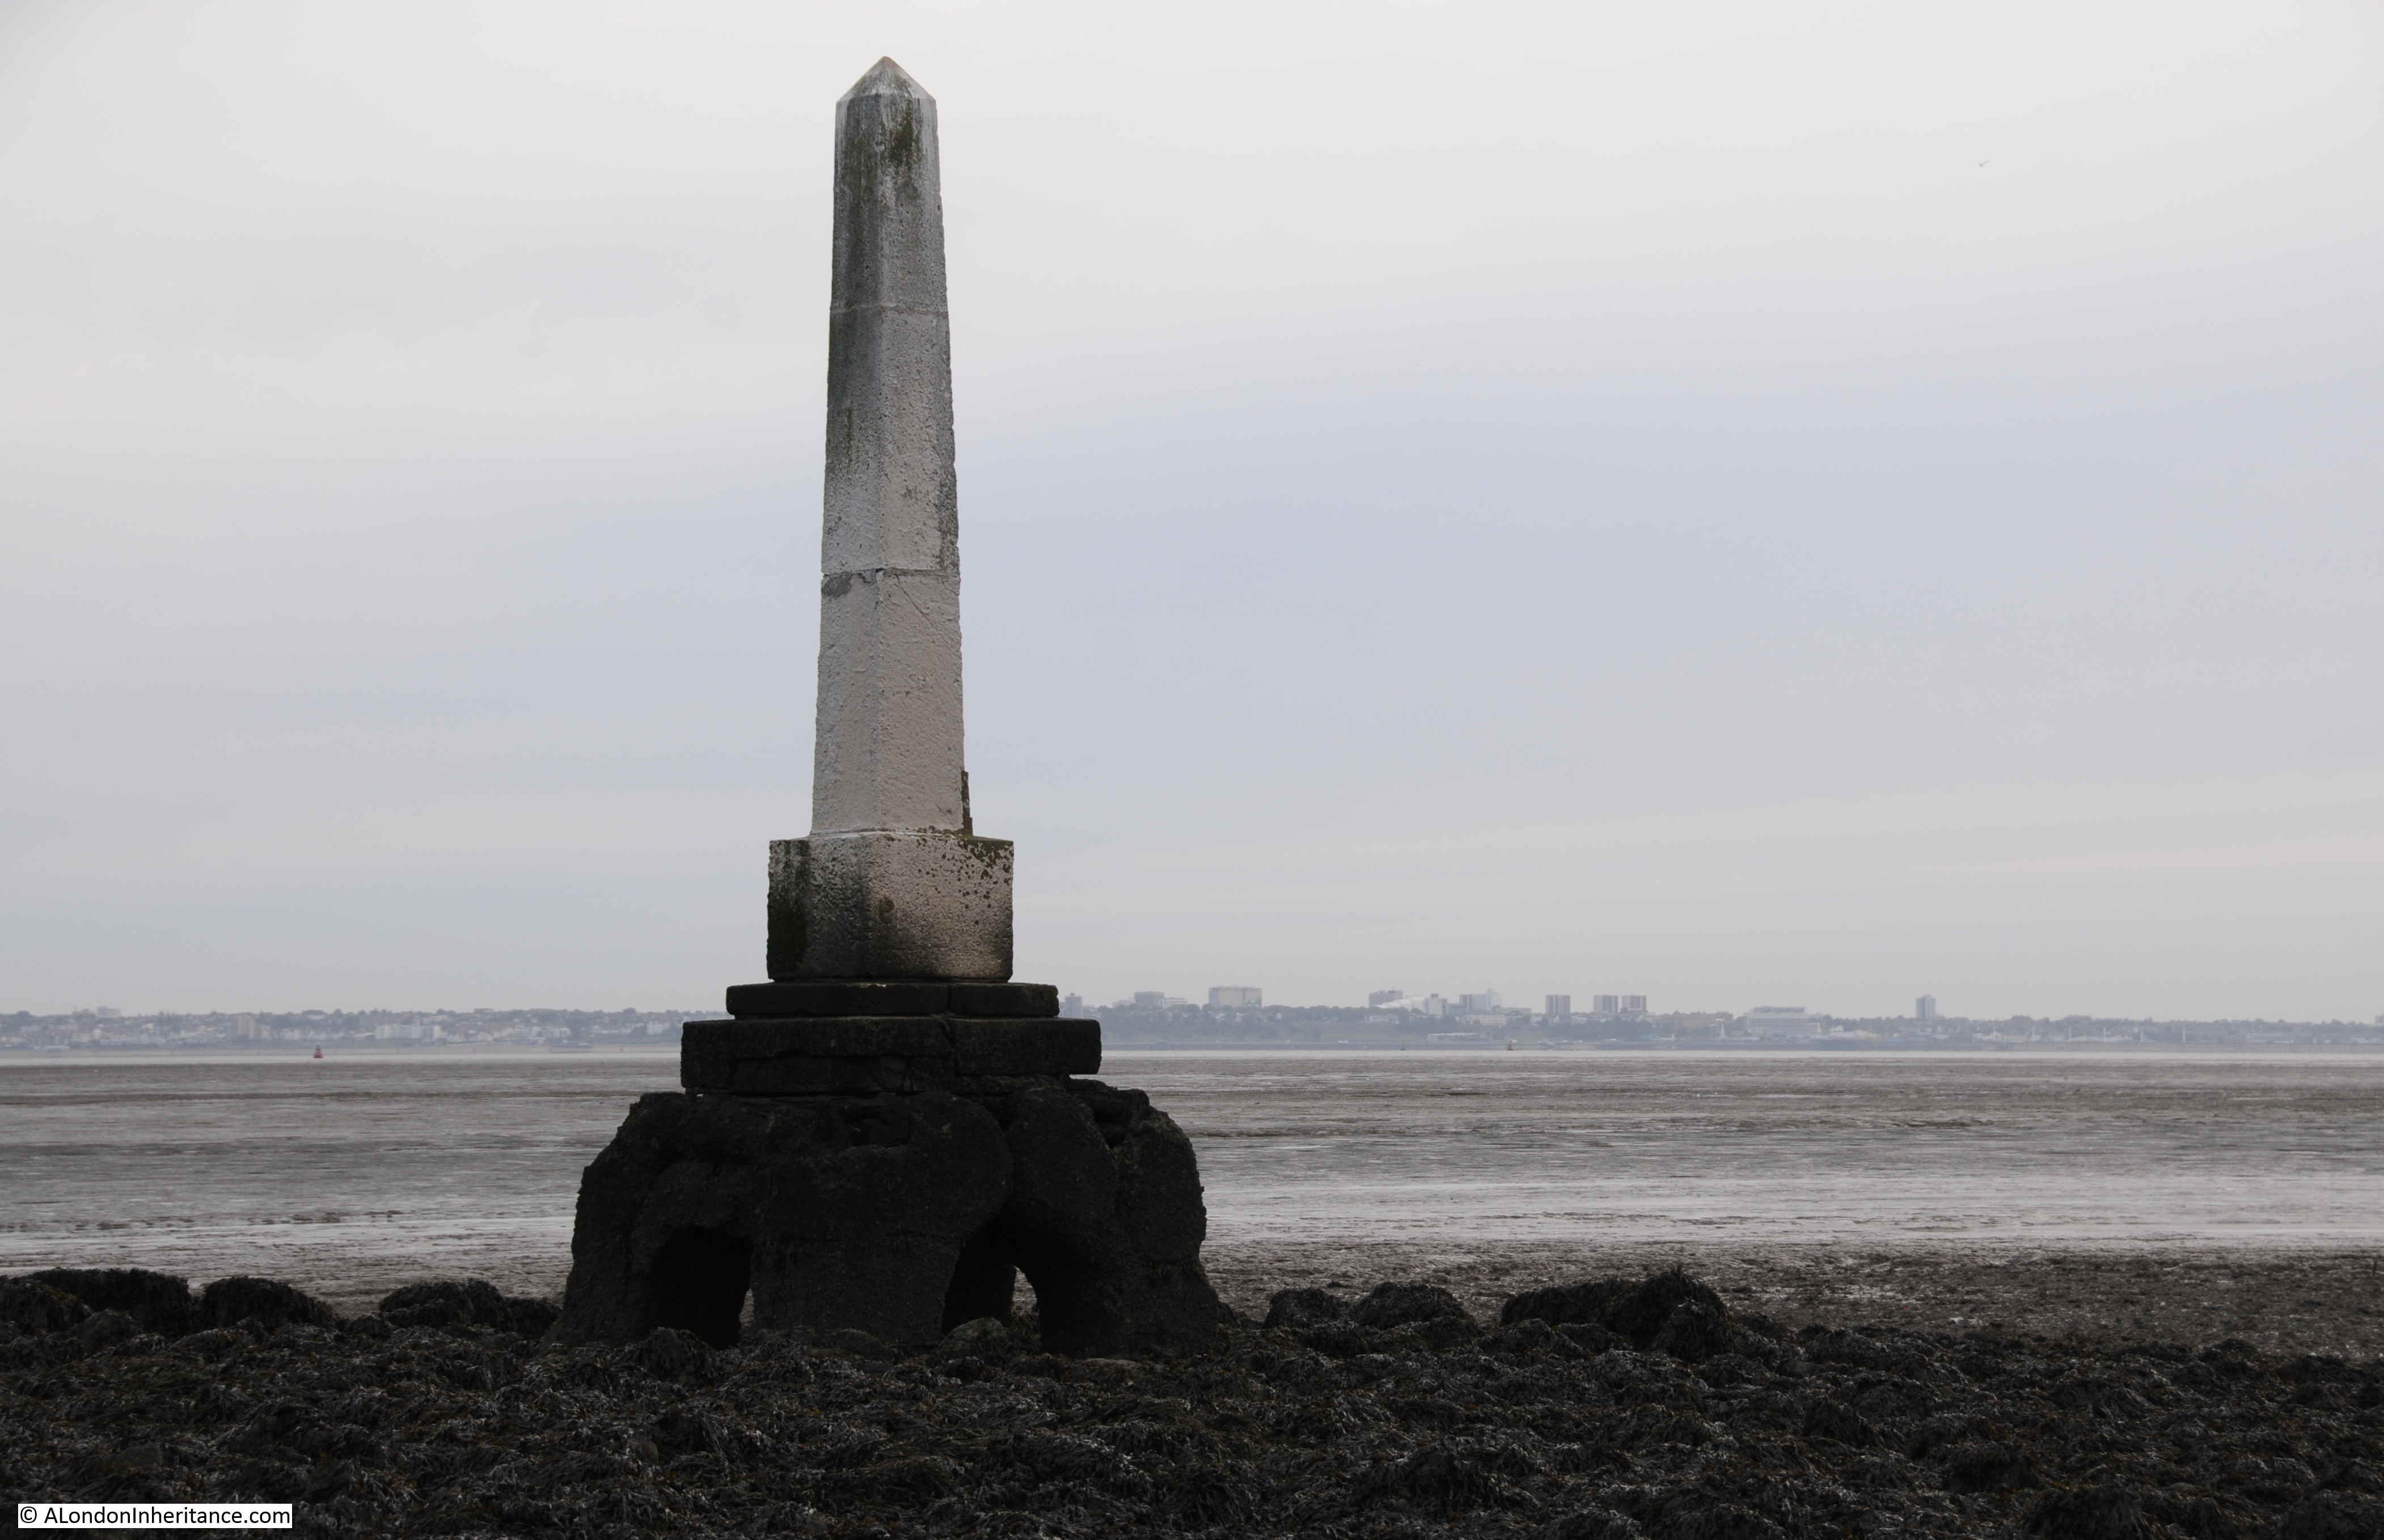
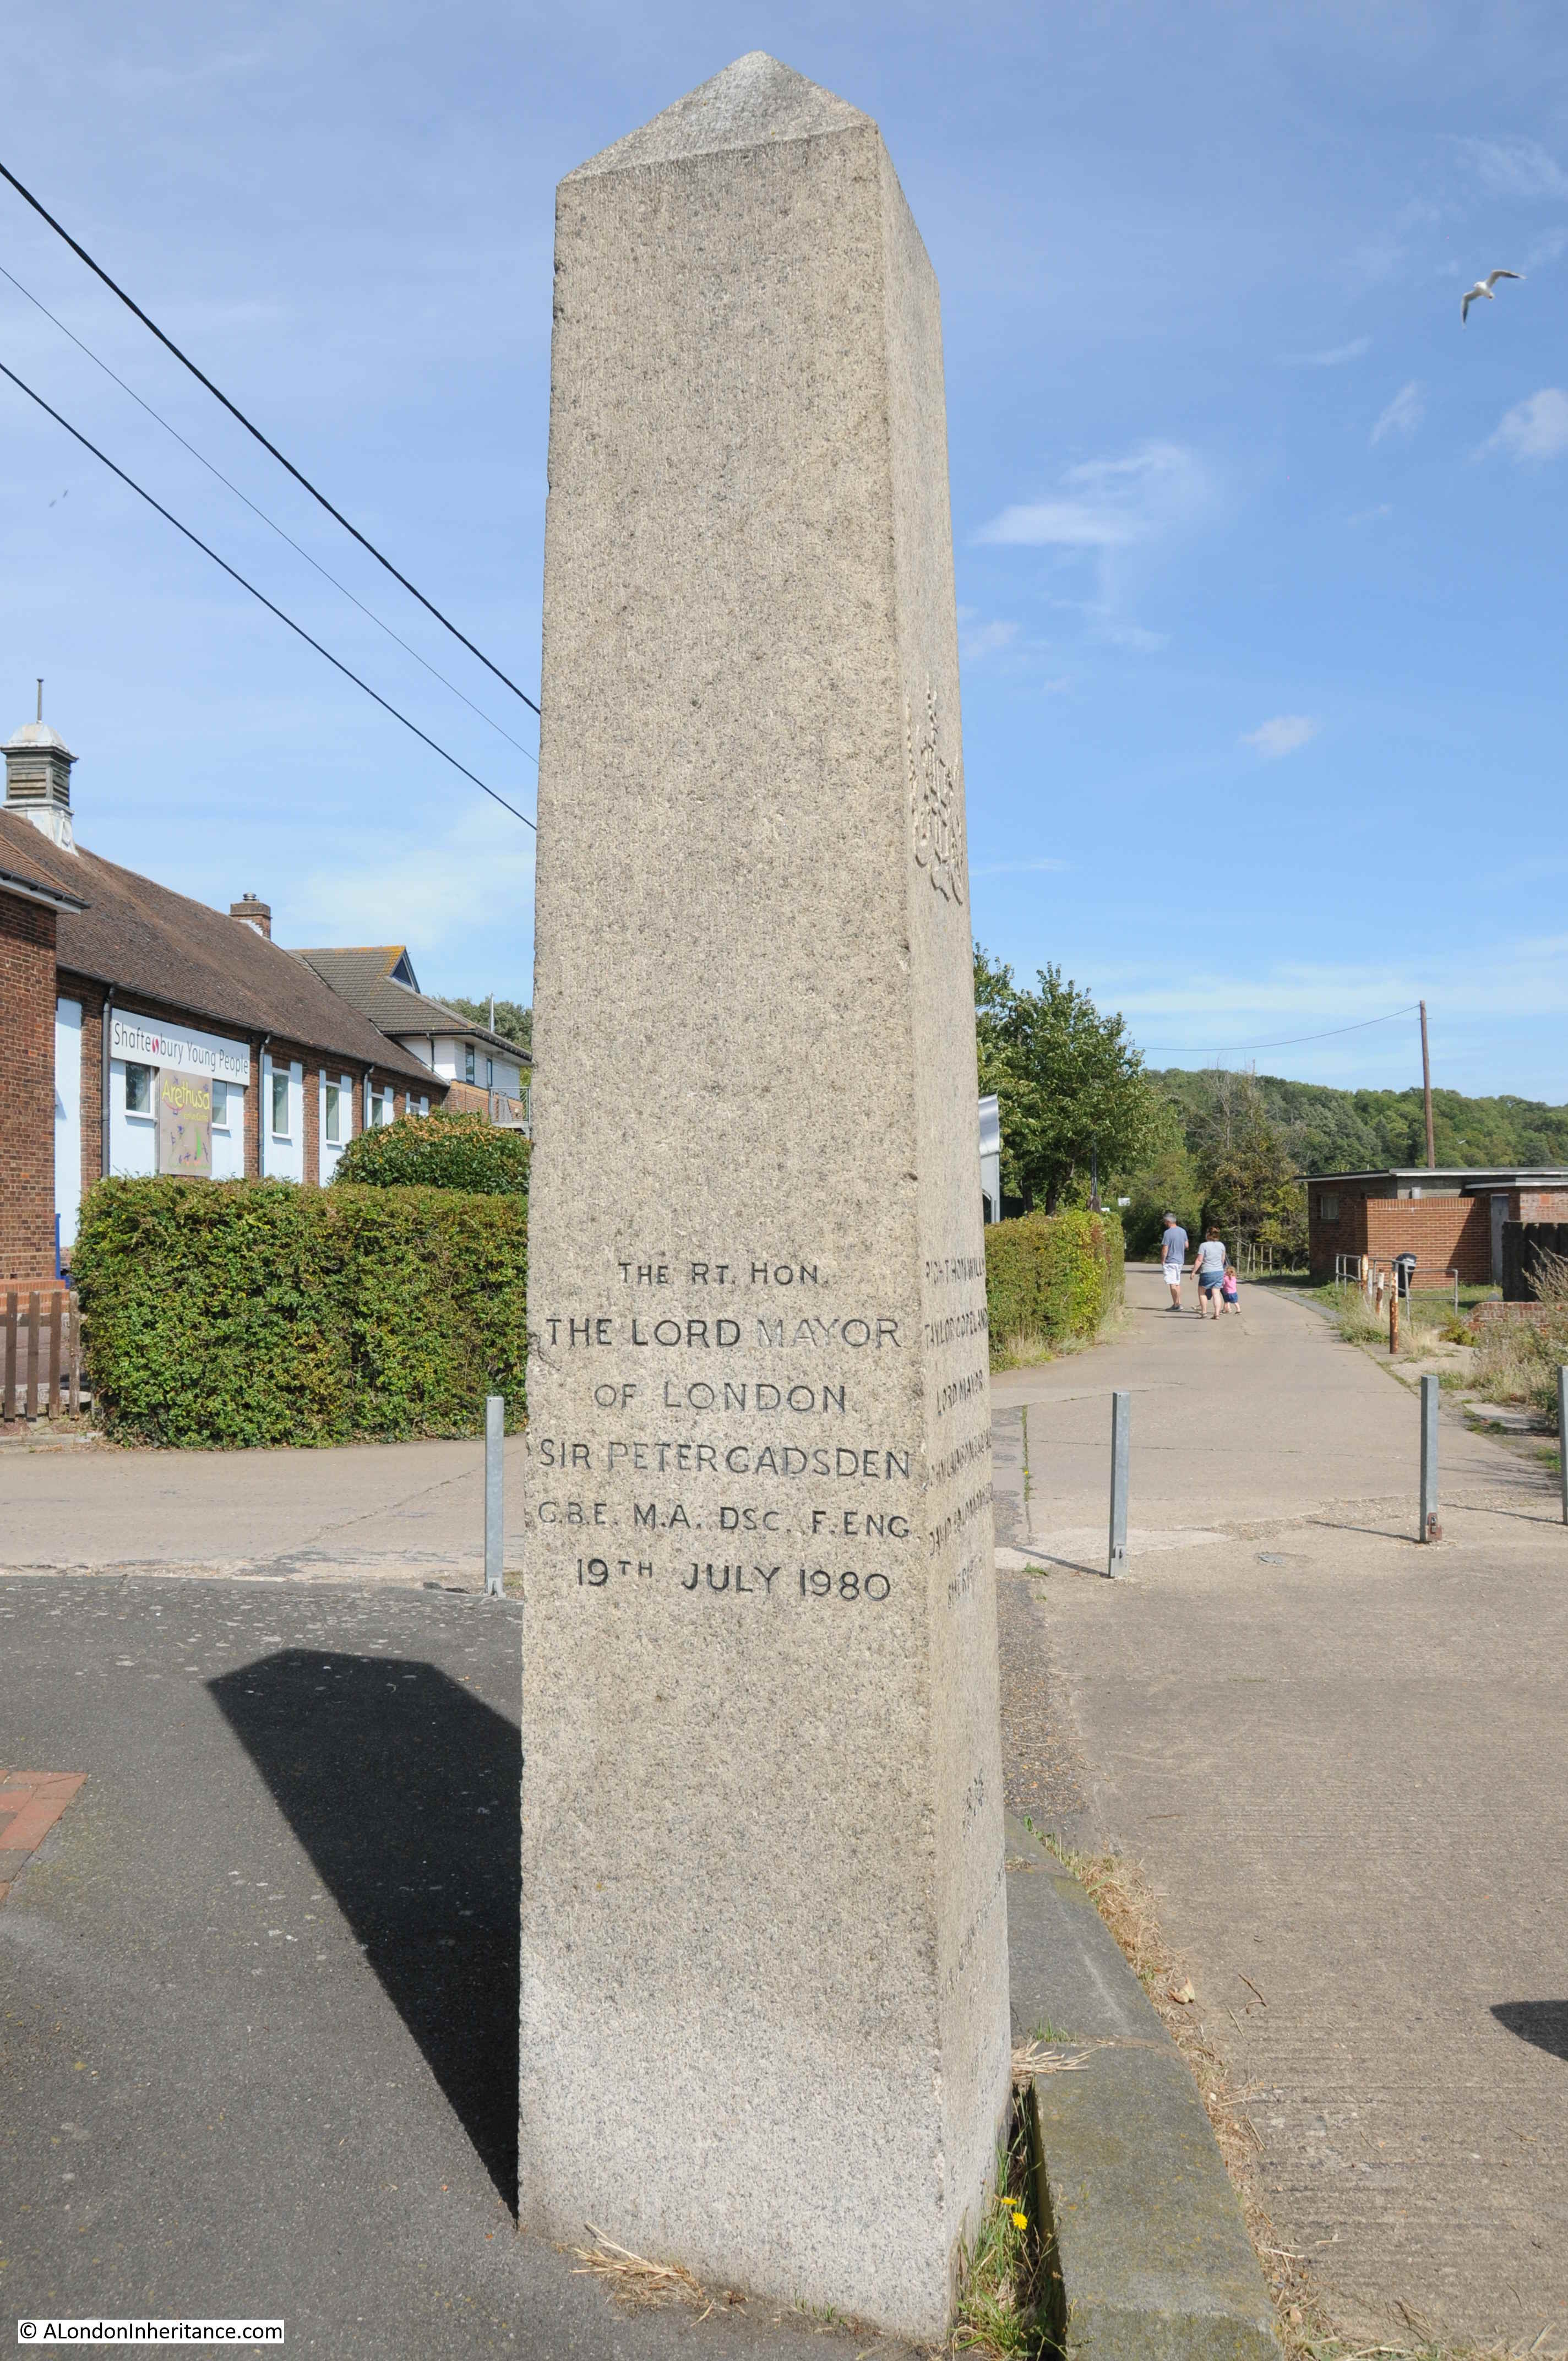
Although in Southend, the older stone was removed when a replacement was installed, at Lower Upnor, the new 1836 pillar was installed adjacent to the 18th century pillar which was left in place.
The visits of the Lord Mayor of the City of London to the Lower Upnor stones seem to be even more theatrical than their visits to the stones at Southend and Yantlet. Possibly this was down to the dubious claim of the City of London over the waters of the Medway, and therefore the need to make this claim very visible and impressive to the citizens of Rochester.
The following text is part of a report from the Illustrated London News on the 21st July, 1849 detailing the visit of the Lord Mayor and representatives of the City to Rochester and Lower Upnor. The report lists the number and roles of City representatives who attended the ceremony at the boundary stone and illustrates the impression the event must have given to the people of Rochester.
The City representatives had already been to Southend, and on the ship across from Southend to Rochester (during which there had been dancing), we now join them in Rochester:
“Shortly after ten o’clock, the Mayor and Corporation of Rochester proceeded to the Crown Hotel; and the Recorder having briefly stated the object of their visit, introduced severally to the Lord Mayor, the members of the Corporation. His Lordship expressed the gratification he felt at receiving the Mayor and Corporation of Rochester; and, after a brief address, invited them to dine with him that evening, and then introduced the members of the Corporation of London.
At the conclusion of the visit, the Lord Mayor and Lady Mayoress, accompanied by their guests, proceeded on board the steamer down the Medway, and shortly after anchored opposite Cockham Wood, near Upnor Castle, where the City boundary-stone is erected. The Lord Mayor and Aldermen landed, attended by the civic officers, and a procession was formed in the following order:-
- Police Officers
- Six Watermen in state liveries, with colours
- The Band
- The Lord Mayor’s Bargemaster in state livery, bearing the City Colours
- City Marshal in uniform
- The Engineer of the Thames Navigation and Port of London Committee
- The Water-Bailiff
- The Sword-bearer
- The Right Hon, the Lord Mayor
- The Aldermen (seniors first)
- The Sheriffs
- City Officers
- Six Watermen in state liveries, with colours
- Police Offices
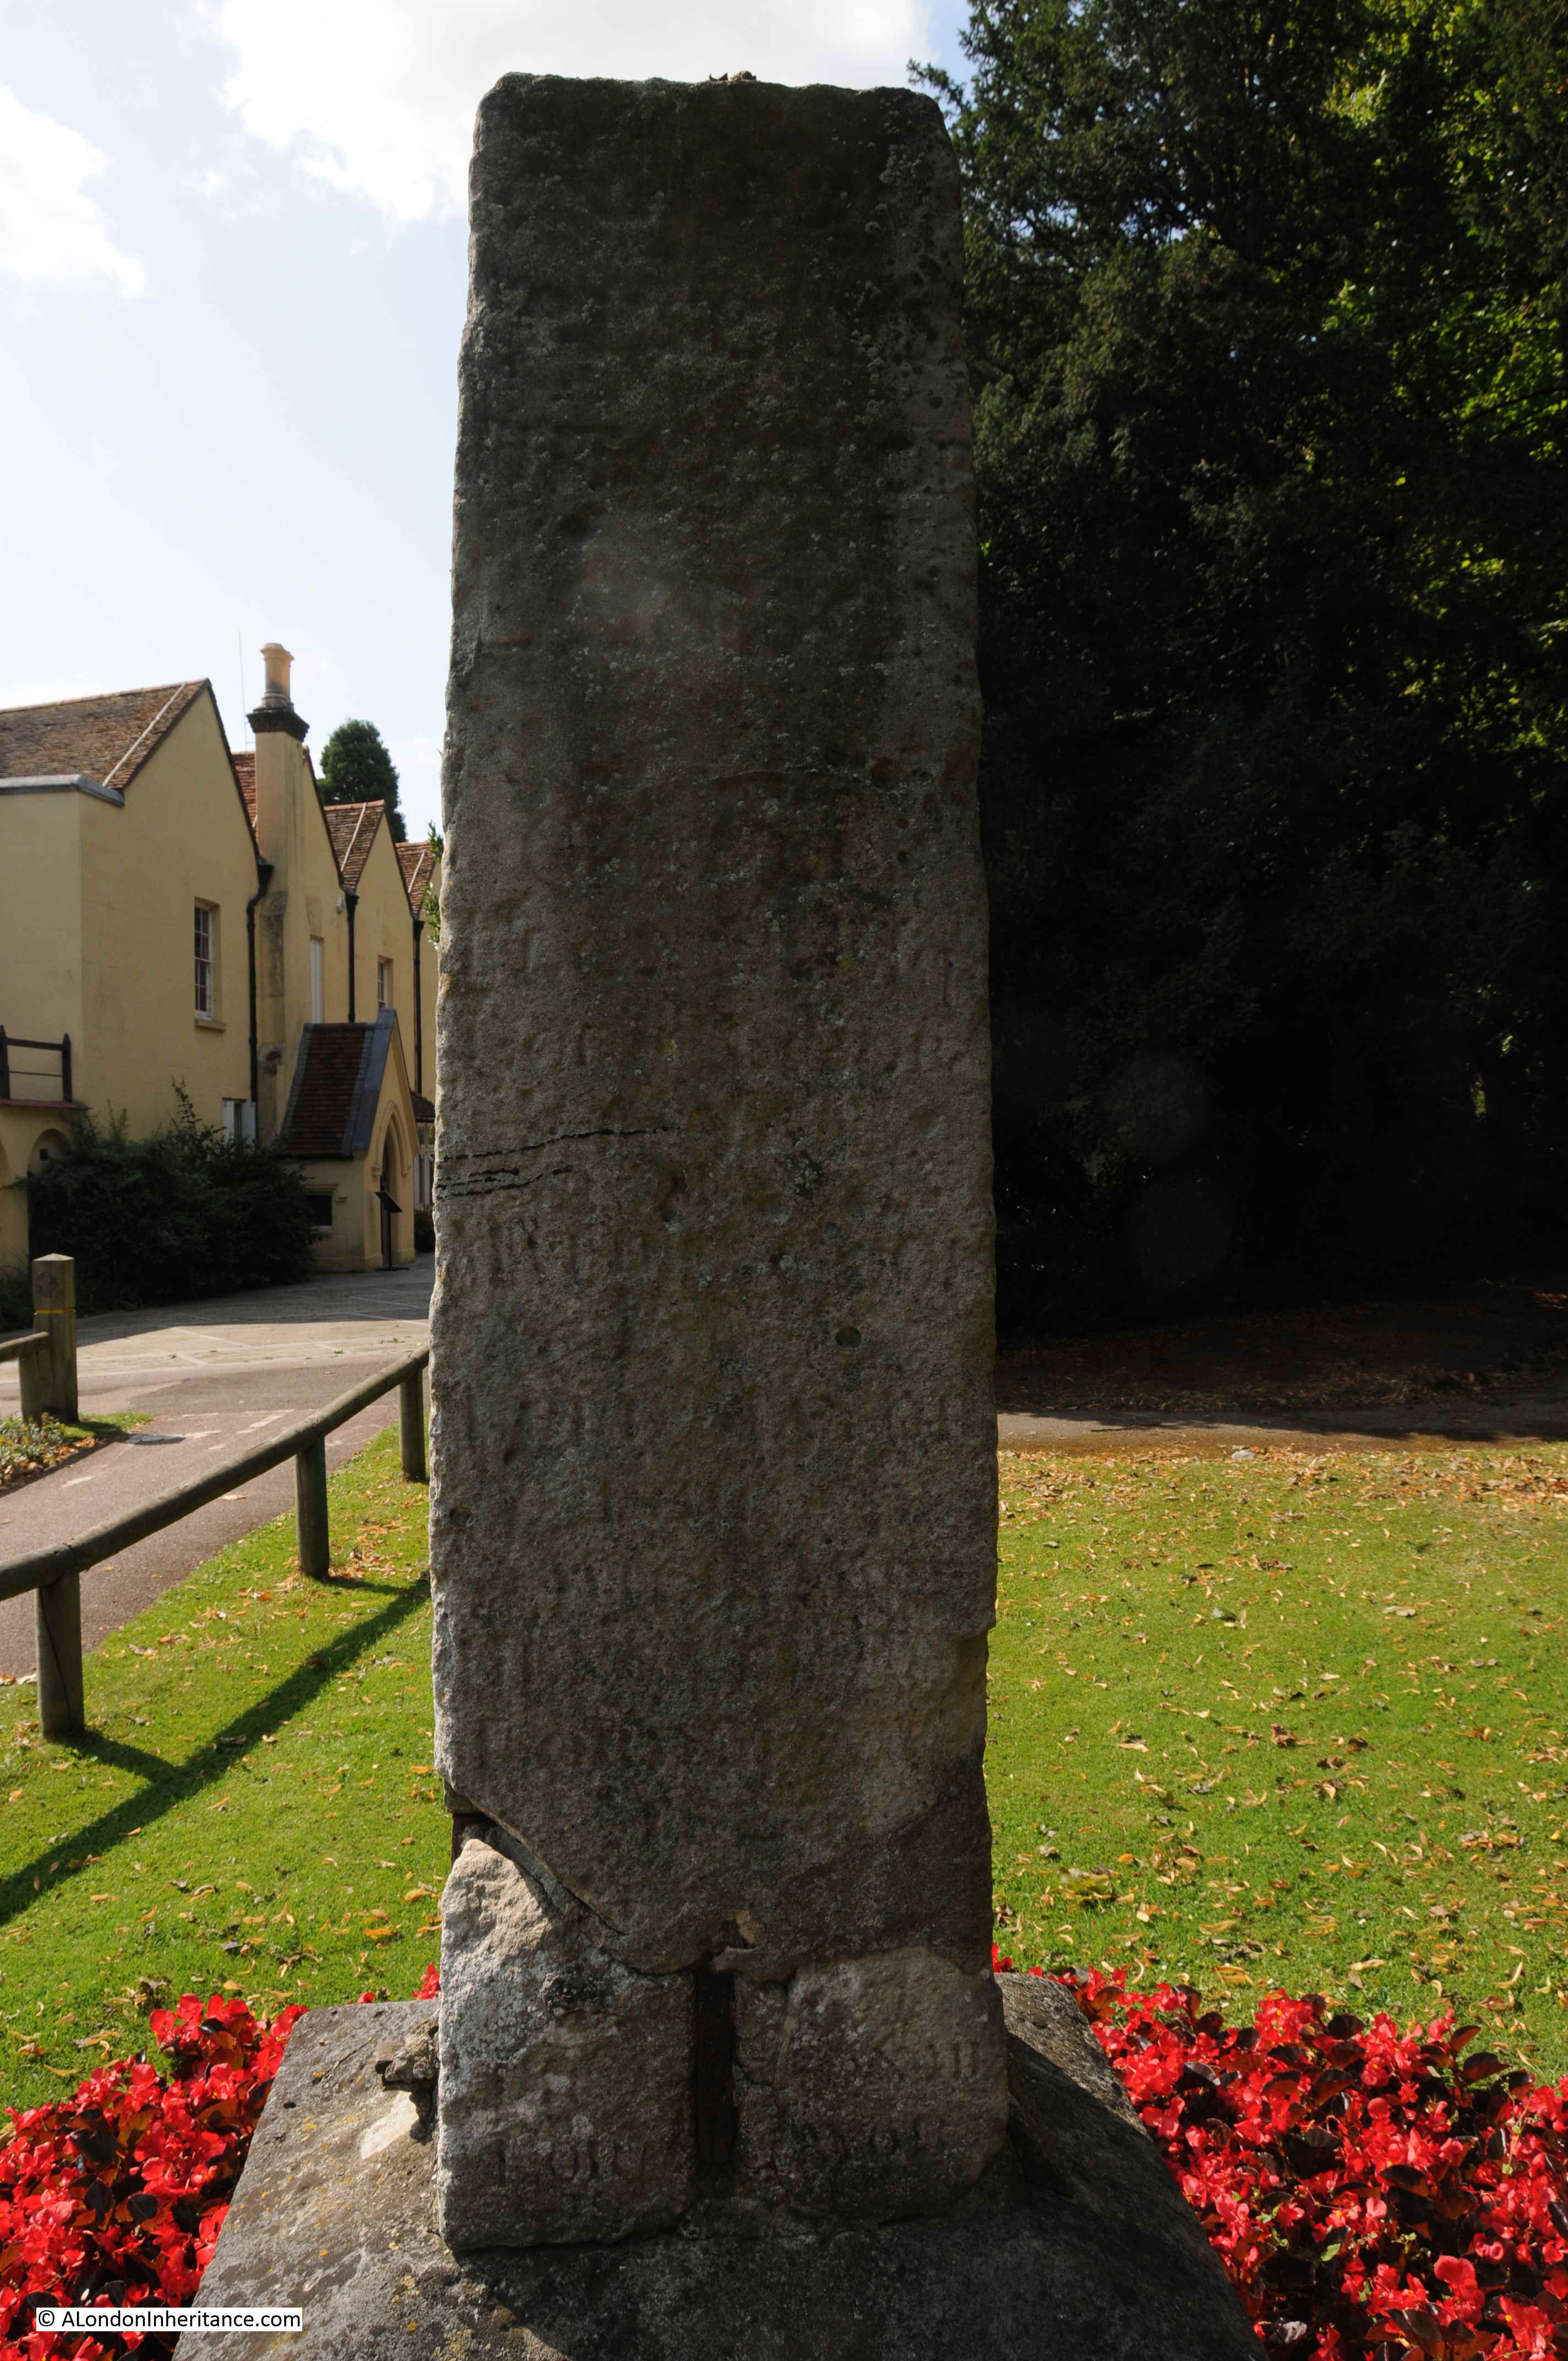
Having made the circuit of the stone three times, his Lordship directed the City colours and the state sword to be placed thereon, asserting his right to the jurisdiction, as Conservator of the River Thames and waters of the Medway, by charter, prescription, and usage confirmed to, and enjoyed by, the City of London from time immemorial; and directed the Water-Bailiff, as his sub-conservator, to have the date of his Lordship’s visit duly inscribed on the stone. His Lordship then gave as a toast, the ancient inscription on the boundary-stone, ‘God preserve the City of London’. The band played the National Anthem, amidst the shouts of a large number of spectators who had assembled to witness the ceremony, and who were delighted by a distribution of wine, and some coin being scattered amongst them.
The colours were placed upon the stone by Mr J. Bishop of St. Benet’s Hill, Doctors’ Commons.
The civic party returned to the steam-vessel, which then continued its progress down the Medway. On arriving off Sheerness, the company went on board Her Majesty’s ship Ocean, the guard-ship. where they were received with great courtesy; the Lord Mayor’s band, which accompanied them on board, playing the National Anthem and Rule Britannia. The Lord Mayor having also visited the Wellington, by steamer returned up the Medway, and reached Rochester in time for his Lordship to receive his guests at the Crown Hotel, facing the bridge.”
No idea how much these visits must have cost, however the expenditure in re-asserting the City’s rights must have been considerable.
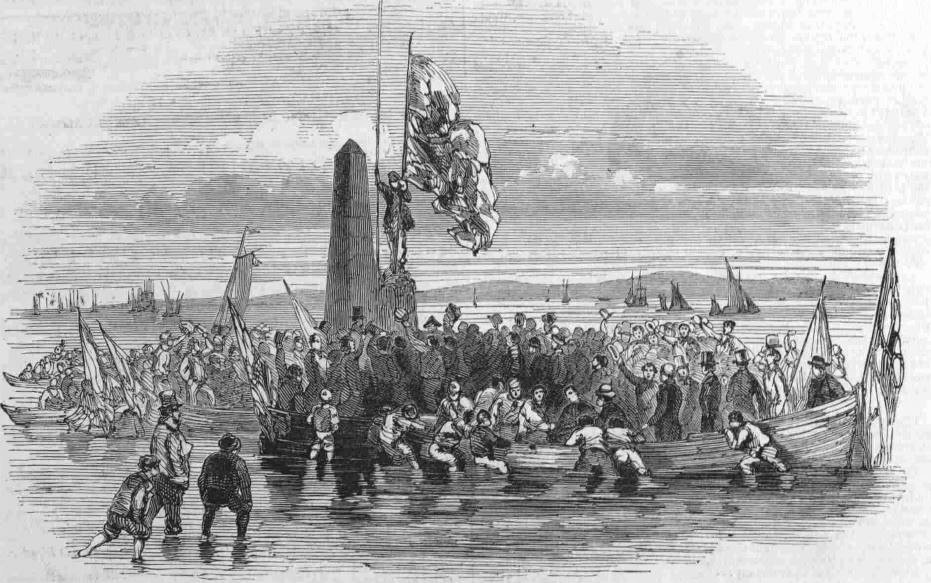
The following print shows the City of London’s party at the Lower Upnor boundary stone. Upnor Castle is in the near distance. The steam-ship Meteor is lying offshore.
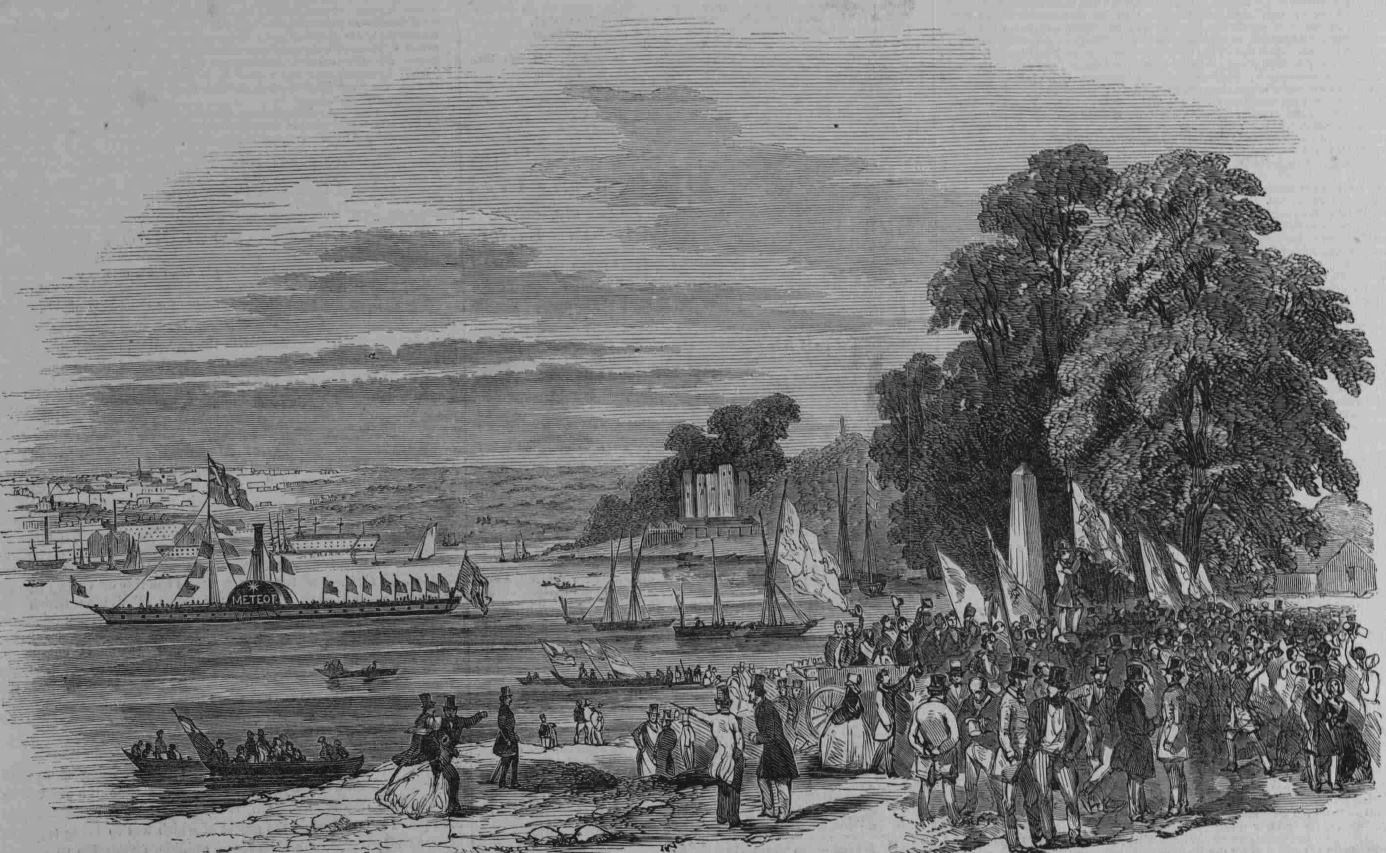
This print is titled “The distribution of money”, part of the ceremony at the boundary stone as money was distributed to the local citizens, although it seems to be basically throwing coins into a fighting scrum of people.

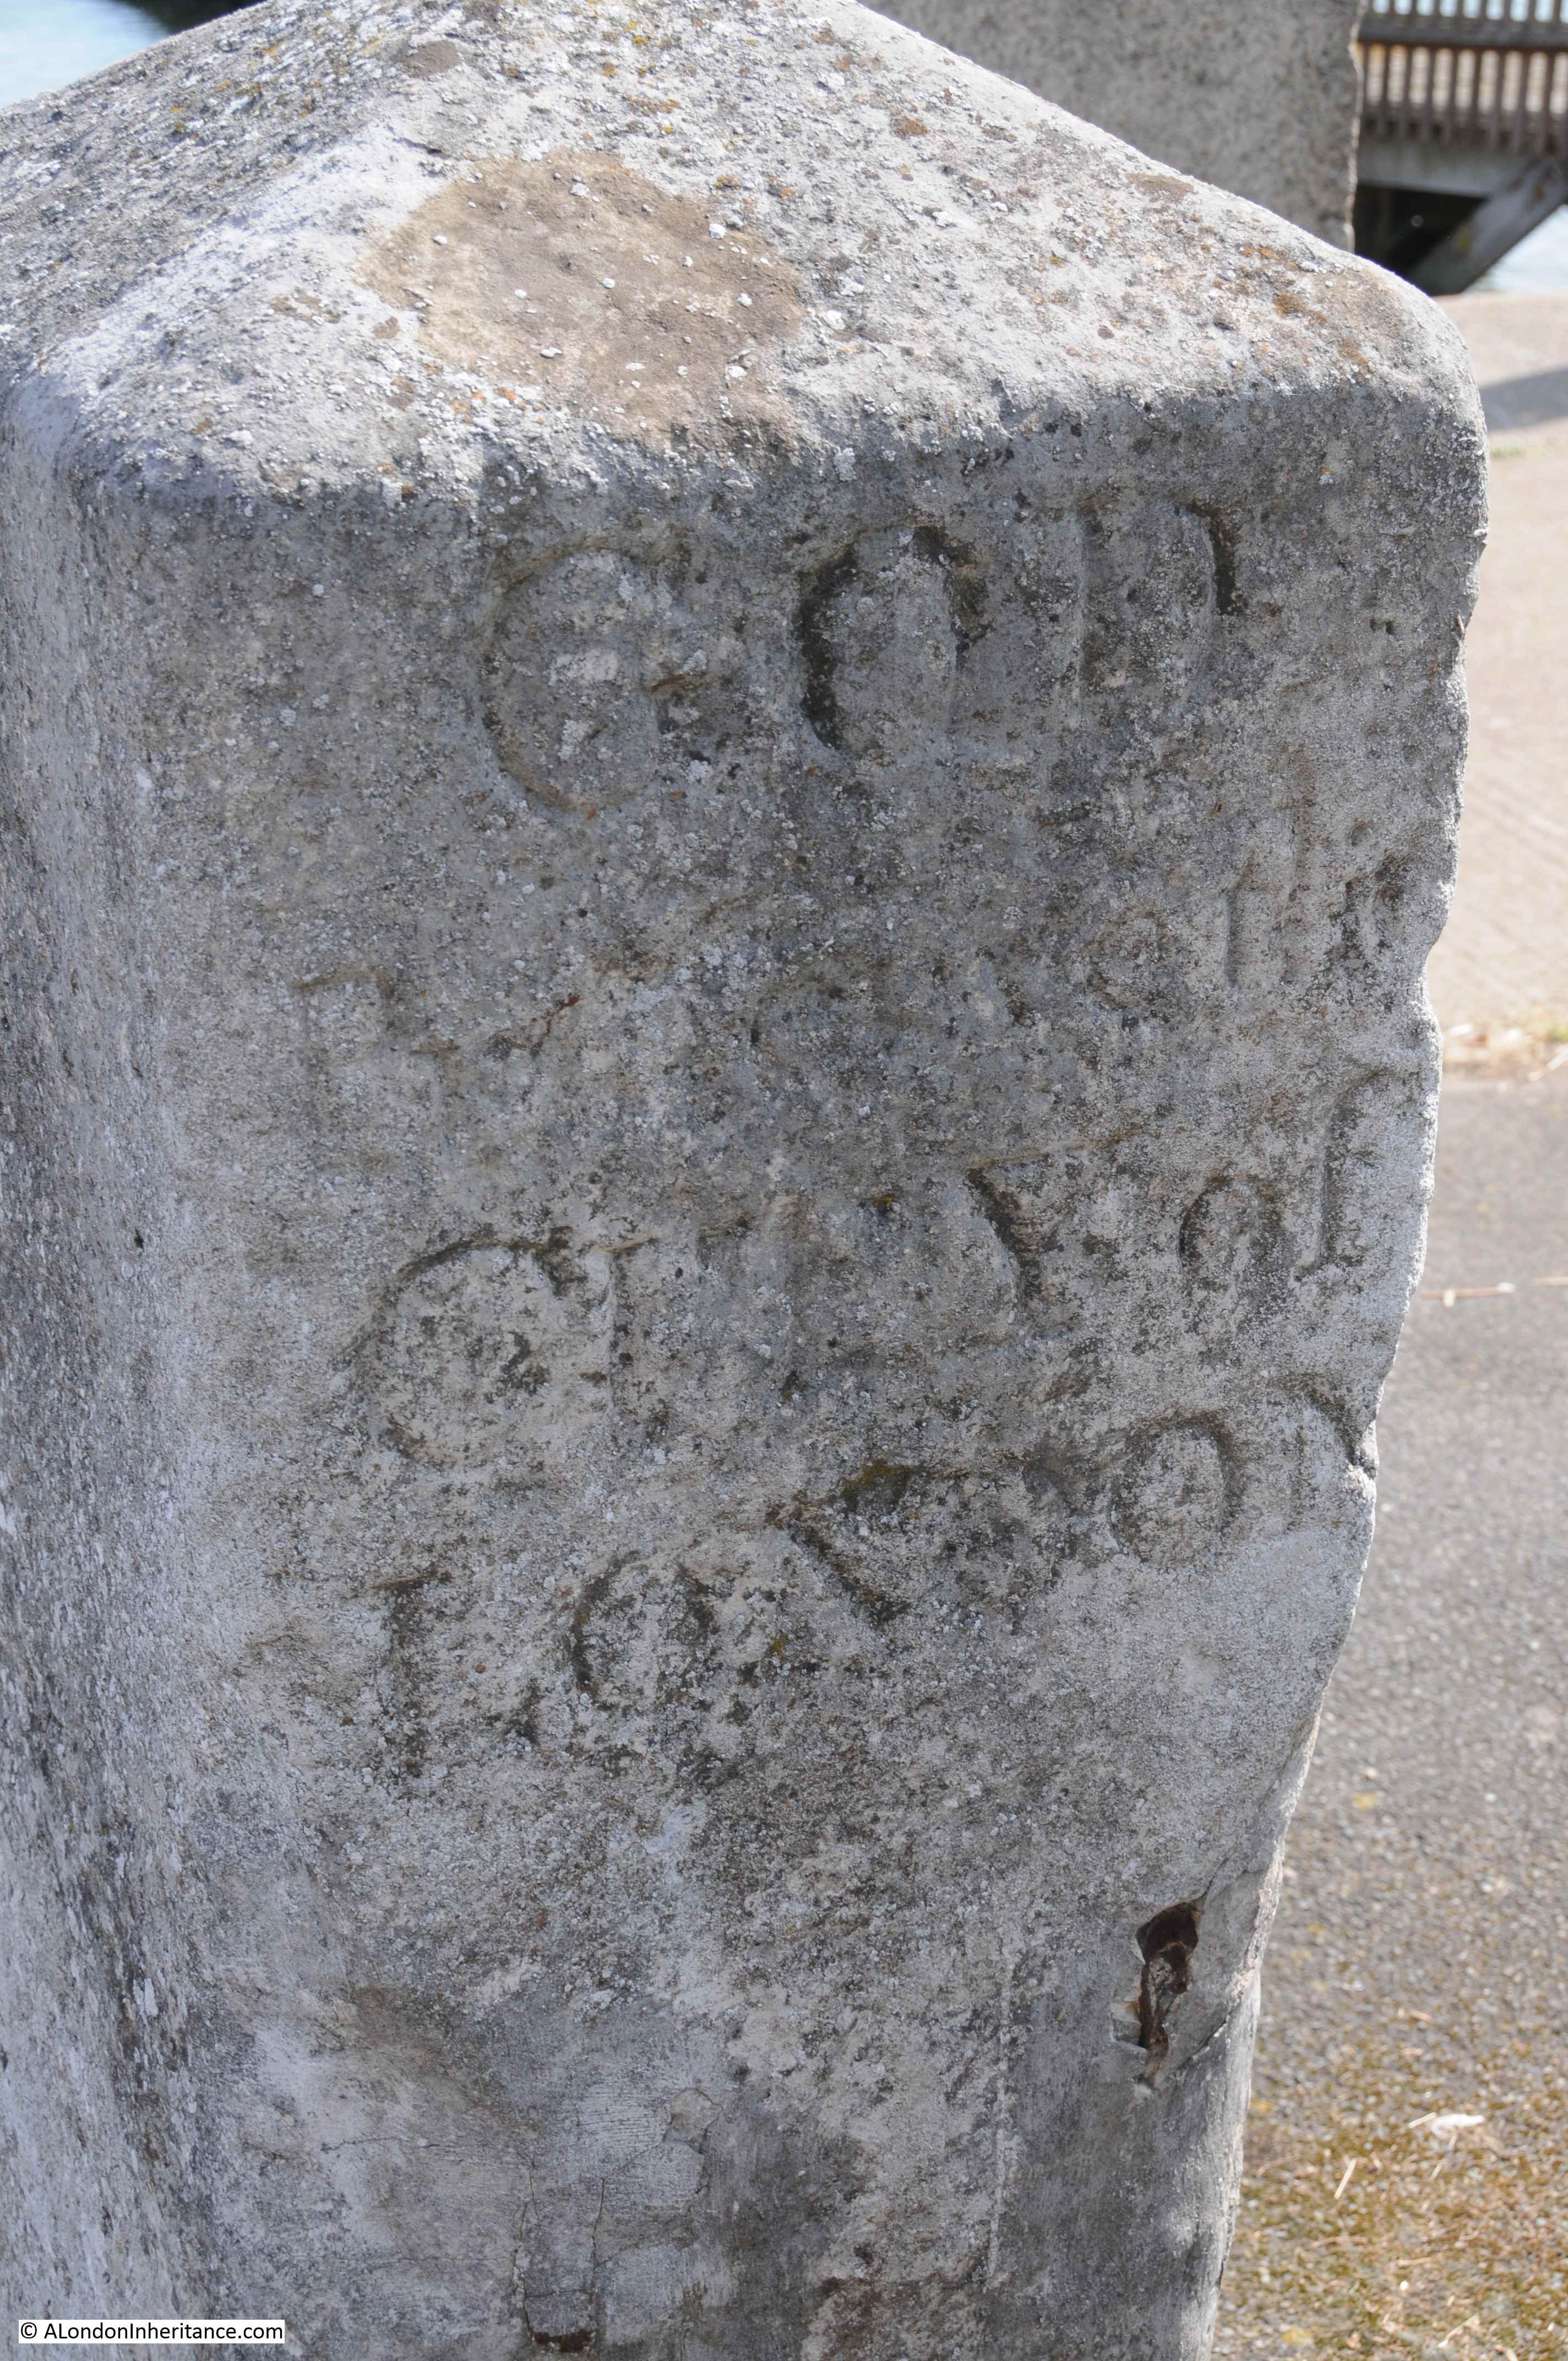
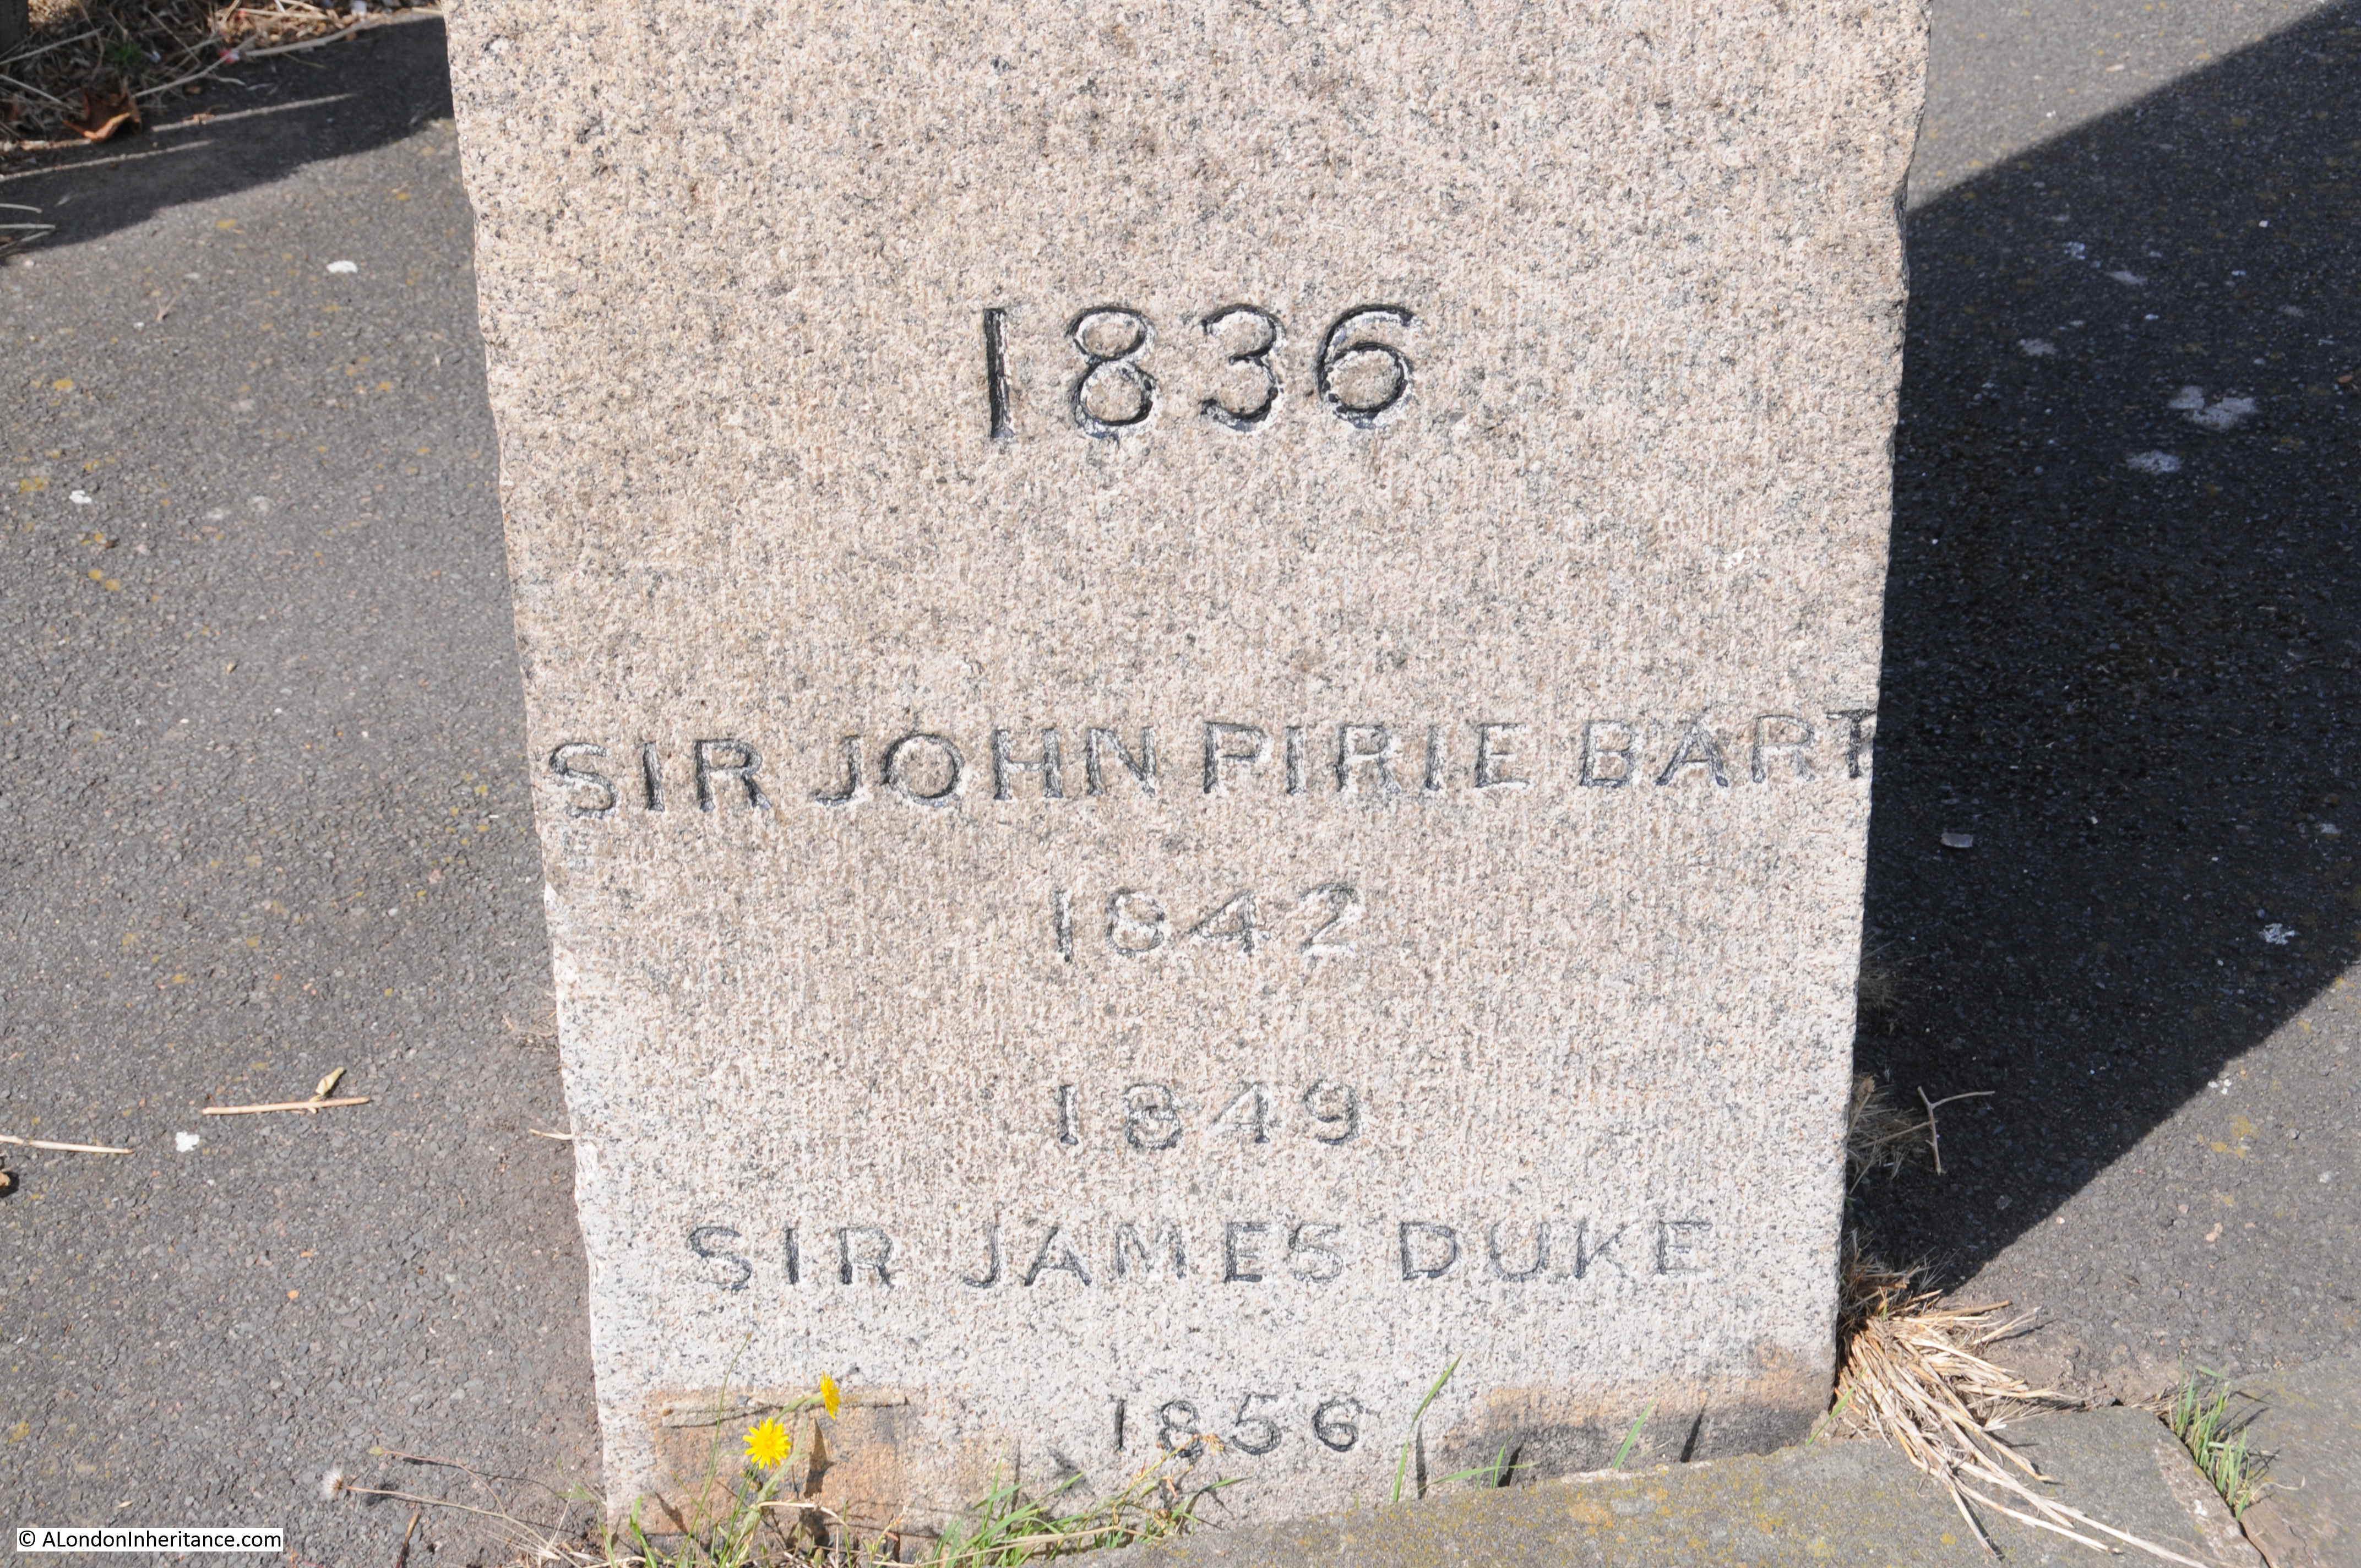
The visit in 1949 was by Sir James Duke, the Lord Mayor of the City of London between 1848 and 1849. In the report above, the water-bailiff is instructed to have the date of the Mayor’s visit carved on the stone, and we can still see this today towards the base of the pillar.
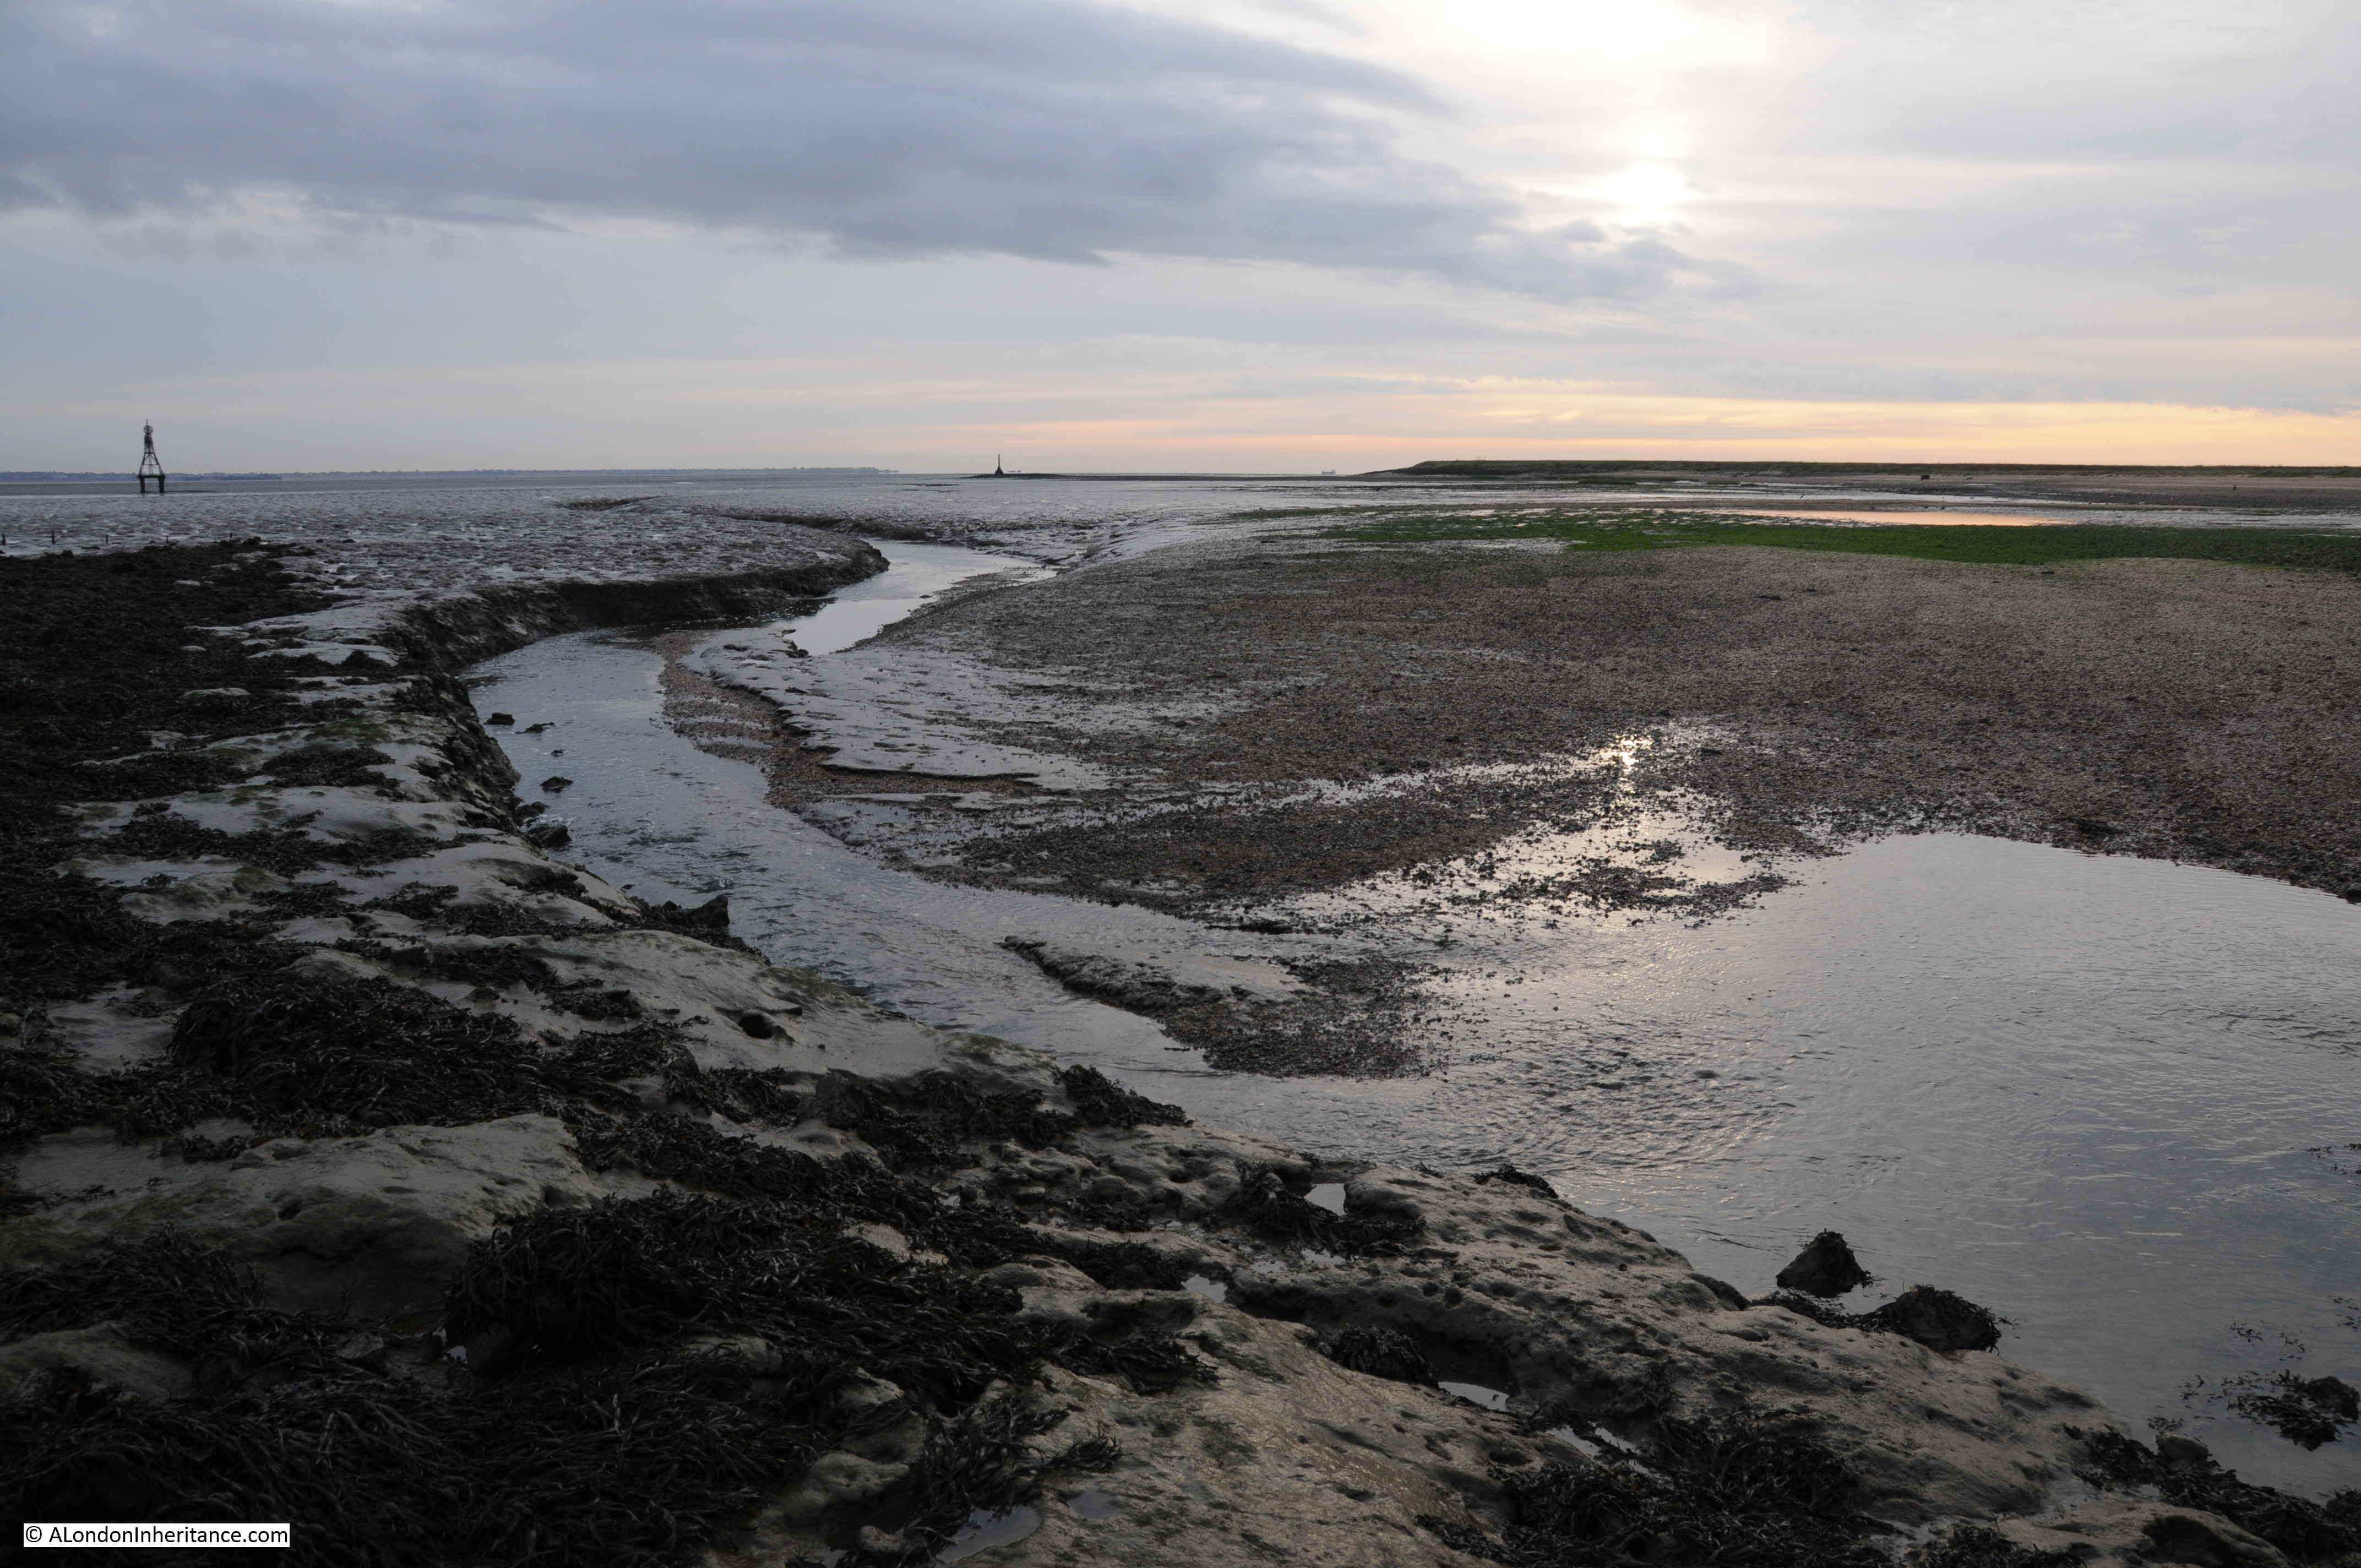
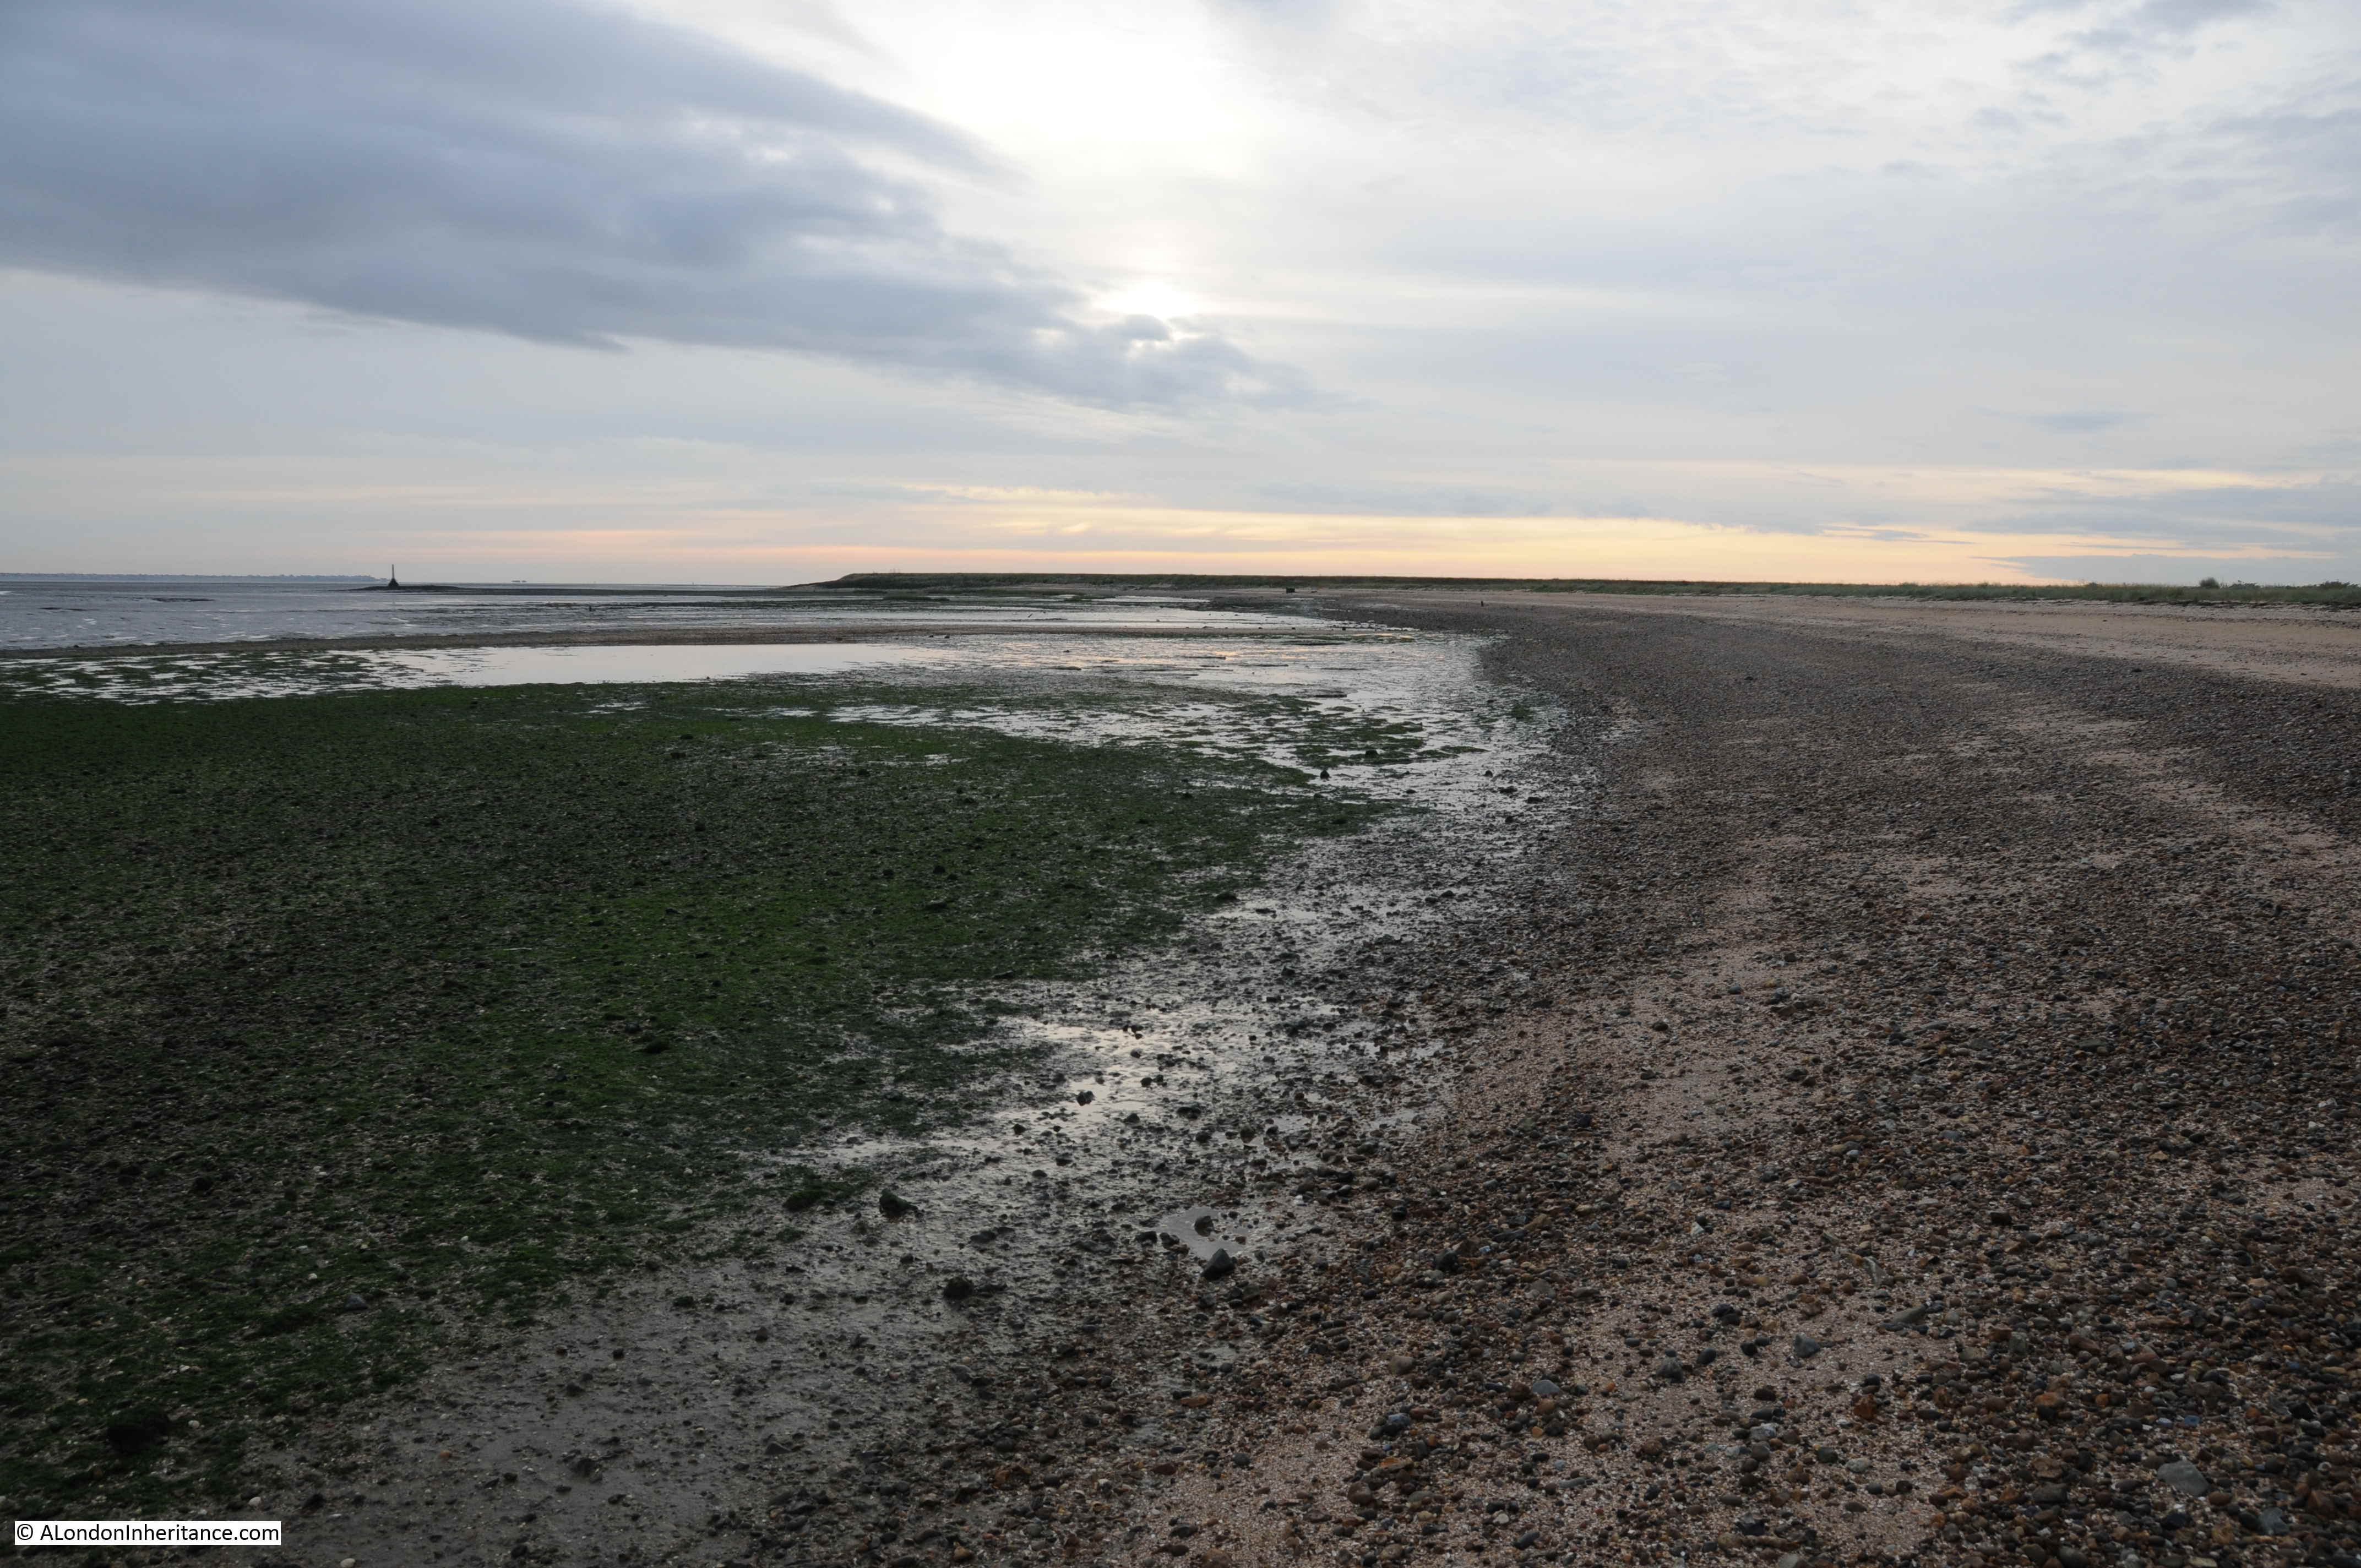
The following photo shows the view eastwards from the pillar along the River Medway in the direction of Yantlet Creek. It was these waters over which the City of London claimed jurisdiction.
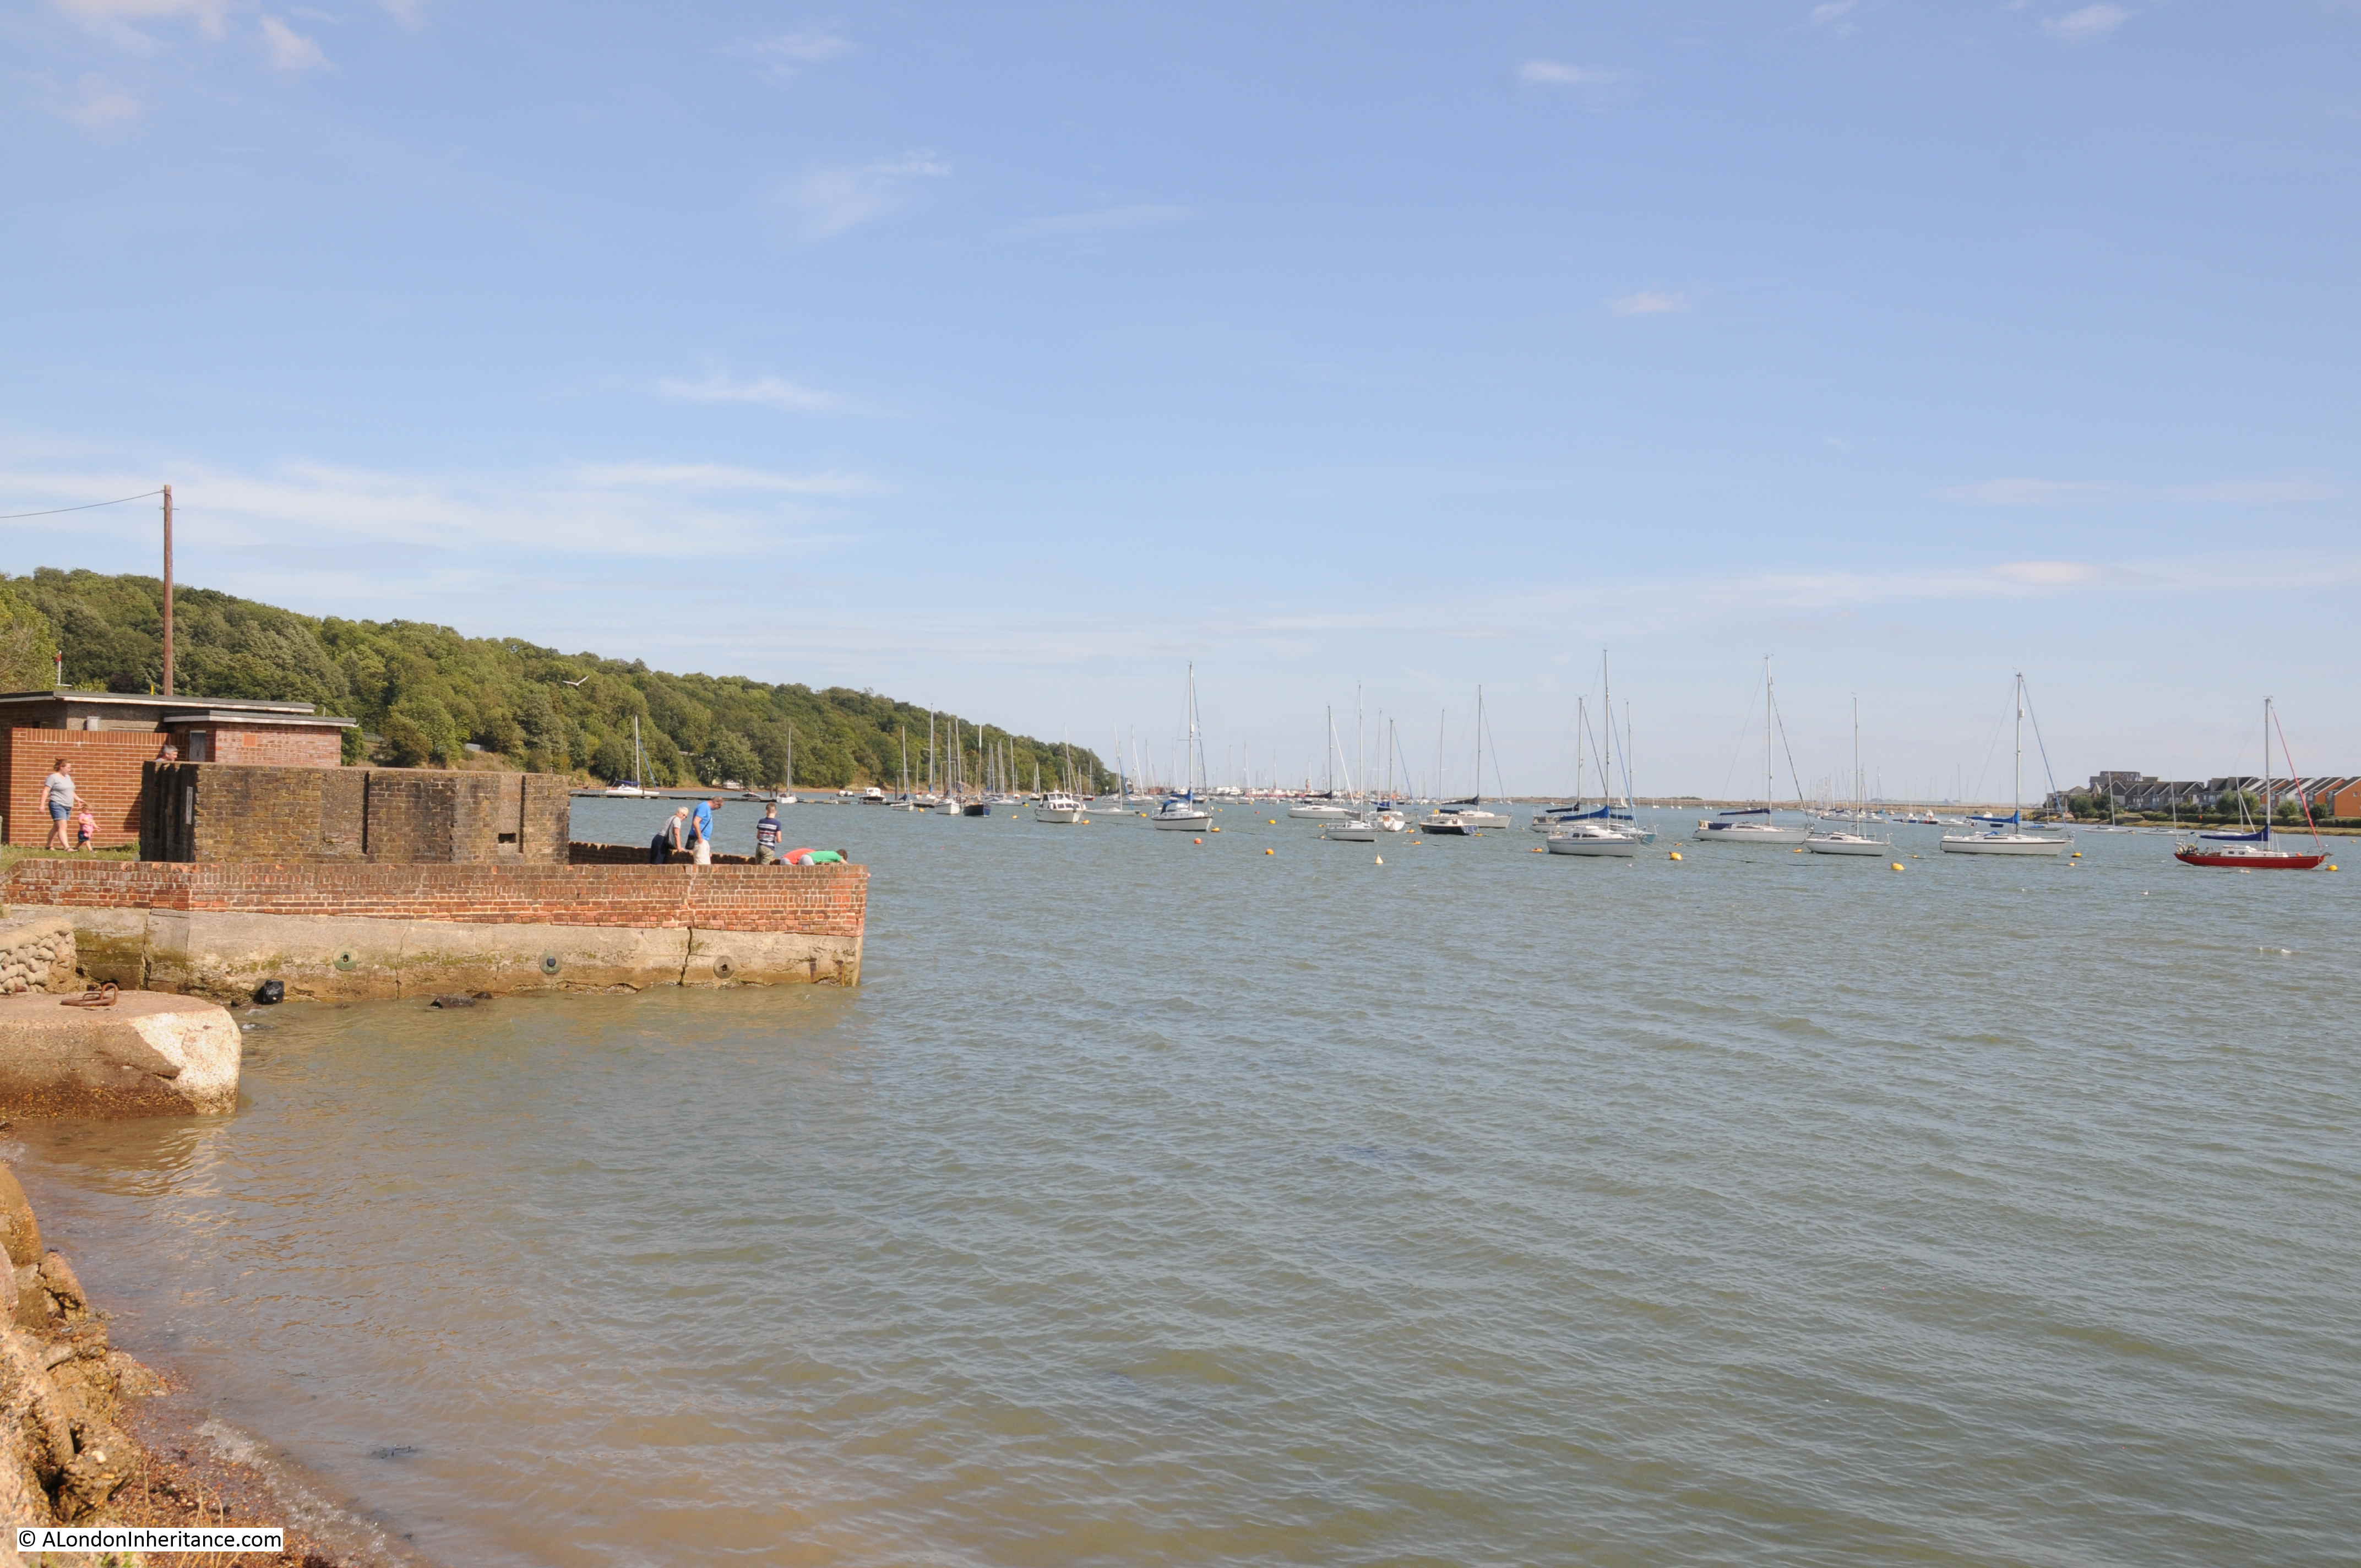
These stones, along with the stones at Southend and Yantlet Creek mark the eastern boundaries of the City of London’s claimed jurisdiction.
Whilst I can understand the City’s claim along the River Thames, standing at Lower Upnor and looking out over the River Medway, the City’s claim over this river does seem rather stretched and I am not surprised that the regular visits to reinforce the claim were as theatrical as the 1849 description.
I suspect that whilst the civic authorities in Rochester participated, they were not particularly happy with the City of London approaching almost up to their town.
To follow in the Lord Mayor of London’s footsteps, it was to Rochester that I headed next.
Rochester Castle and Cathedral
Rochester is a lovely town, and one that I have not visited enough. An impressive Norman Castle and a beautiful Cathedral, along with a High Street of historic buildings make this a place worth spending more than a few hours exploring.
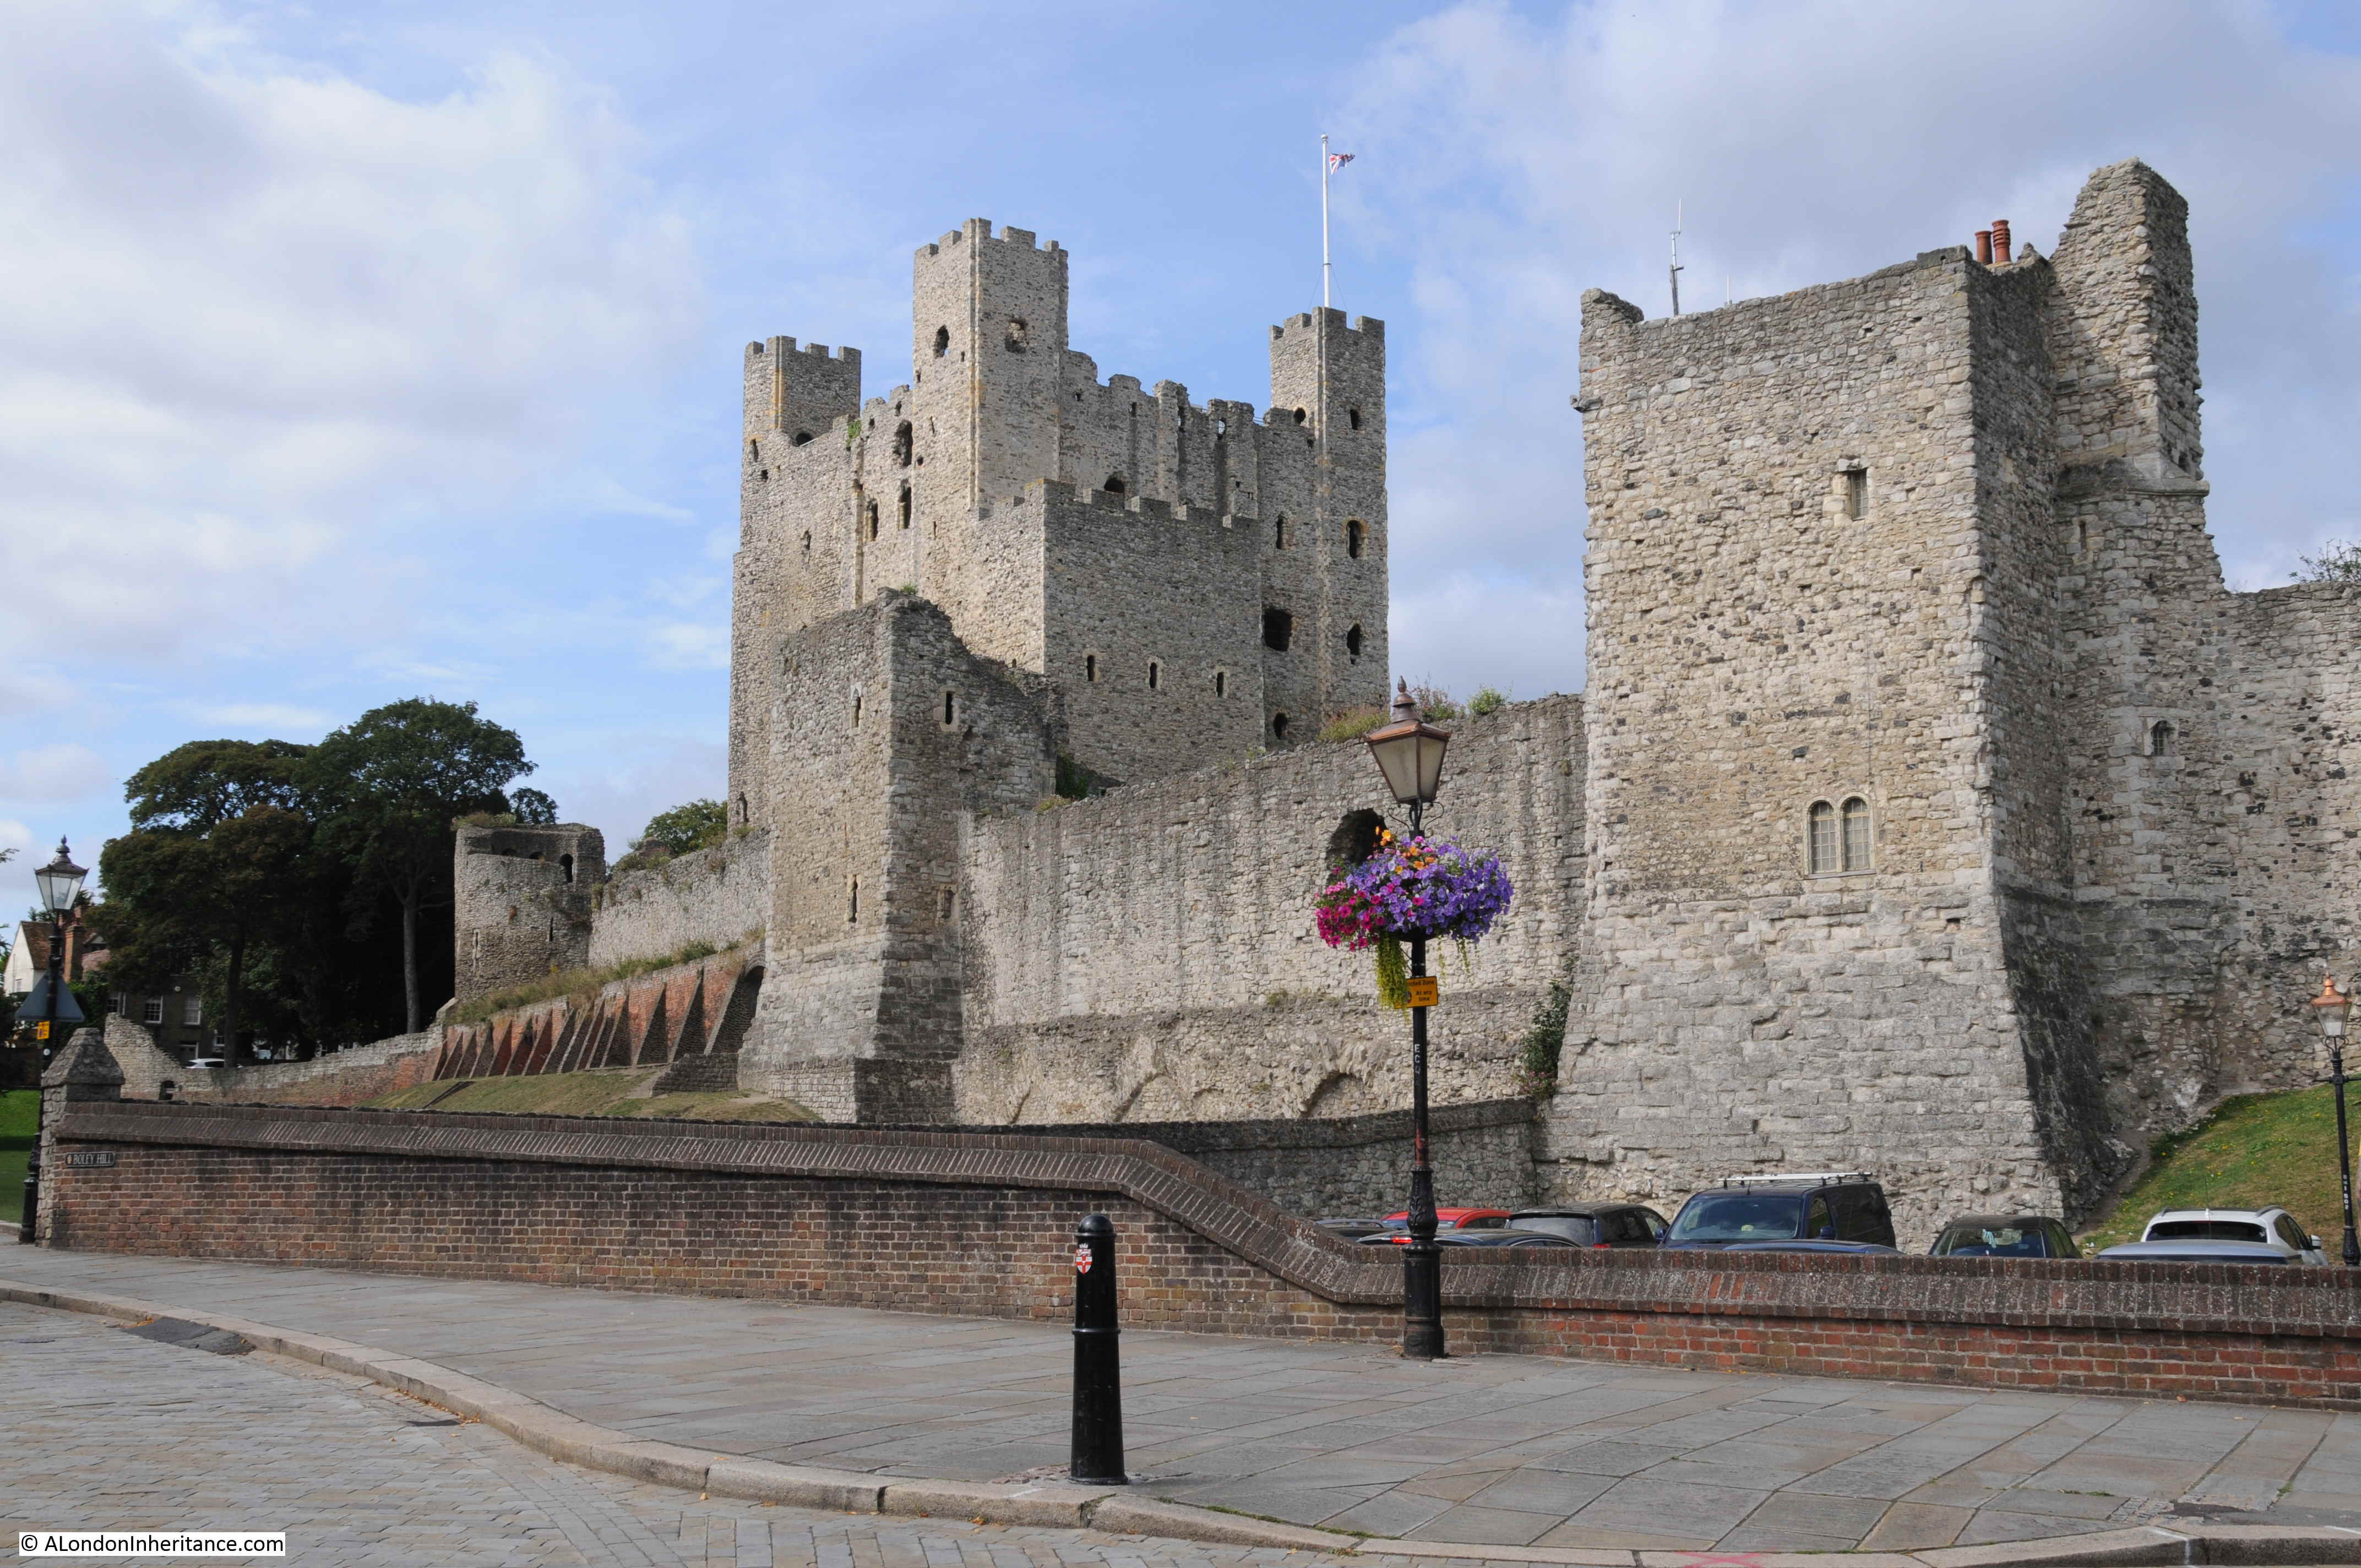
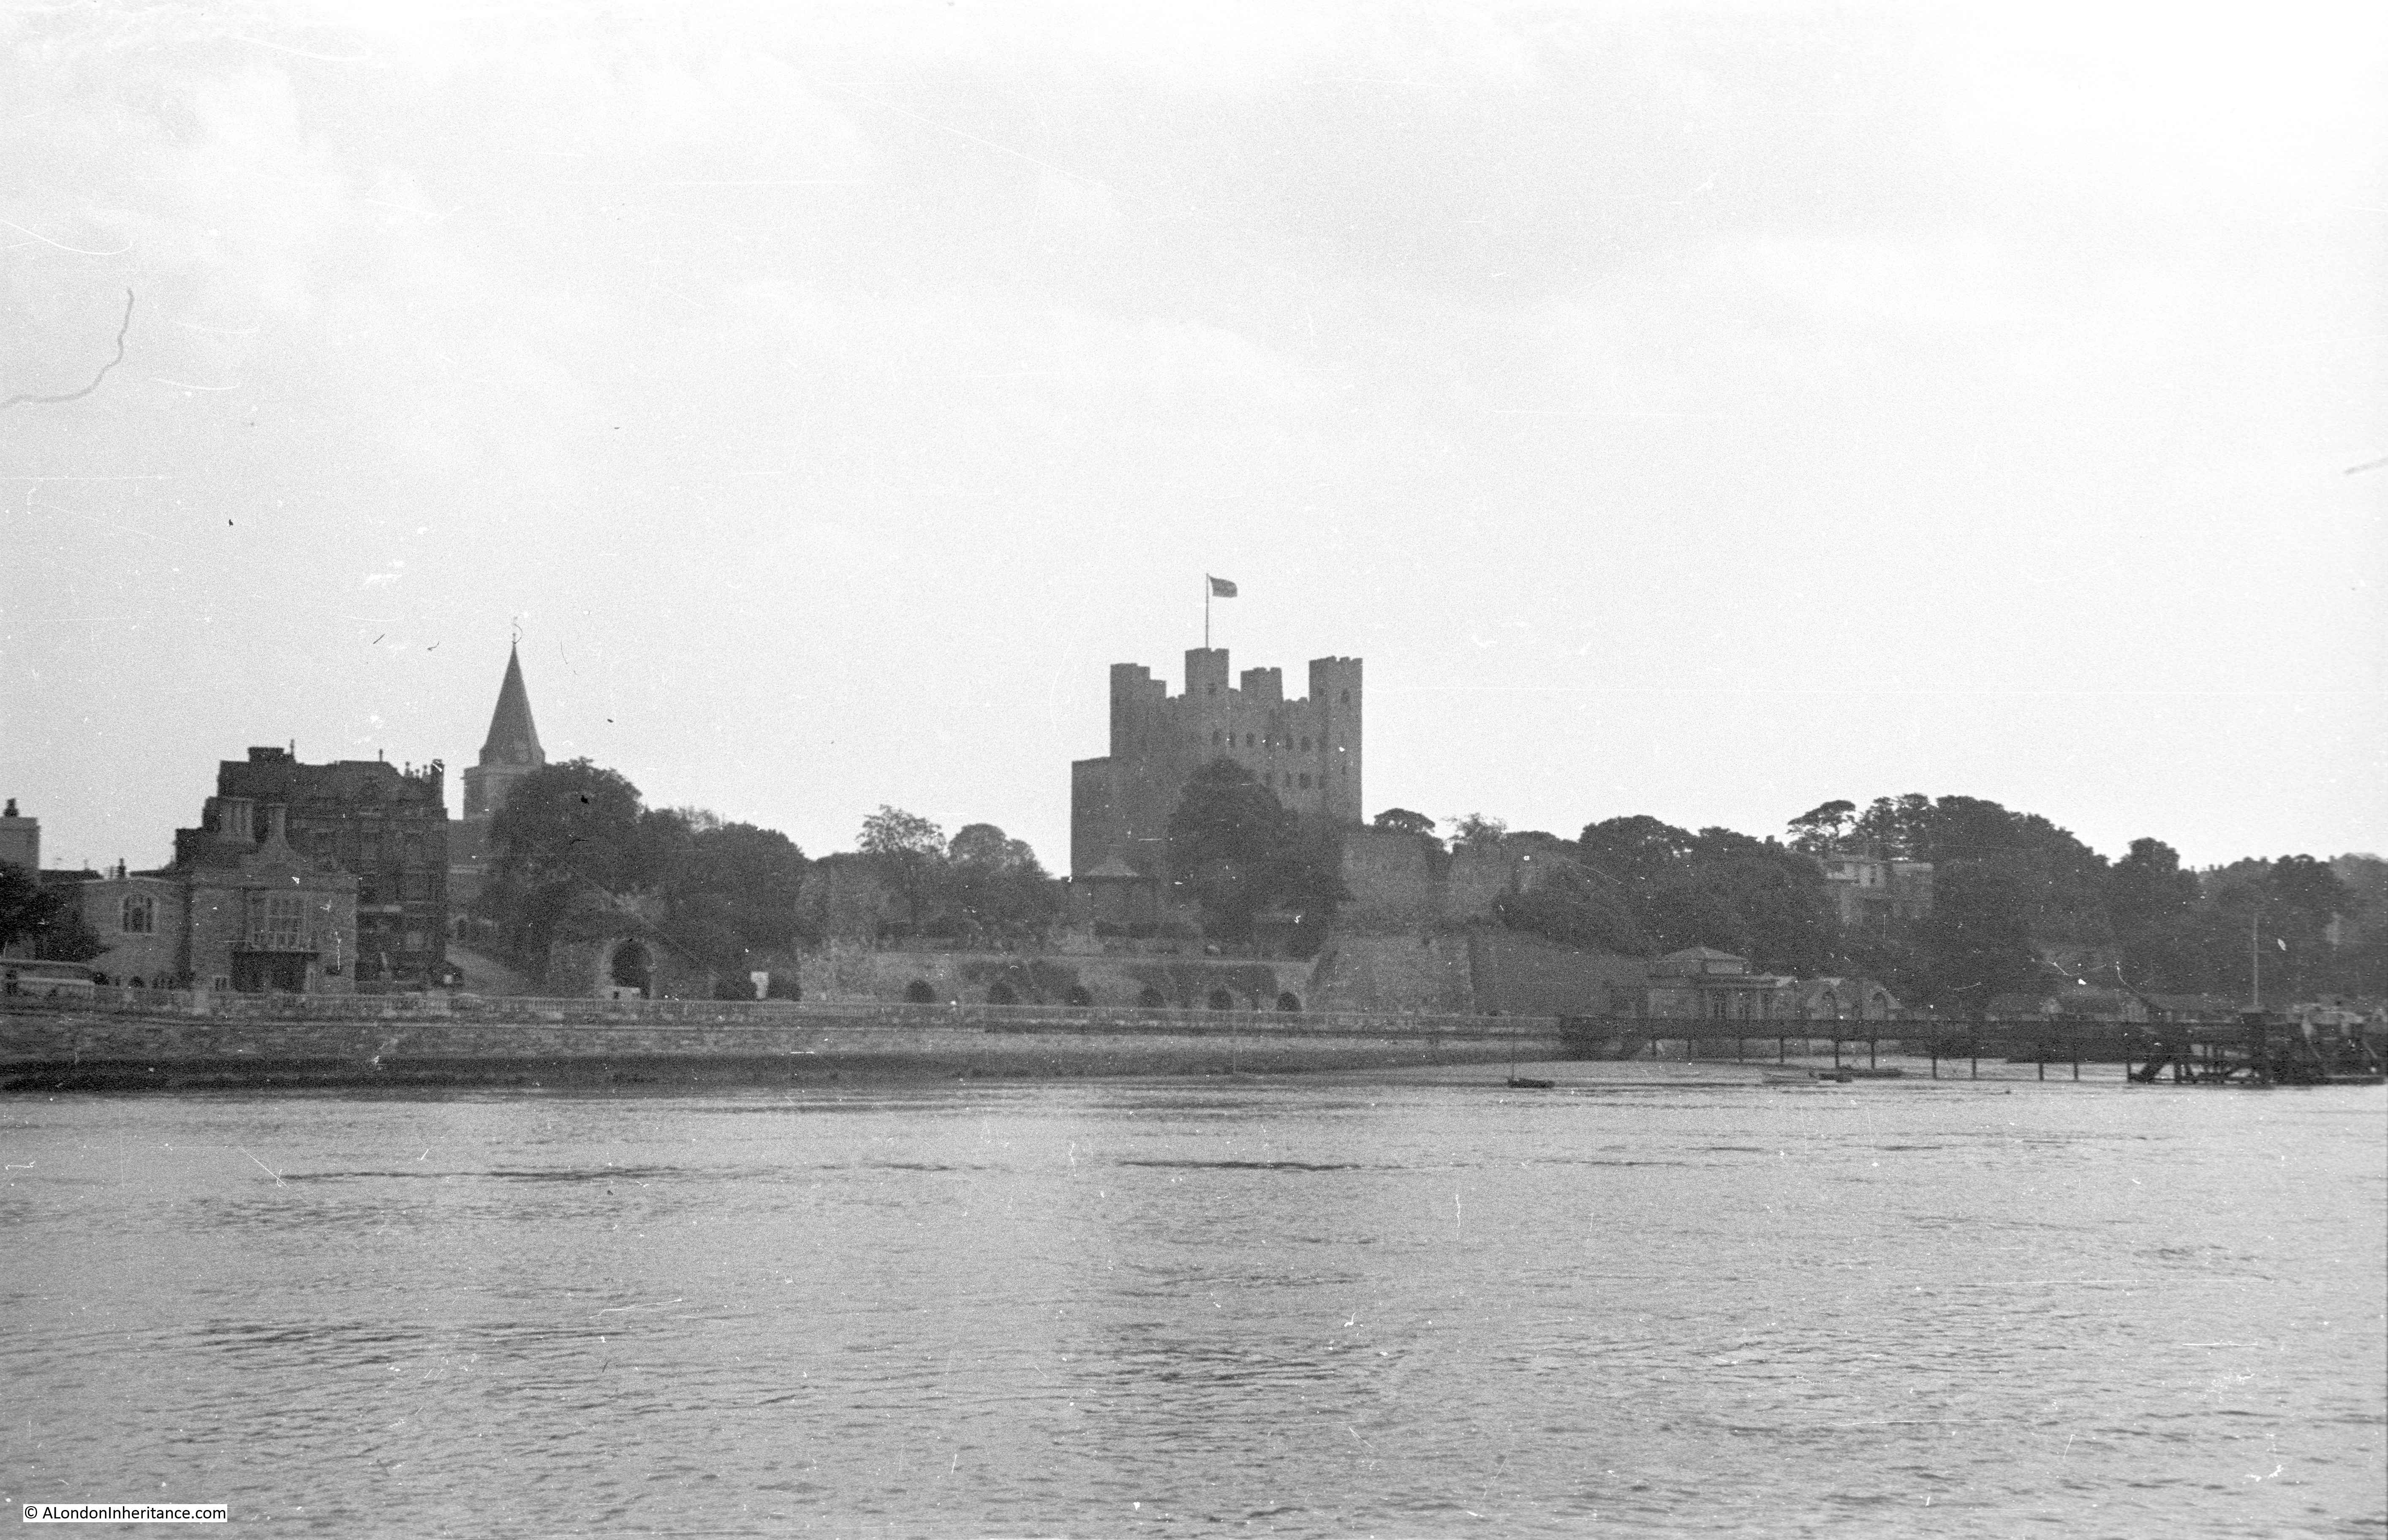
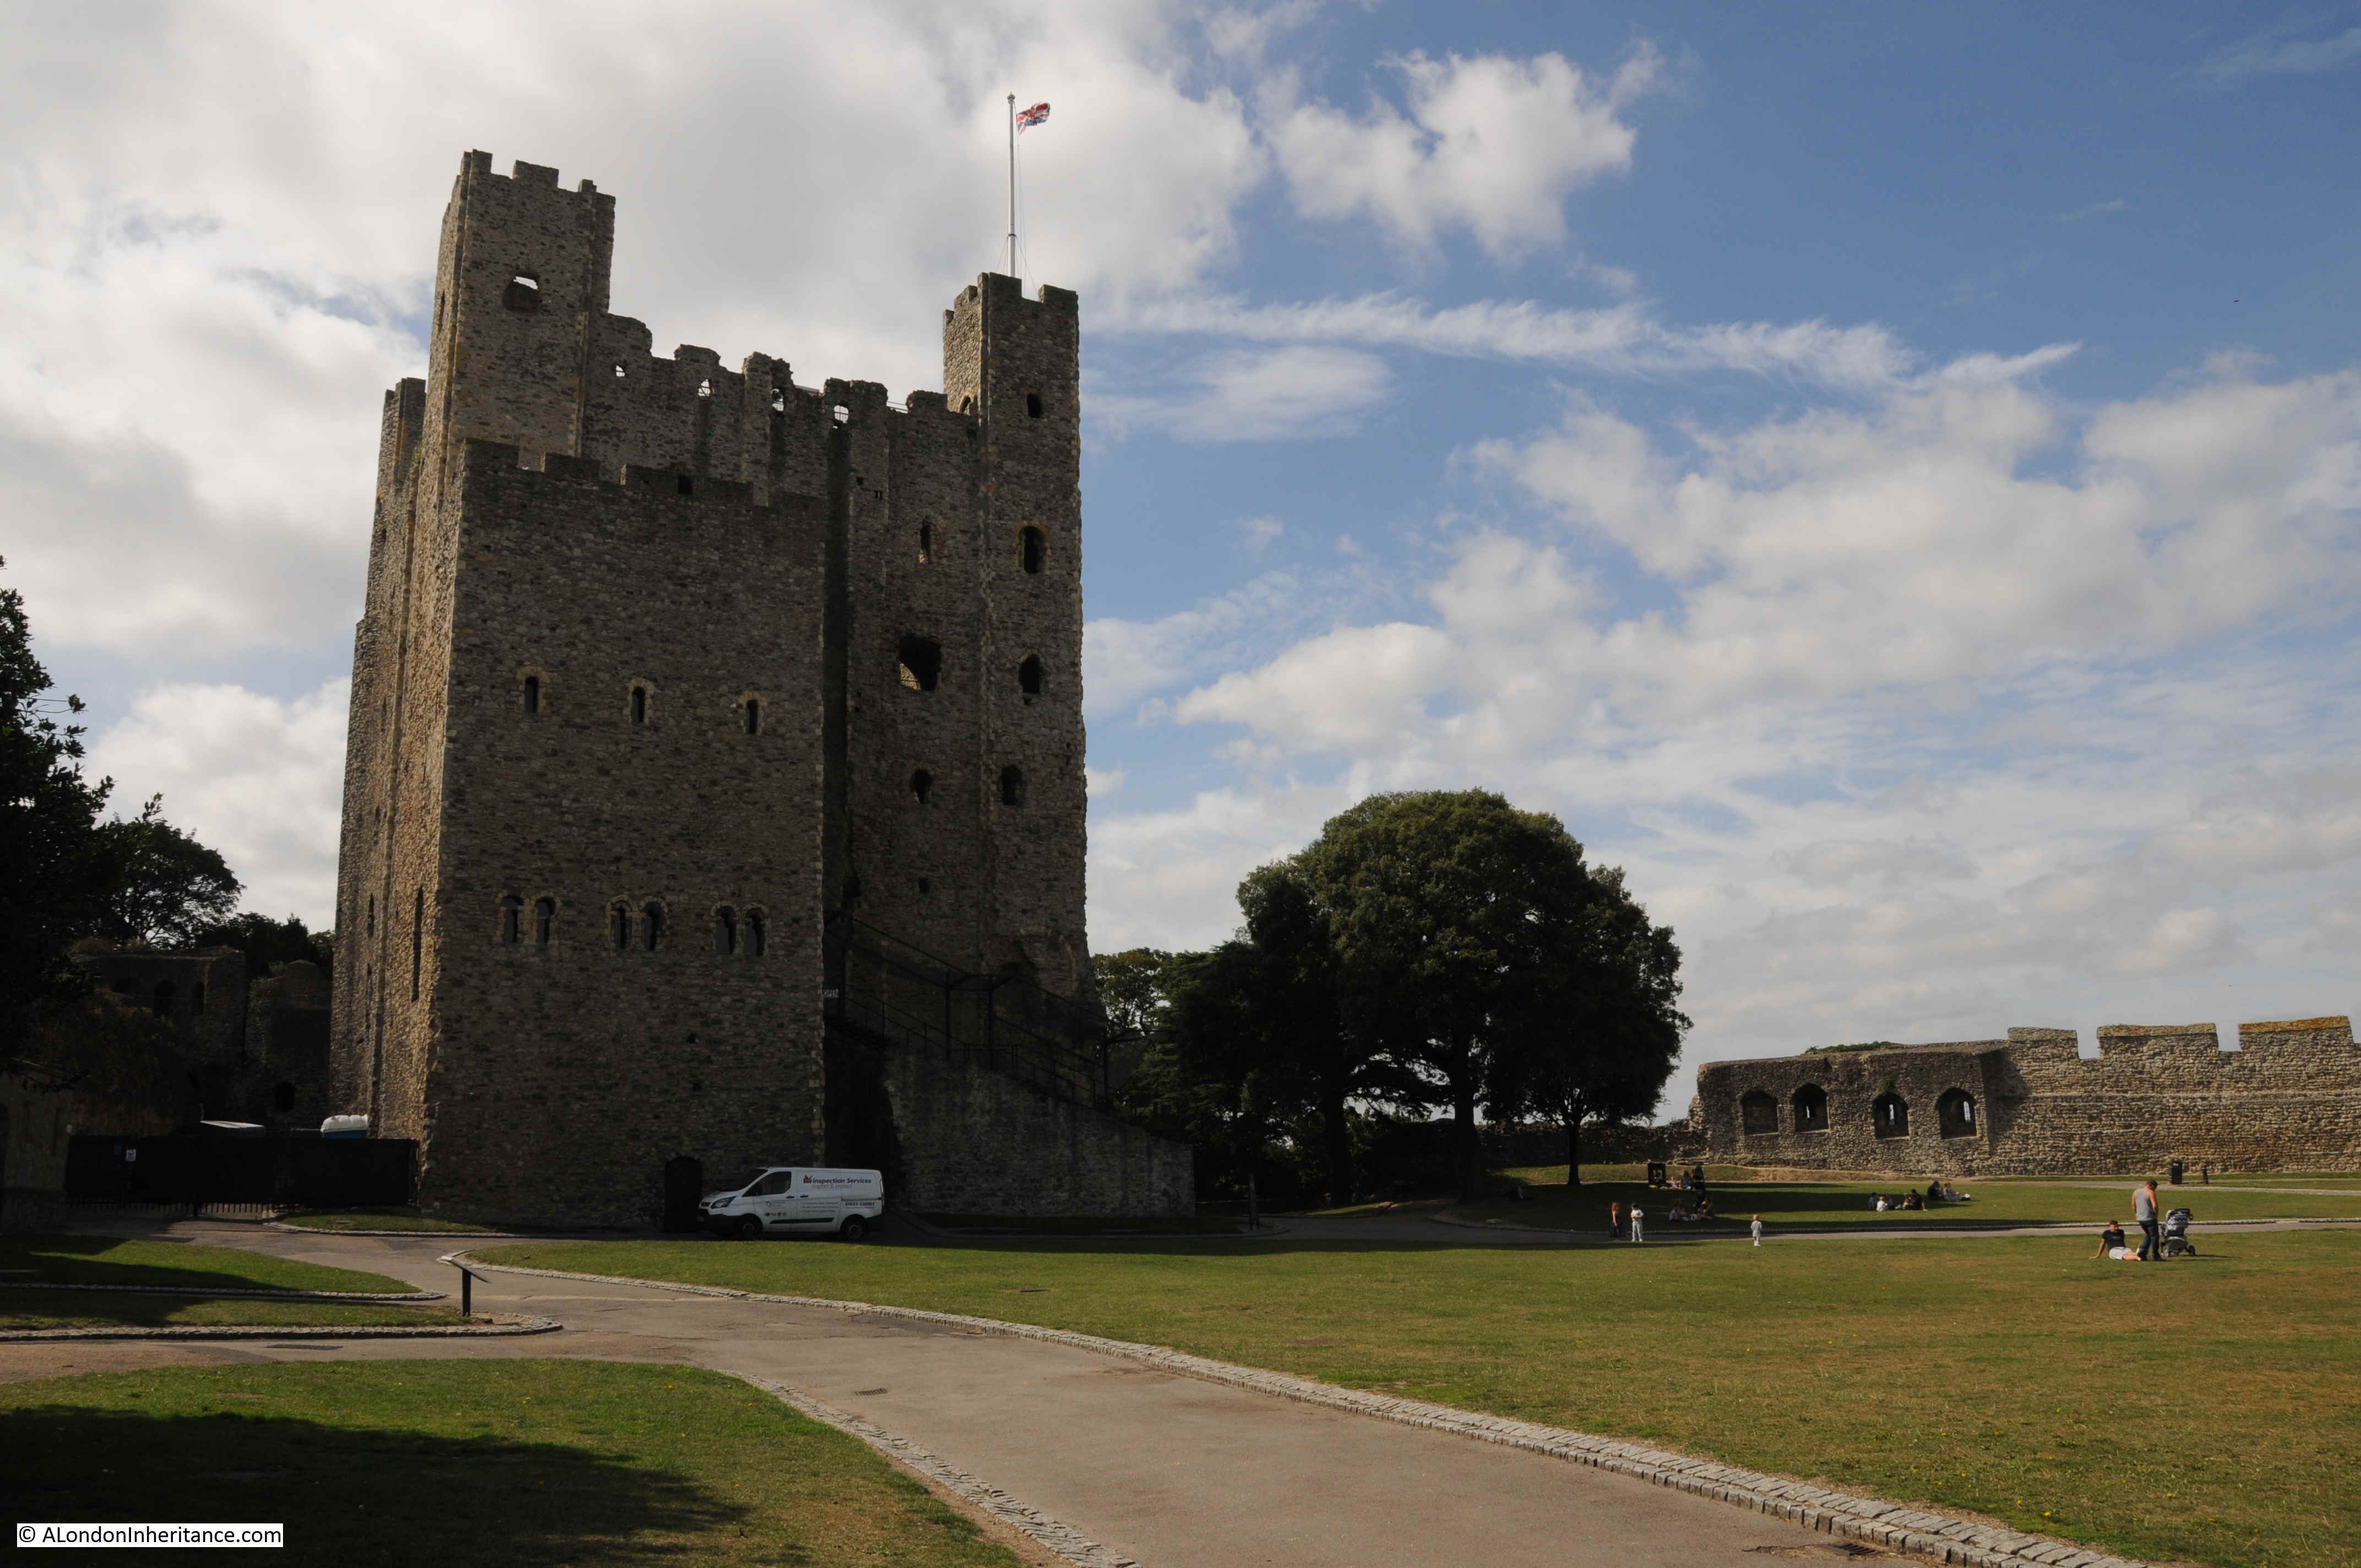
At the north western tip of the town is Rochester Castle, despite being almost 1,000 years old, it is still a domineering structure, built to overlook the River Medway and river crossing. This is the view of the castle from in front of the Cathedral.
As well as wanting to explore the town, I had a specific reason to visit Rochester as my father had taken a photo of the castle in 1952 from across the river. I could not get to the same place as there was construction work along the road from where the following photo was taken, however it does show how the castle appeared to anyone travelling along the river, and the nearby river crossing.
The original castle was constructed during the 1080s by Gundulf, Bishop of Rochester, and consisted of an earth mound and timber ring work fortification. The Great Keep dates from the 12th century when Henry I granted the castle to the Archbishop of Canterbury, on condition that the Archbishop constructed a stone castle.
Bishop Gundulf has a London connection as he was appointed by King William I to oversee the construction of the White Tower at the Tower of London.
Rochester dates from Roman times when it was the town of Durobrivae, built on an important crossing over the River Medway for a road from London to east Kent. The Norman fort was constructed for the same reasons as the Roman town, in that it protected the route from London to Dover, the channel ports and therefore to the Continent.
The Great Keep is today still a remarkable structure and apparently is the tallest such building in Europe.
Rochester Castle was involved in a couple of sieges during the 13th century. Firstly when the castle was occupied by William de Aubigny and Robert Fitzwalter, as part of the Baron’s revolt against King John. The castle was put under siege by King John who ordered that tunnels were dug under the castle walls and keep. Fires were then set to burn the timber props within the tunnels leading to the destruction of part of the castle walls and a corner of the keep.
The second siege was when the castle was held by Royalist forces in support of King Henry III , who were defending the castle during the second Barons Revolt when Simon de Montfort, Earl of Leicester attempted to take the castle.
The defenders held out to the point where Simon de Montfort had to withdraw.
From the mid 16th century, the castle started to fall into decline, as a defensive position adjacent to the Medway river crossing was by now redundant. Stone was robbed from the castle to build nearby Upnor Castle (which was needed to defend Royal Navy moorings on the River Medway from attack by French ships). A later fire and general deterioration furthered the decay of the castle, until it was purchased in 1884 by the Corporation of Rochester and it was opened to the public.
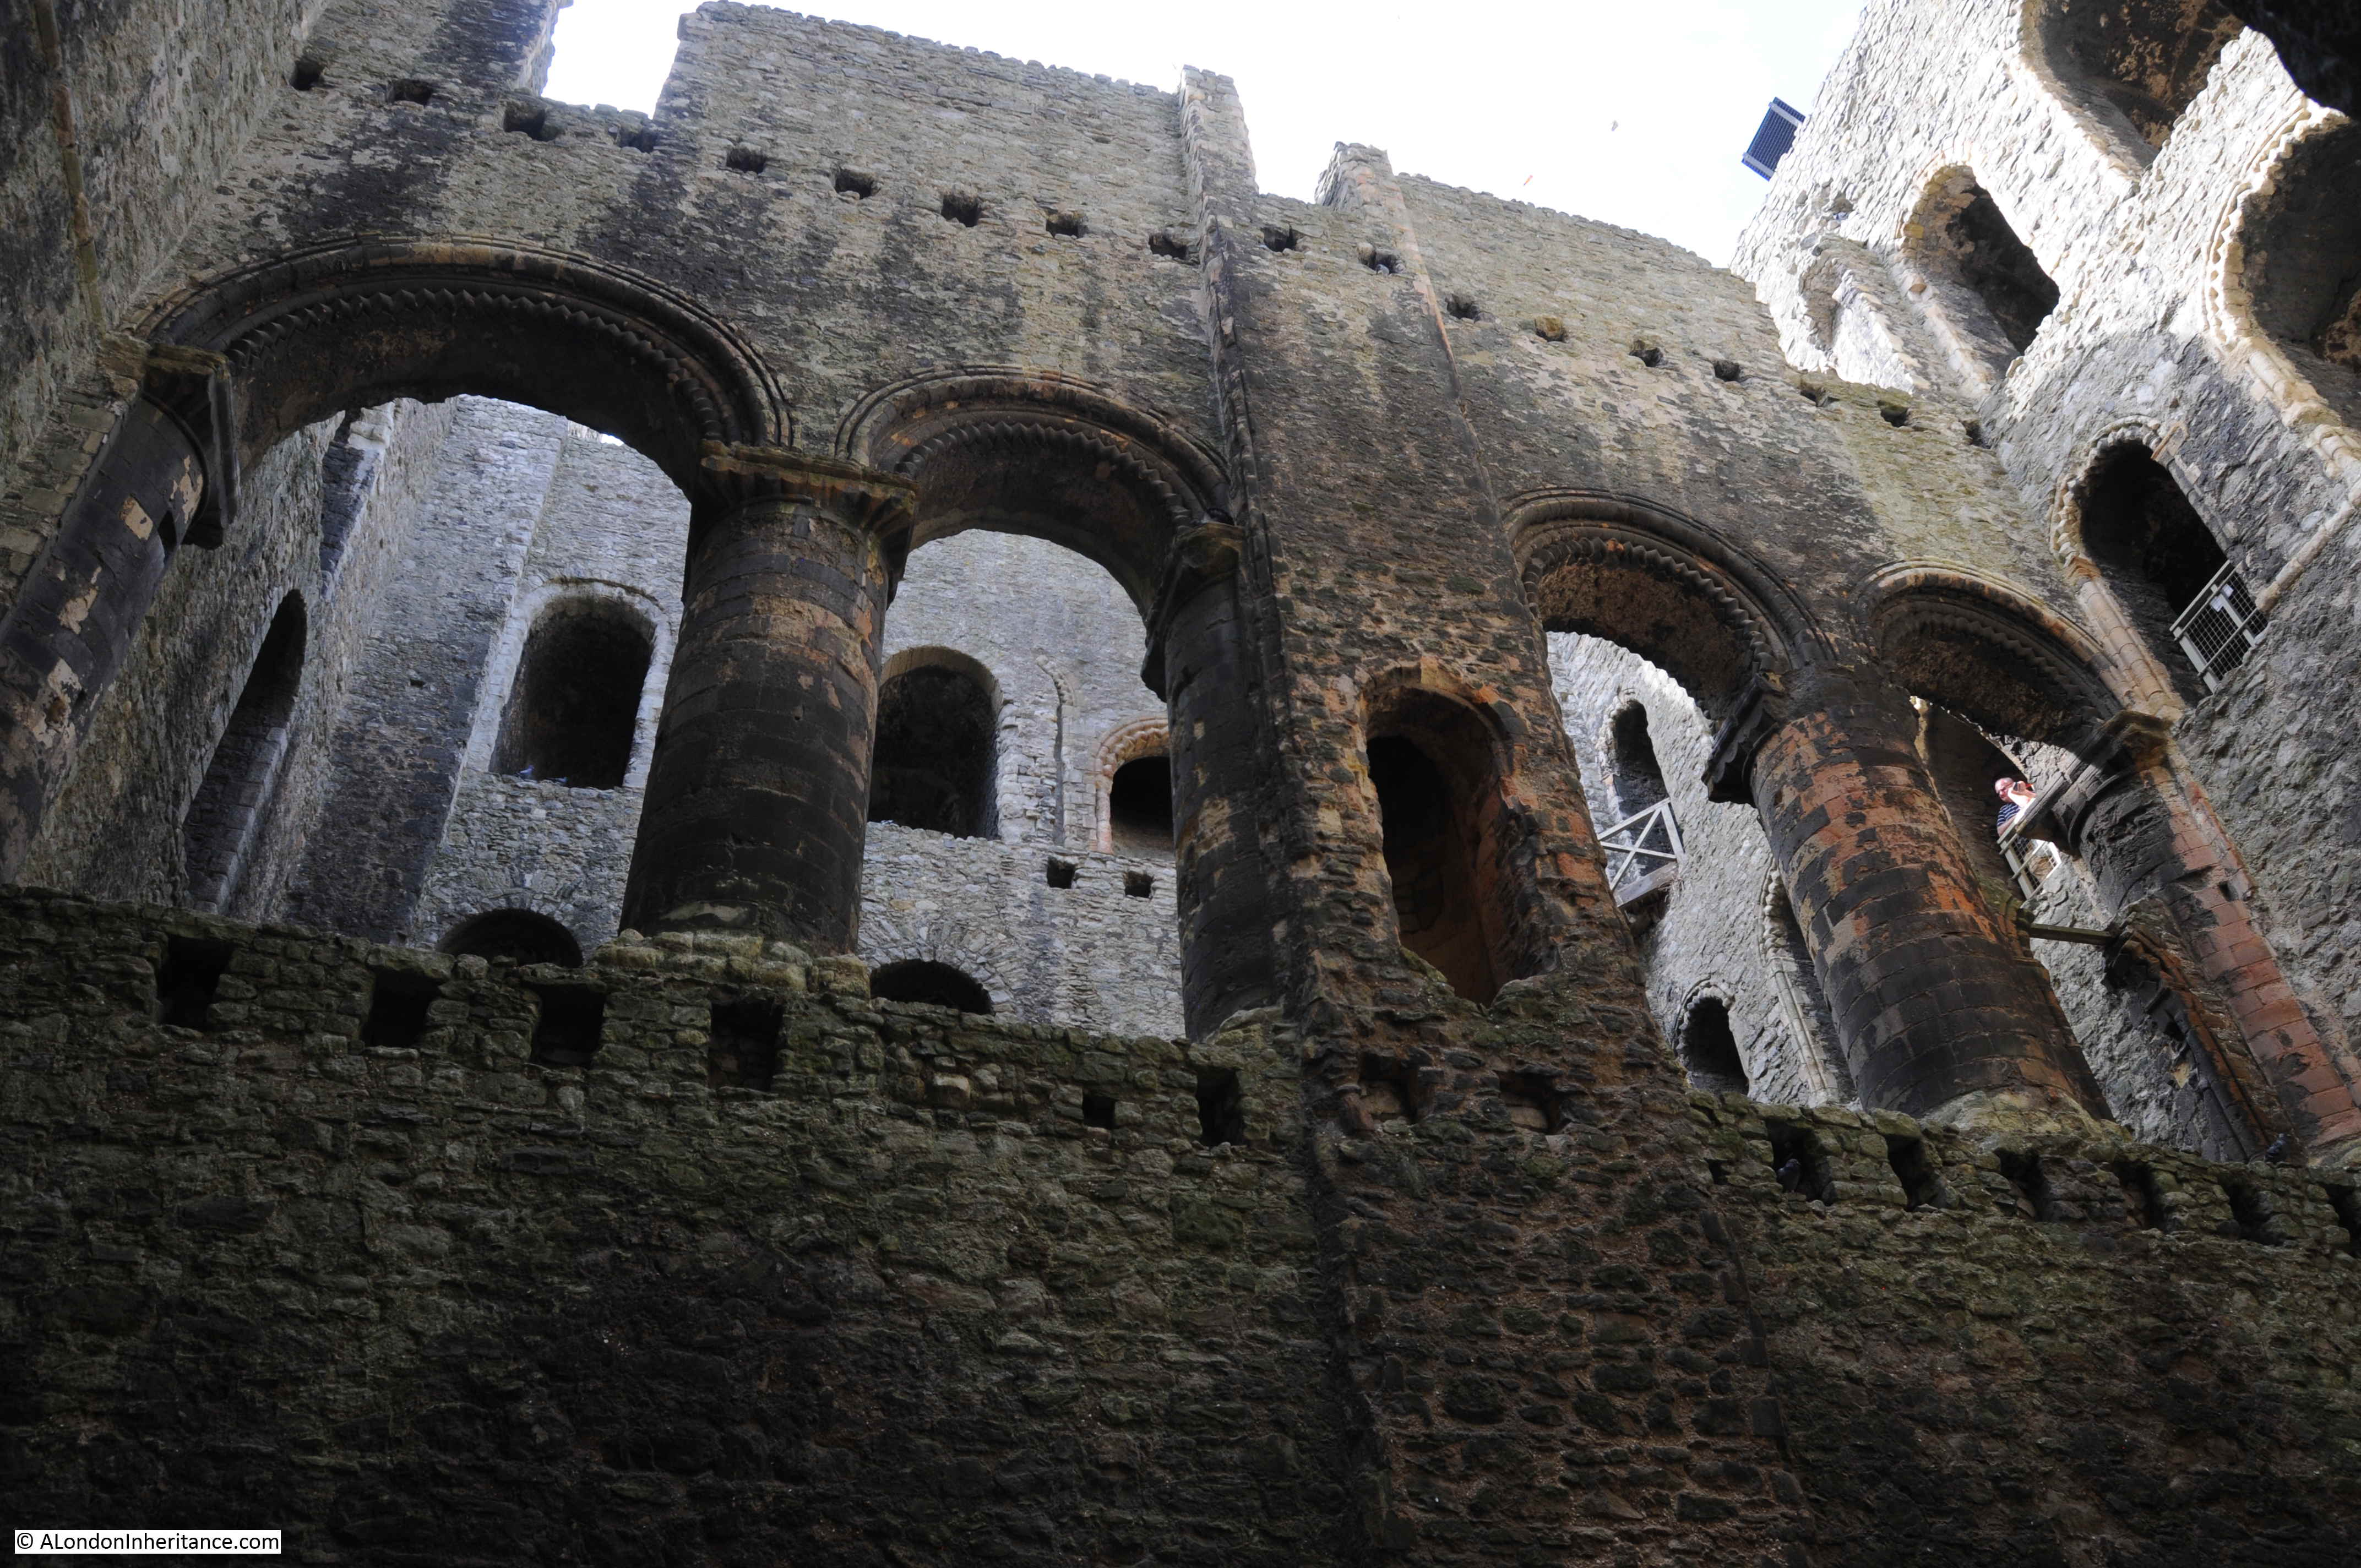
The interior of the keep is today open to the elements and consists of the surrounding walls and a central wall that divided the keep into two sections.
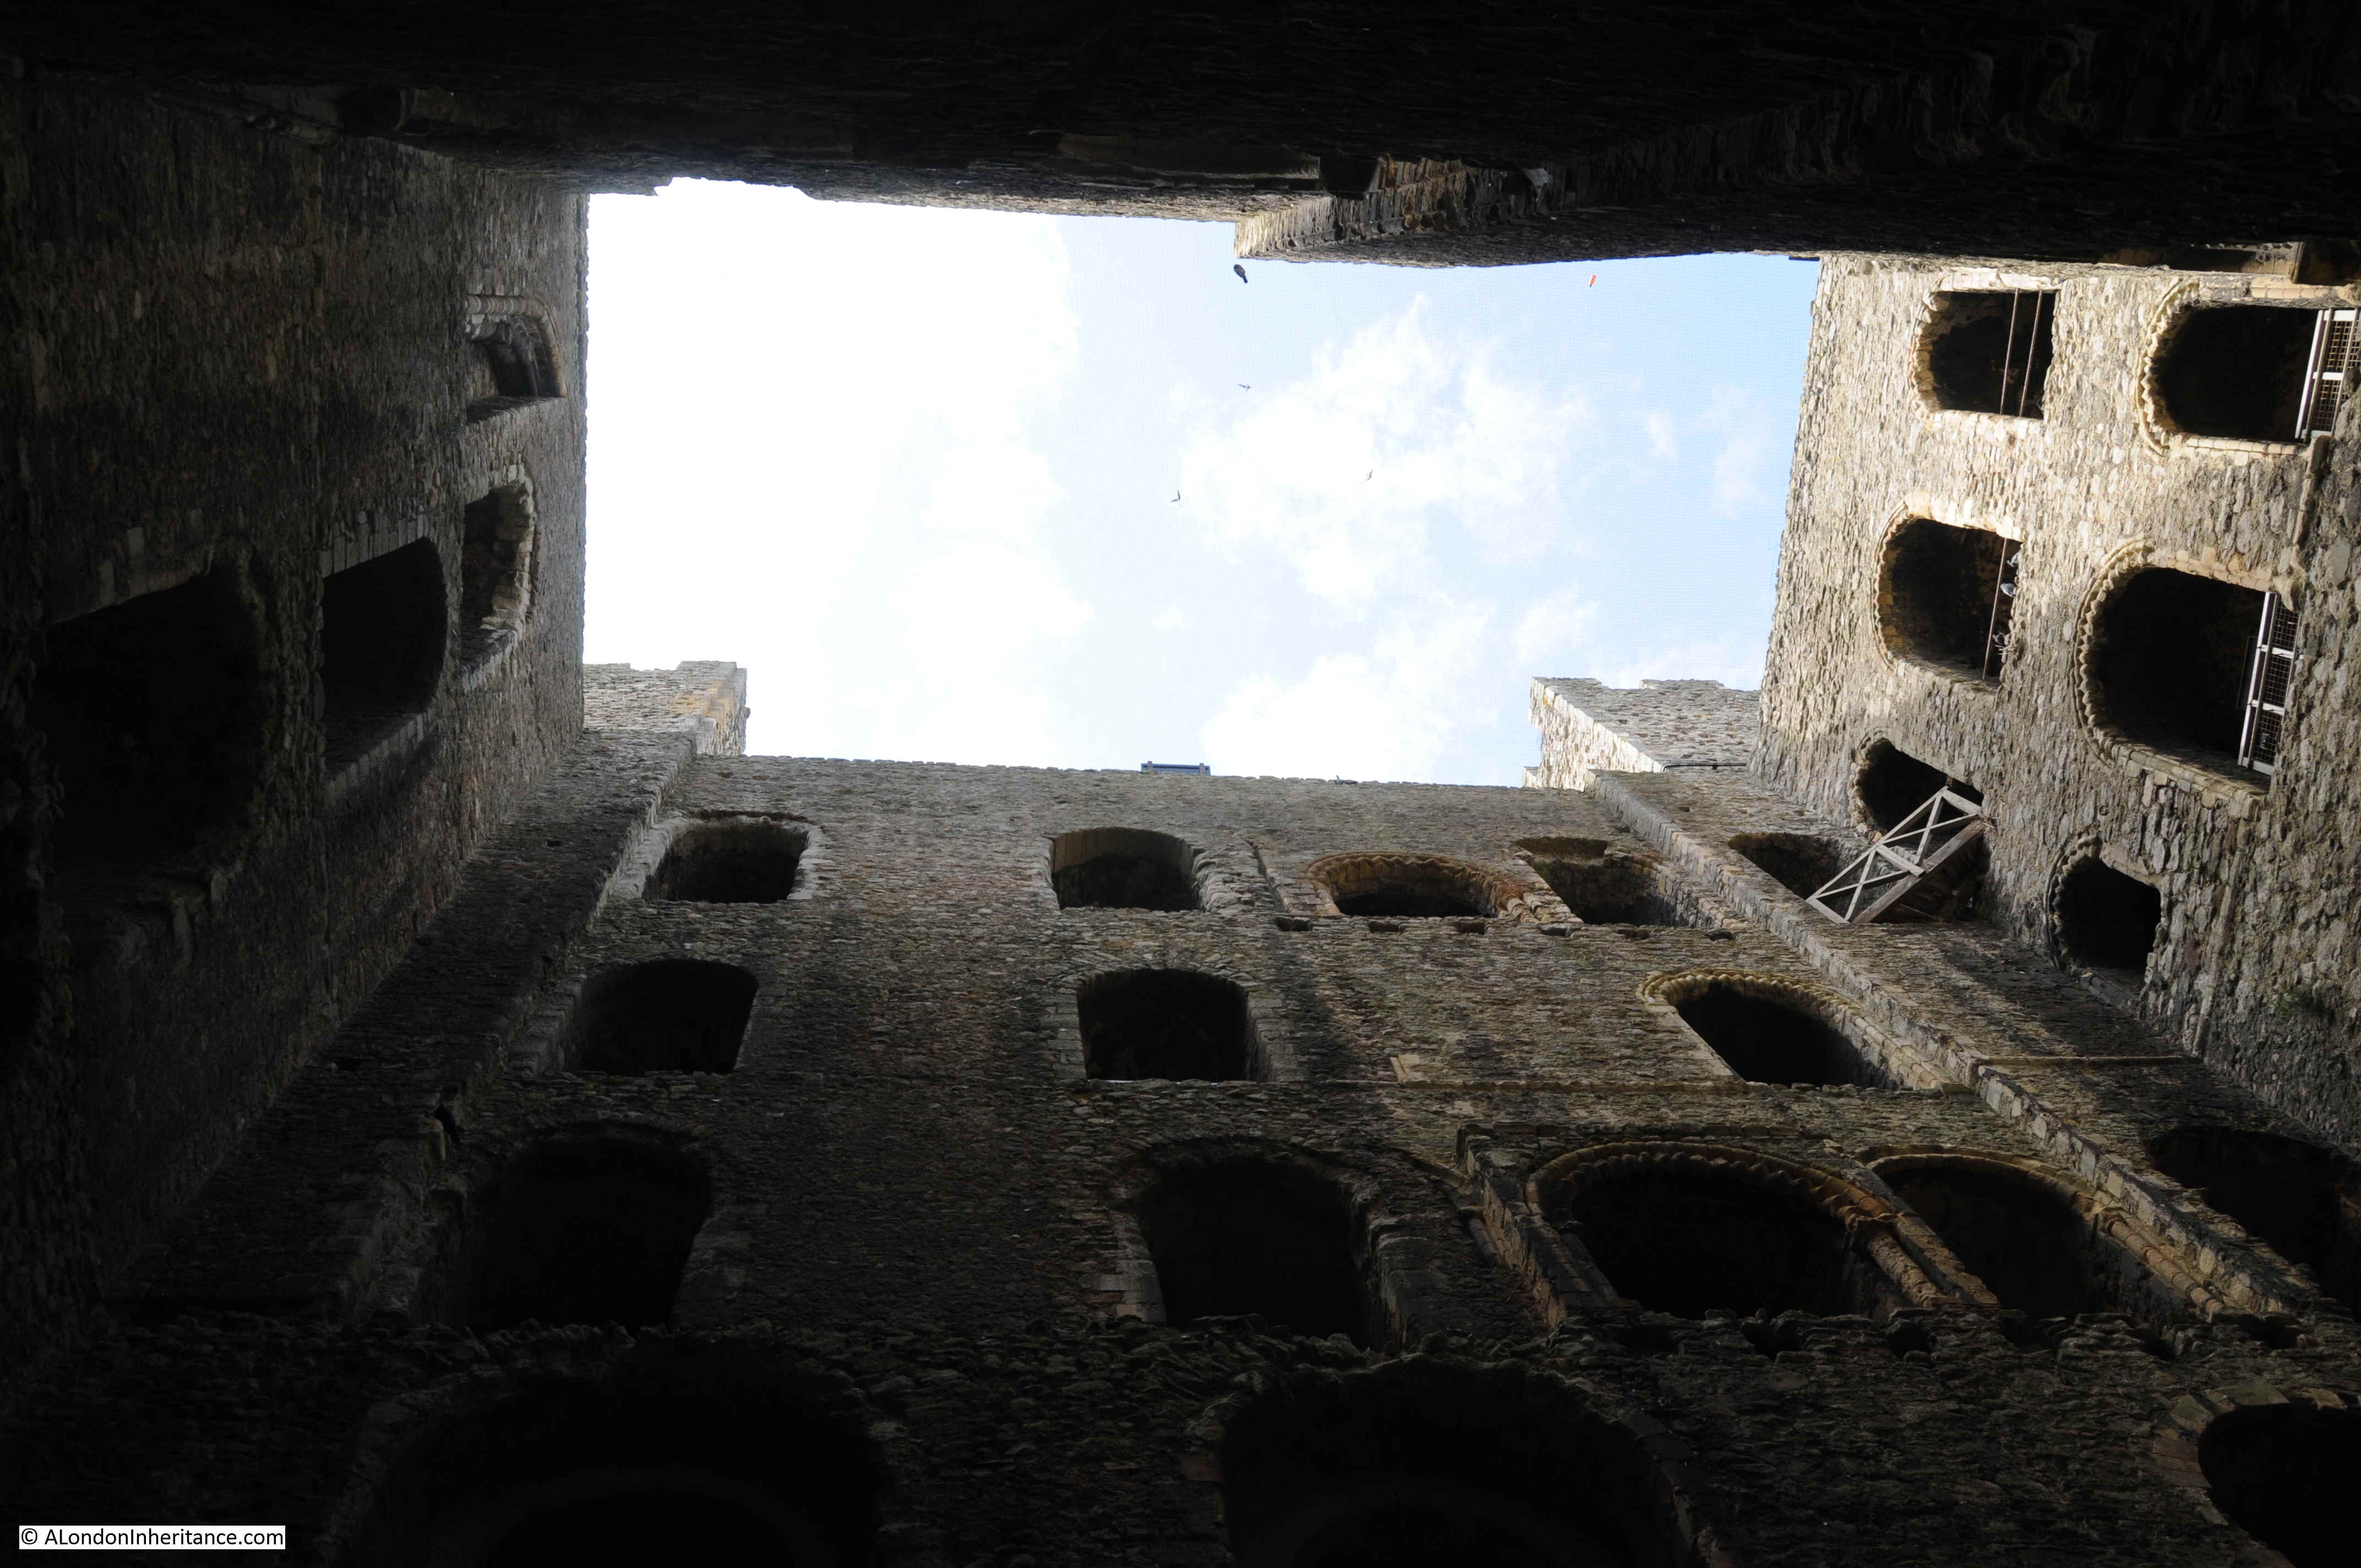
Although only the walls remain, it is very clear from the architecture, carvings, holes cut into the walls to support floors etc. that this must have been an incredibly impressive structure.
Walkway along the top of the castle:

Which provides some brilliant views over the surrounding countryside.
In the photo below is the key river crossing over the River Medway. A crossing here dates from Roman times when the road from London onward to Canterbury and the channel ports crossed the river at this point. The importance of the crossing is the reason for Rochester’s location and the justification for the castle, built to defend the crossing.

The castle provides some magnificent views of Rochester Cathedral, which was my next stop in my exploration of Rochester:
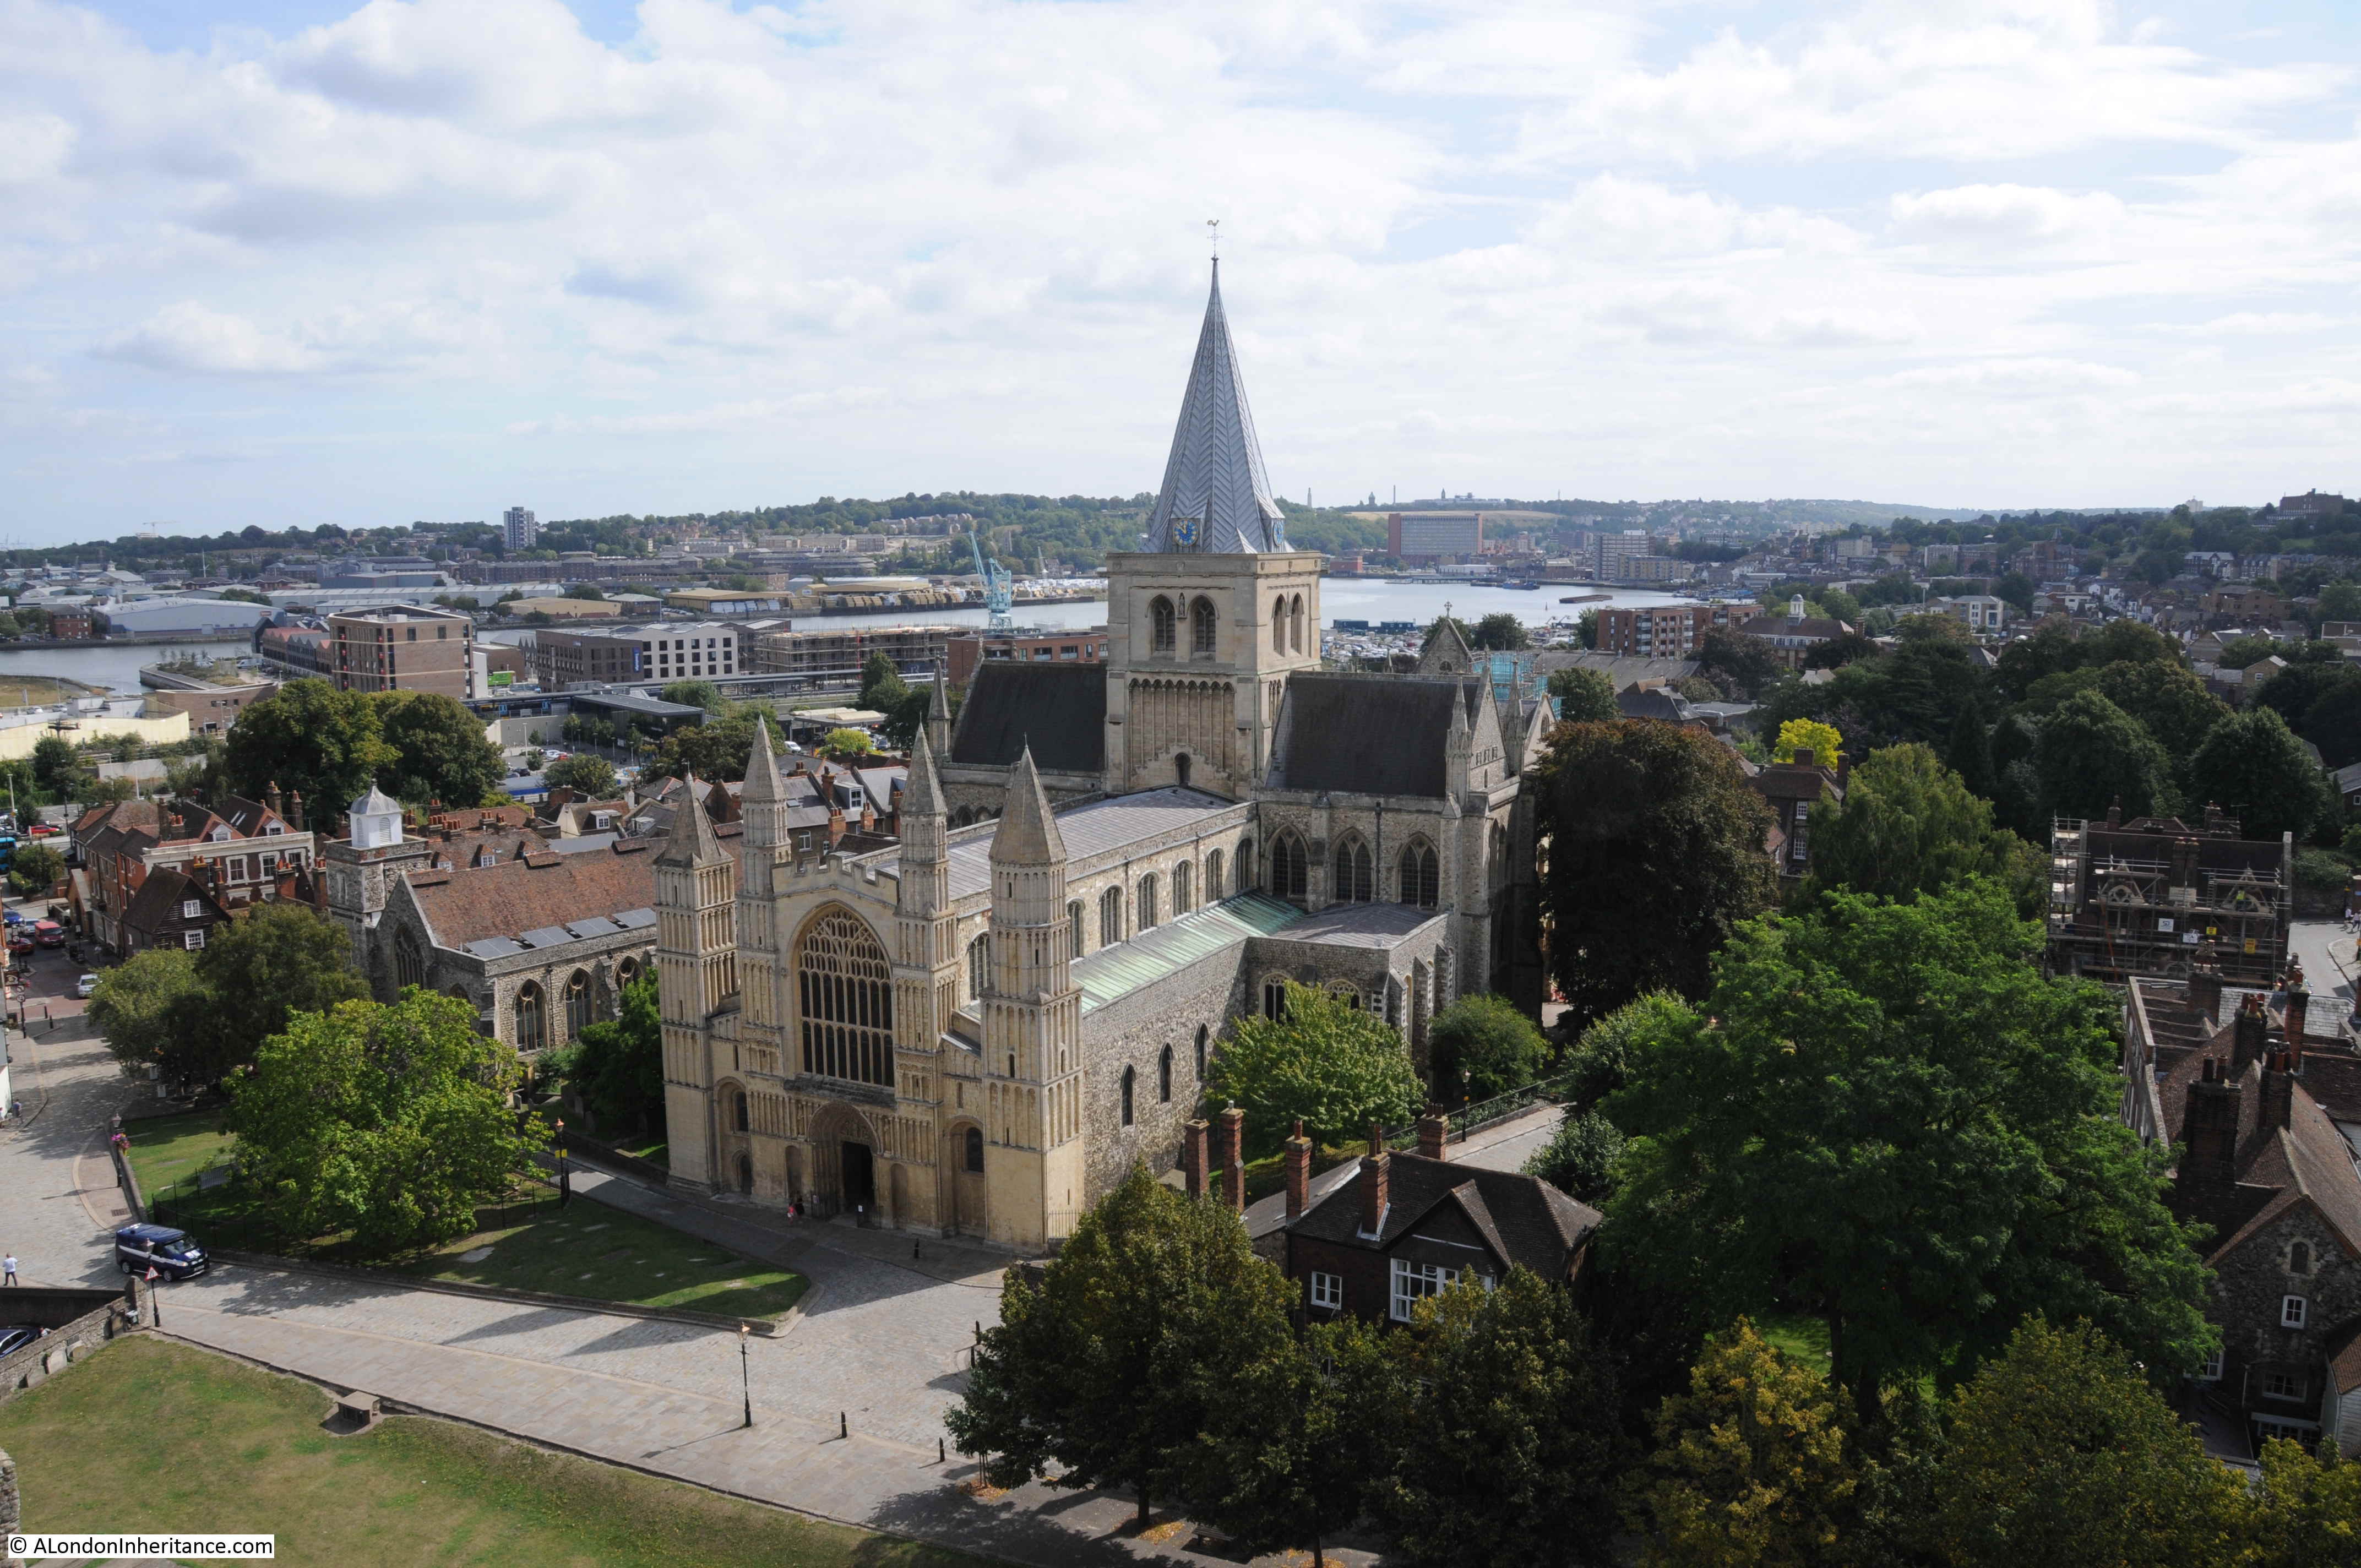
On walking into the Cathedral I was greeted with a rather surprising sight. The nave had been taken over by a mini golf installation, arranged for charity, and there were families with children playing golf in a most unusual setting. The following photo is the view along the nave, above the heads of the golf players.

The earliest church in Rochester dates from 604, when King Ethelbert donated land for a church.
Building of the Cathedral we see today was commenced in 1083 by the same Gundulf, Bishop of Rochester who was responsible for the construction of the first castle.
The nave was the first part of the Cathedral to be completed, with consecration of the cathedral in 1130 in front of King Henry I.
The cathedral was badly damaged during the sieges of the castle in the 13th century, and there was further restoration work and building during the following centuries. The cathedral was damaged again during the Civil War by Parliamentarian soldiers.
George Gilbert Scott carried out major restoration work during the late 19th century and the present tower and spire were dedicated in 1904.
Rochester Cathedral has a remarkable wall painting, only part of which survives. This is the Wheel of Fortune dating from the 1200s.
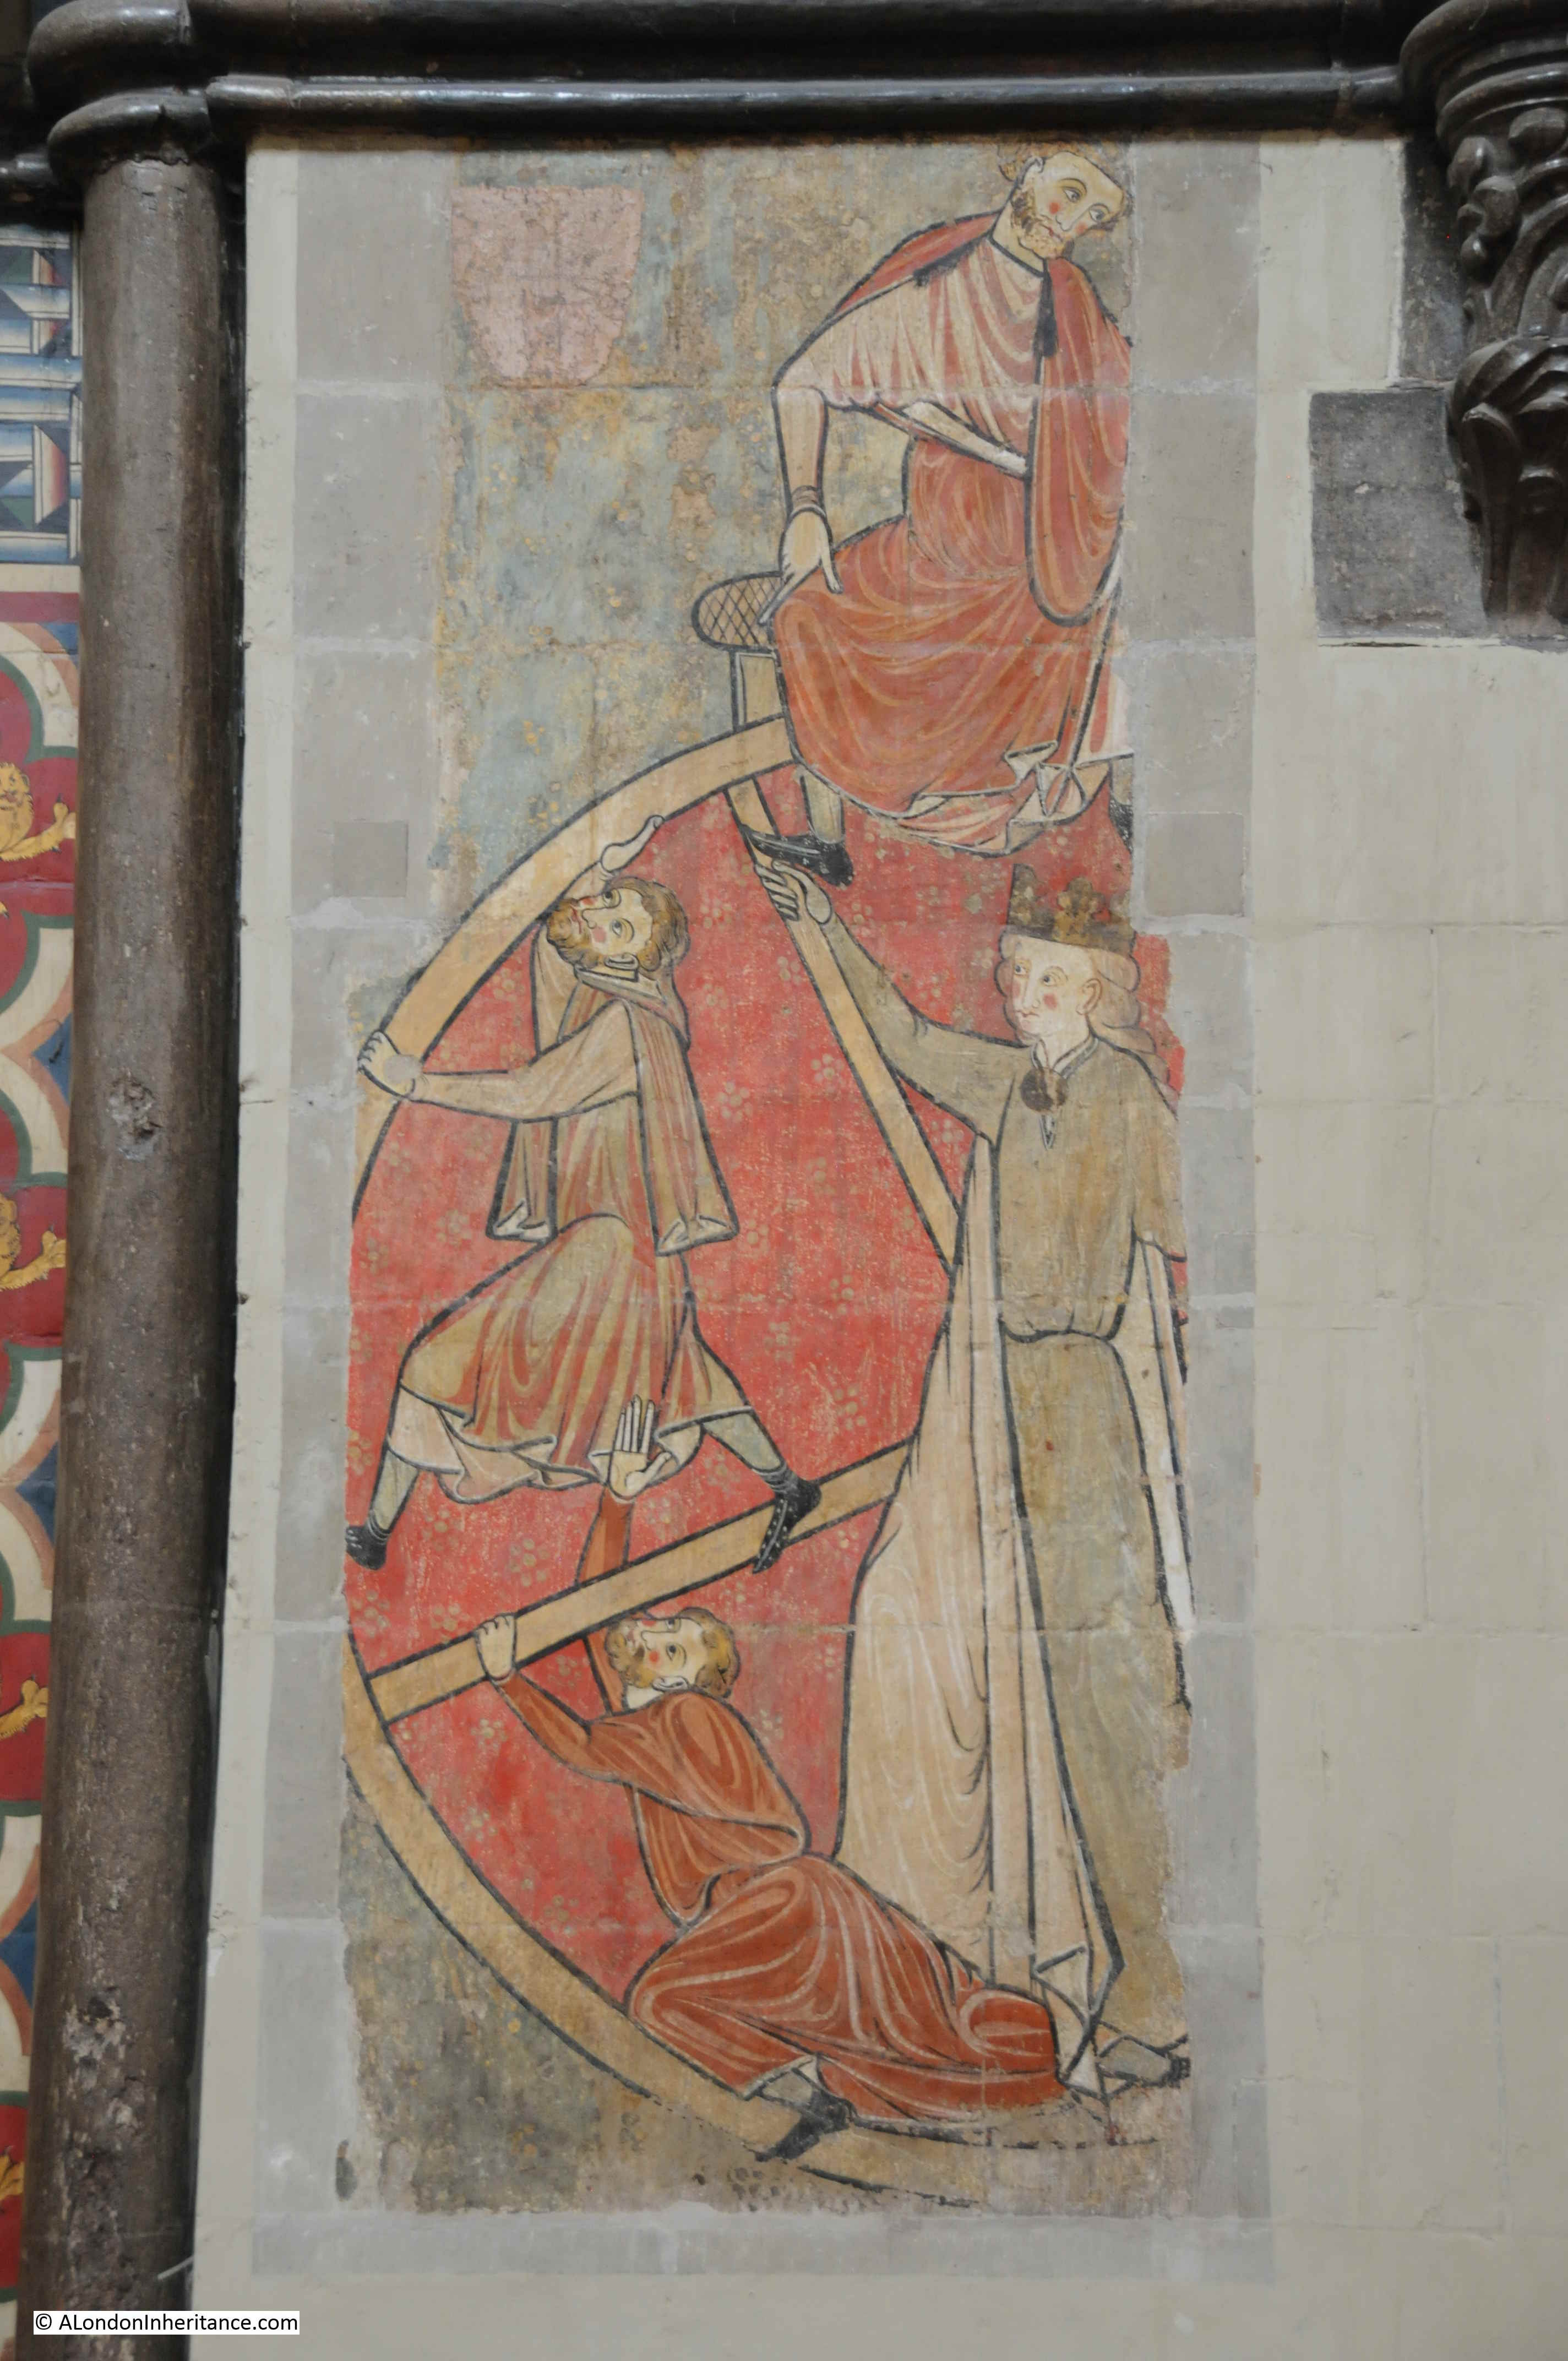
The missing part of the painting was destroyed during the Civil War. It was then covered by a Pulpit and only discovered again during 19th century restoration work.
The Wheel of Fortune was a common medieval representation of how a rise in status in society could just as swiftly be followed by a fall. The women in the middle, controlling the wheel is Fortuna. The three men holding on to the wheel represent those at different levels of success within life. The man at the top of the wheel is wealthy and powerful.
The two men on the left are working their way up in life, starting from the lowest level of society at the bottom of the wheel.
The man at the top of the wheel is sitting down, an indication that he has reached the peak of society, however he is looking to the right, possibly where a warning to the powerful would be seen. Based on similar representations, on the right of the painting there would have been a man falling to the bottom of the wheel – a warning that no matter how rich and powerful you become, the risk of a fall to the lowest levels of society are always lurking in the background.
A powerful Medieval representation, but one that is also very relevant today.
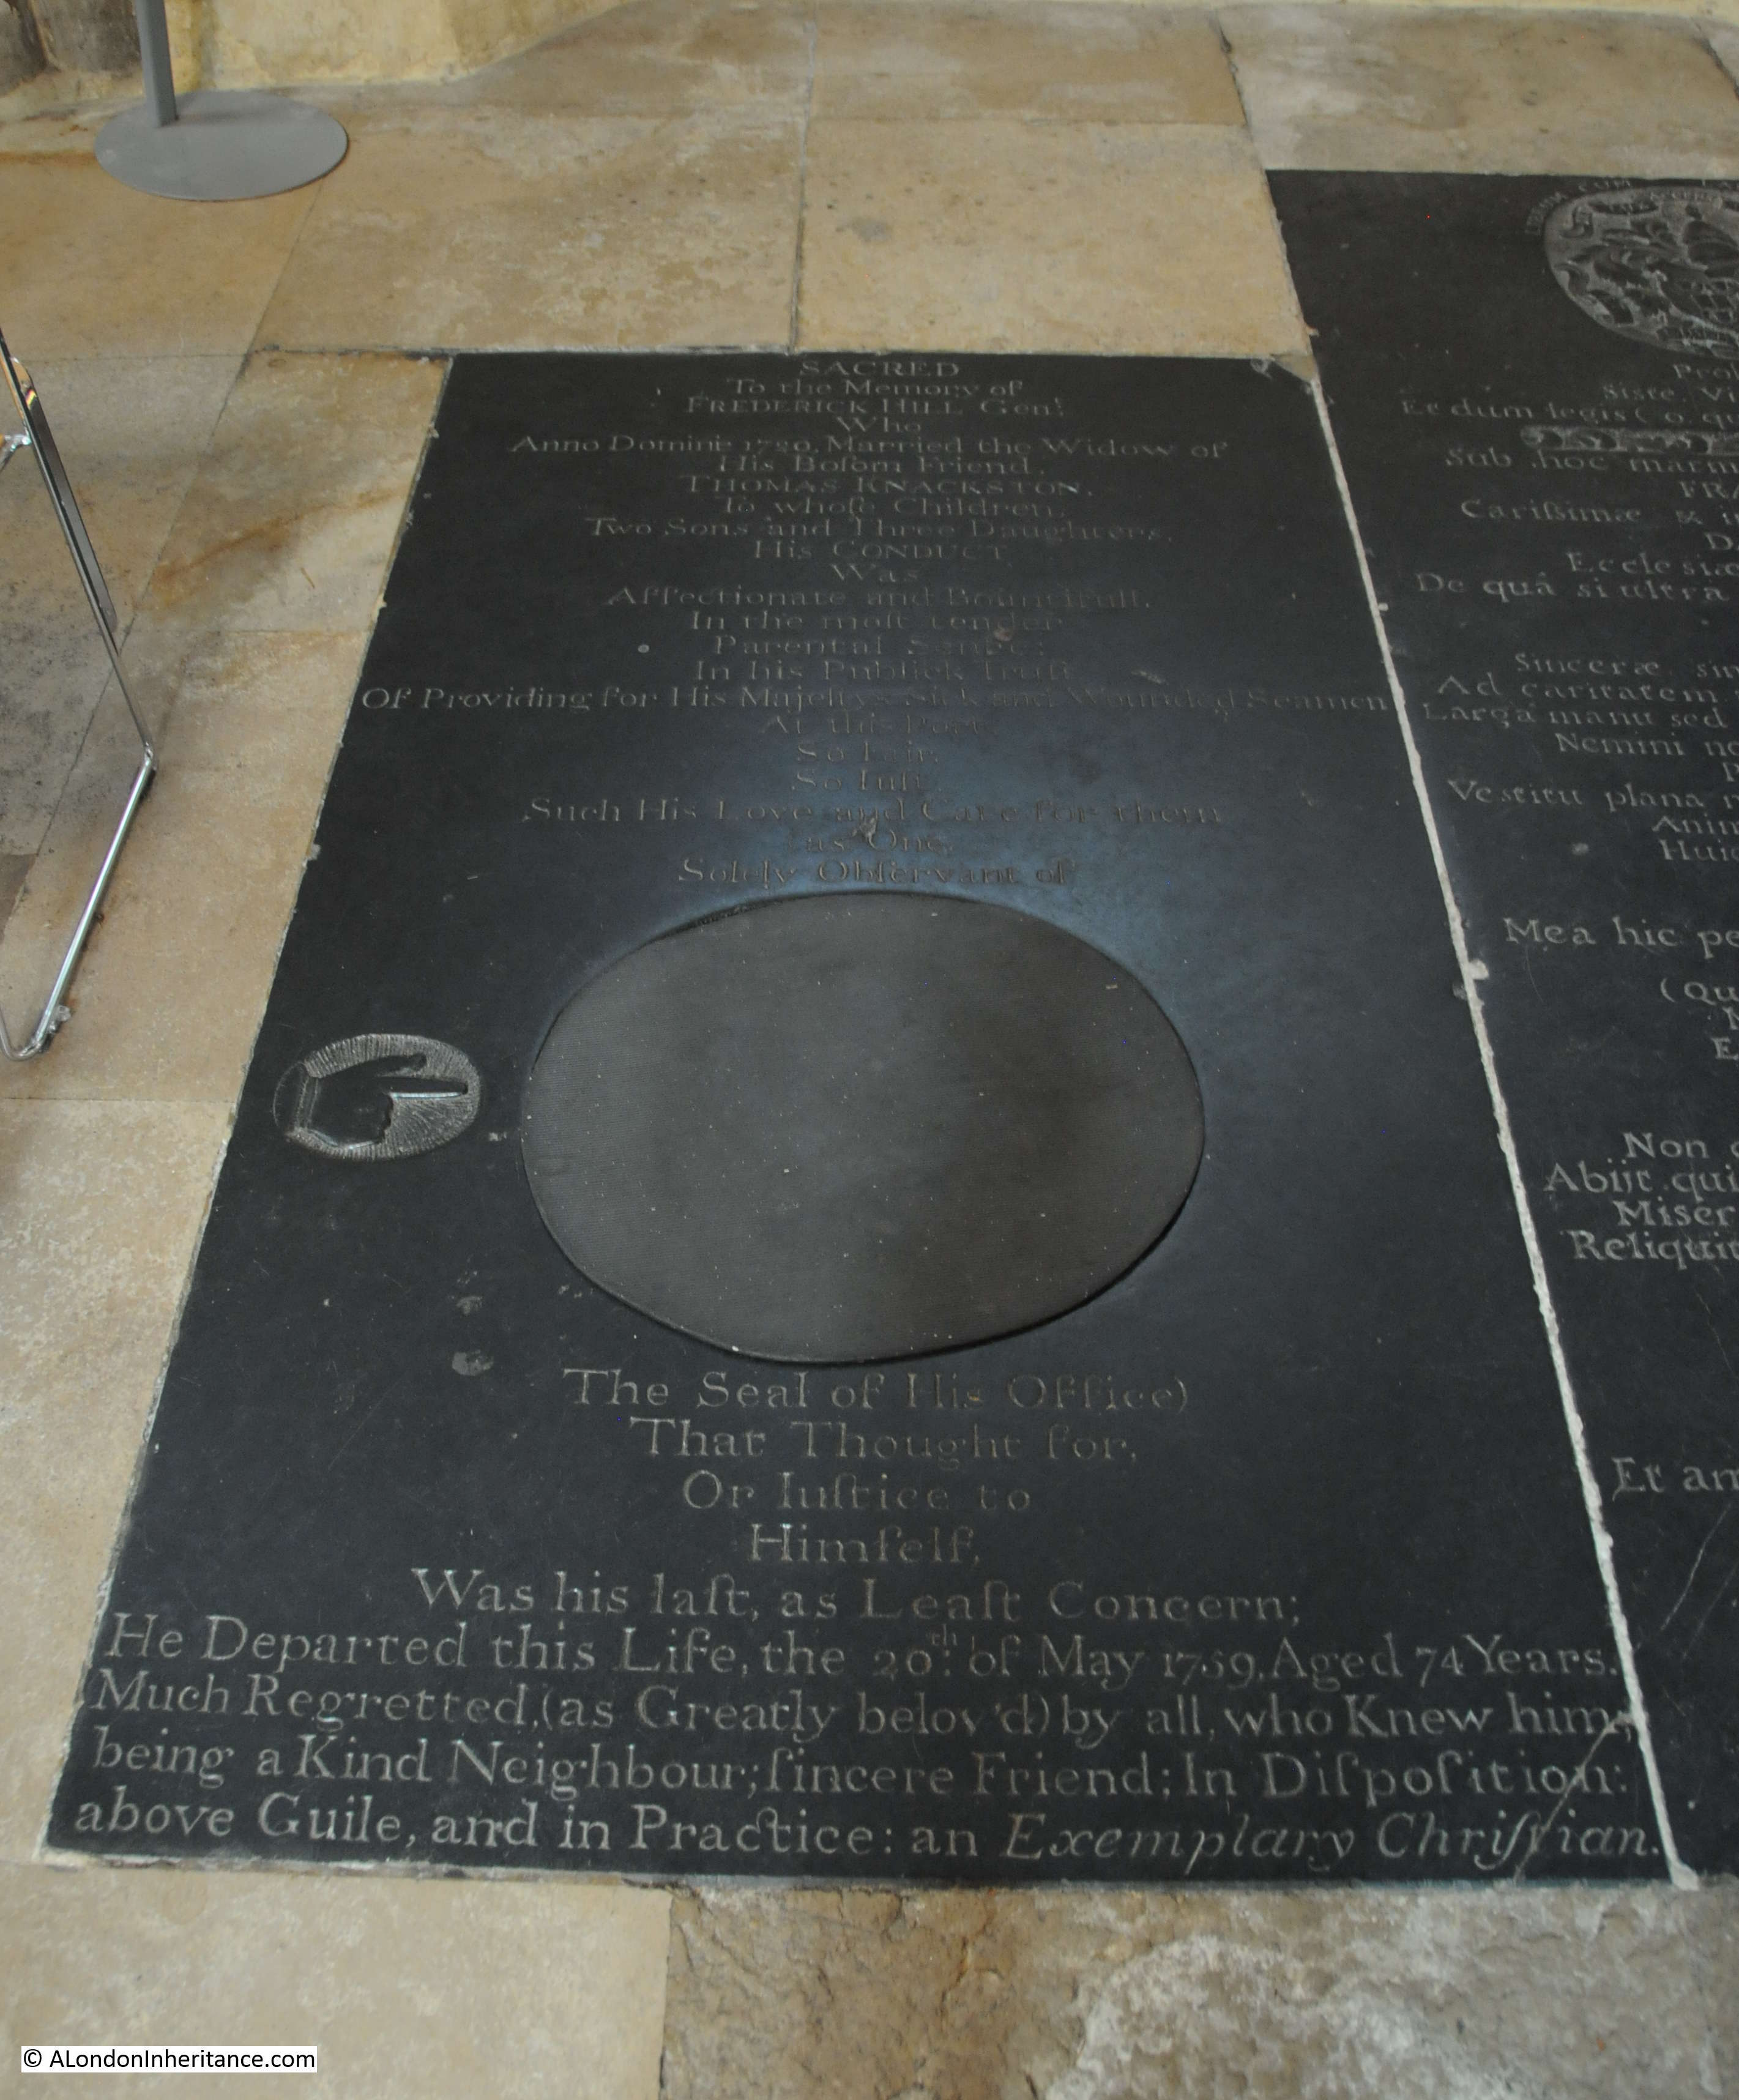
There are numerous interesting memorials across the cathedral. This one was unusual with a hand originally pointing to the seal of office of Frederick Hill, who was responsible for “Providing for His Majesty’s Sick and Wounded Seamen at this Port. So Fair, So Just, Such His Love and Care for them”. A reminder of Rochester and nearby Chatham, along with the River Medway’s part in supporting the Royal Navy over the centuries.
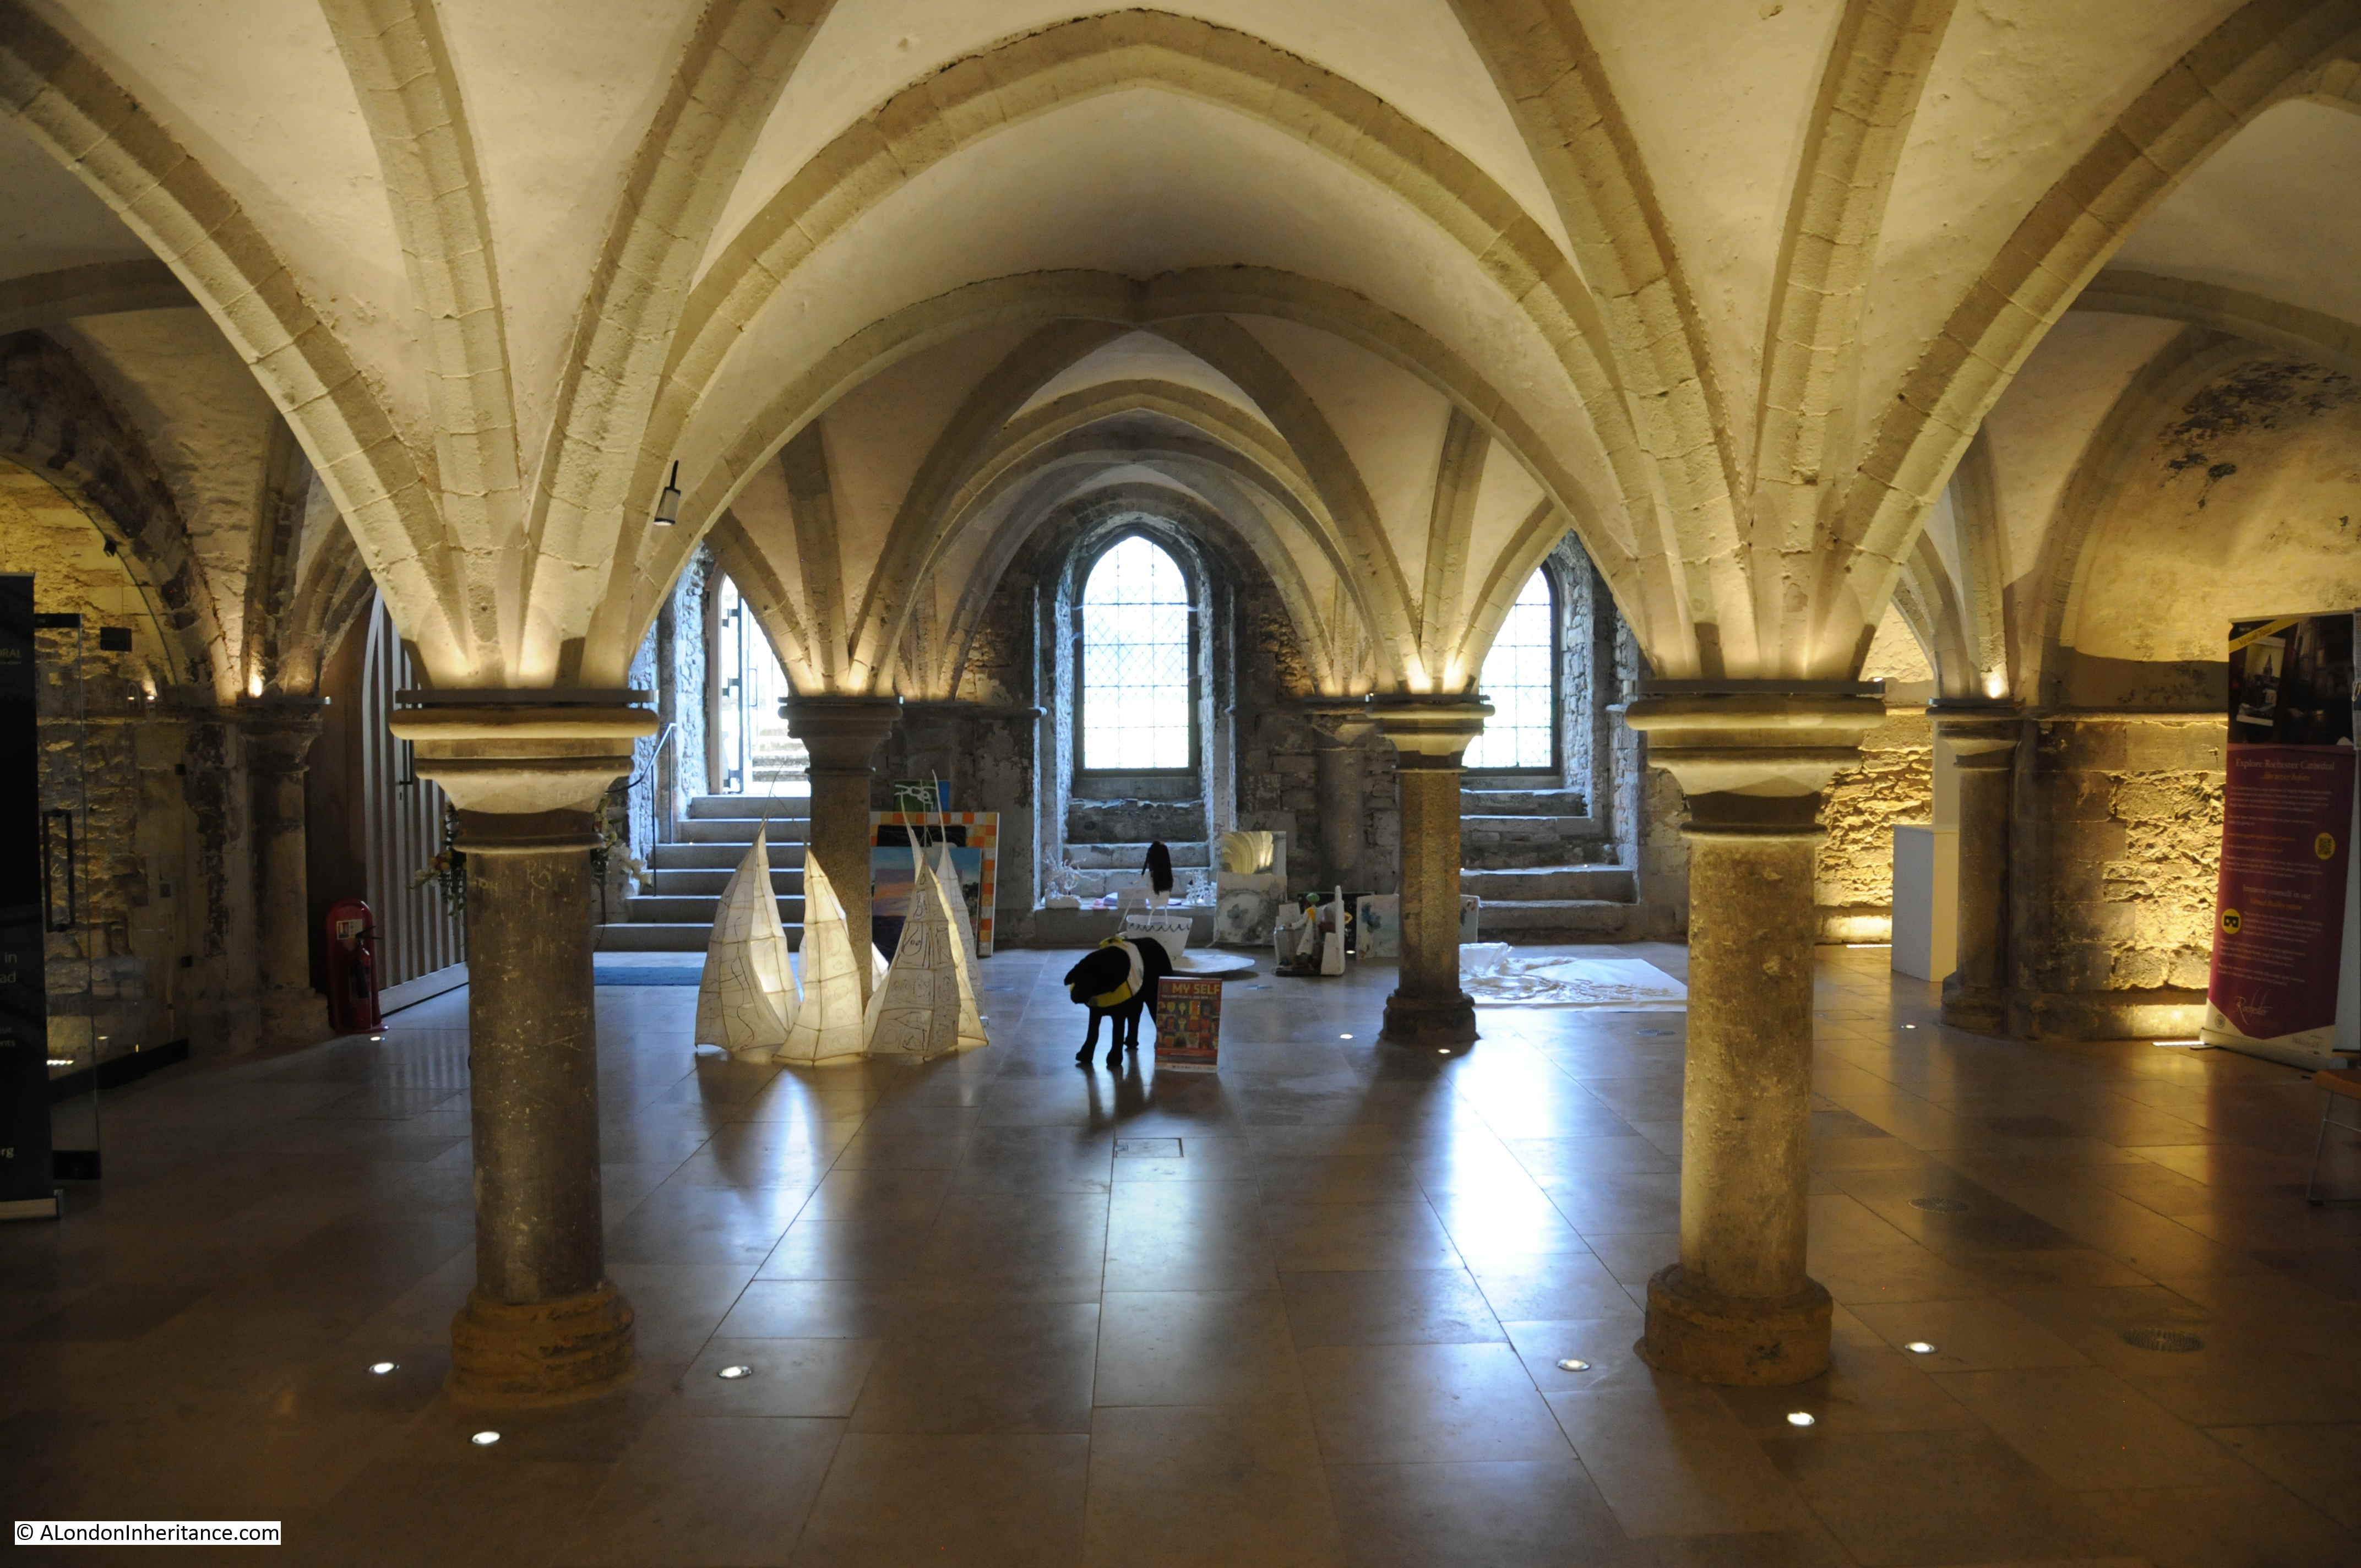
Part of the Crypt:
This remarkable door is the entrance to the Cathedral Library.
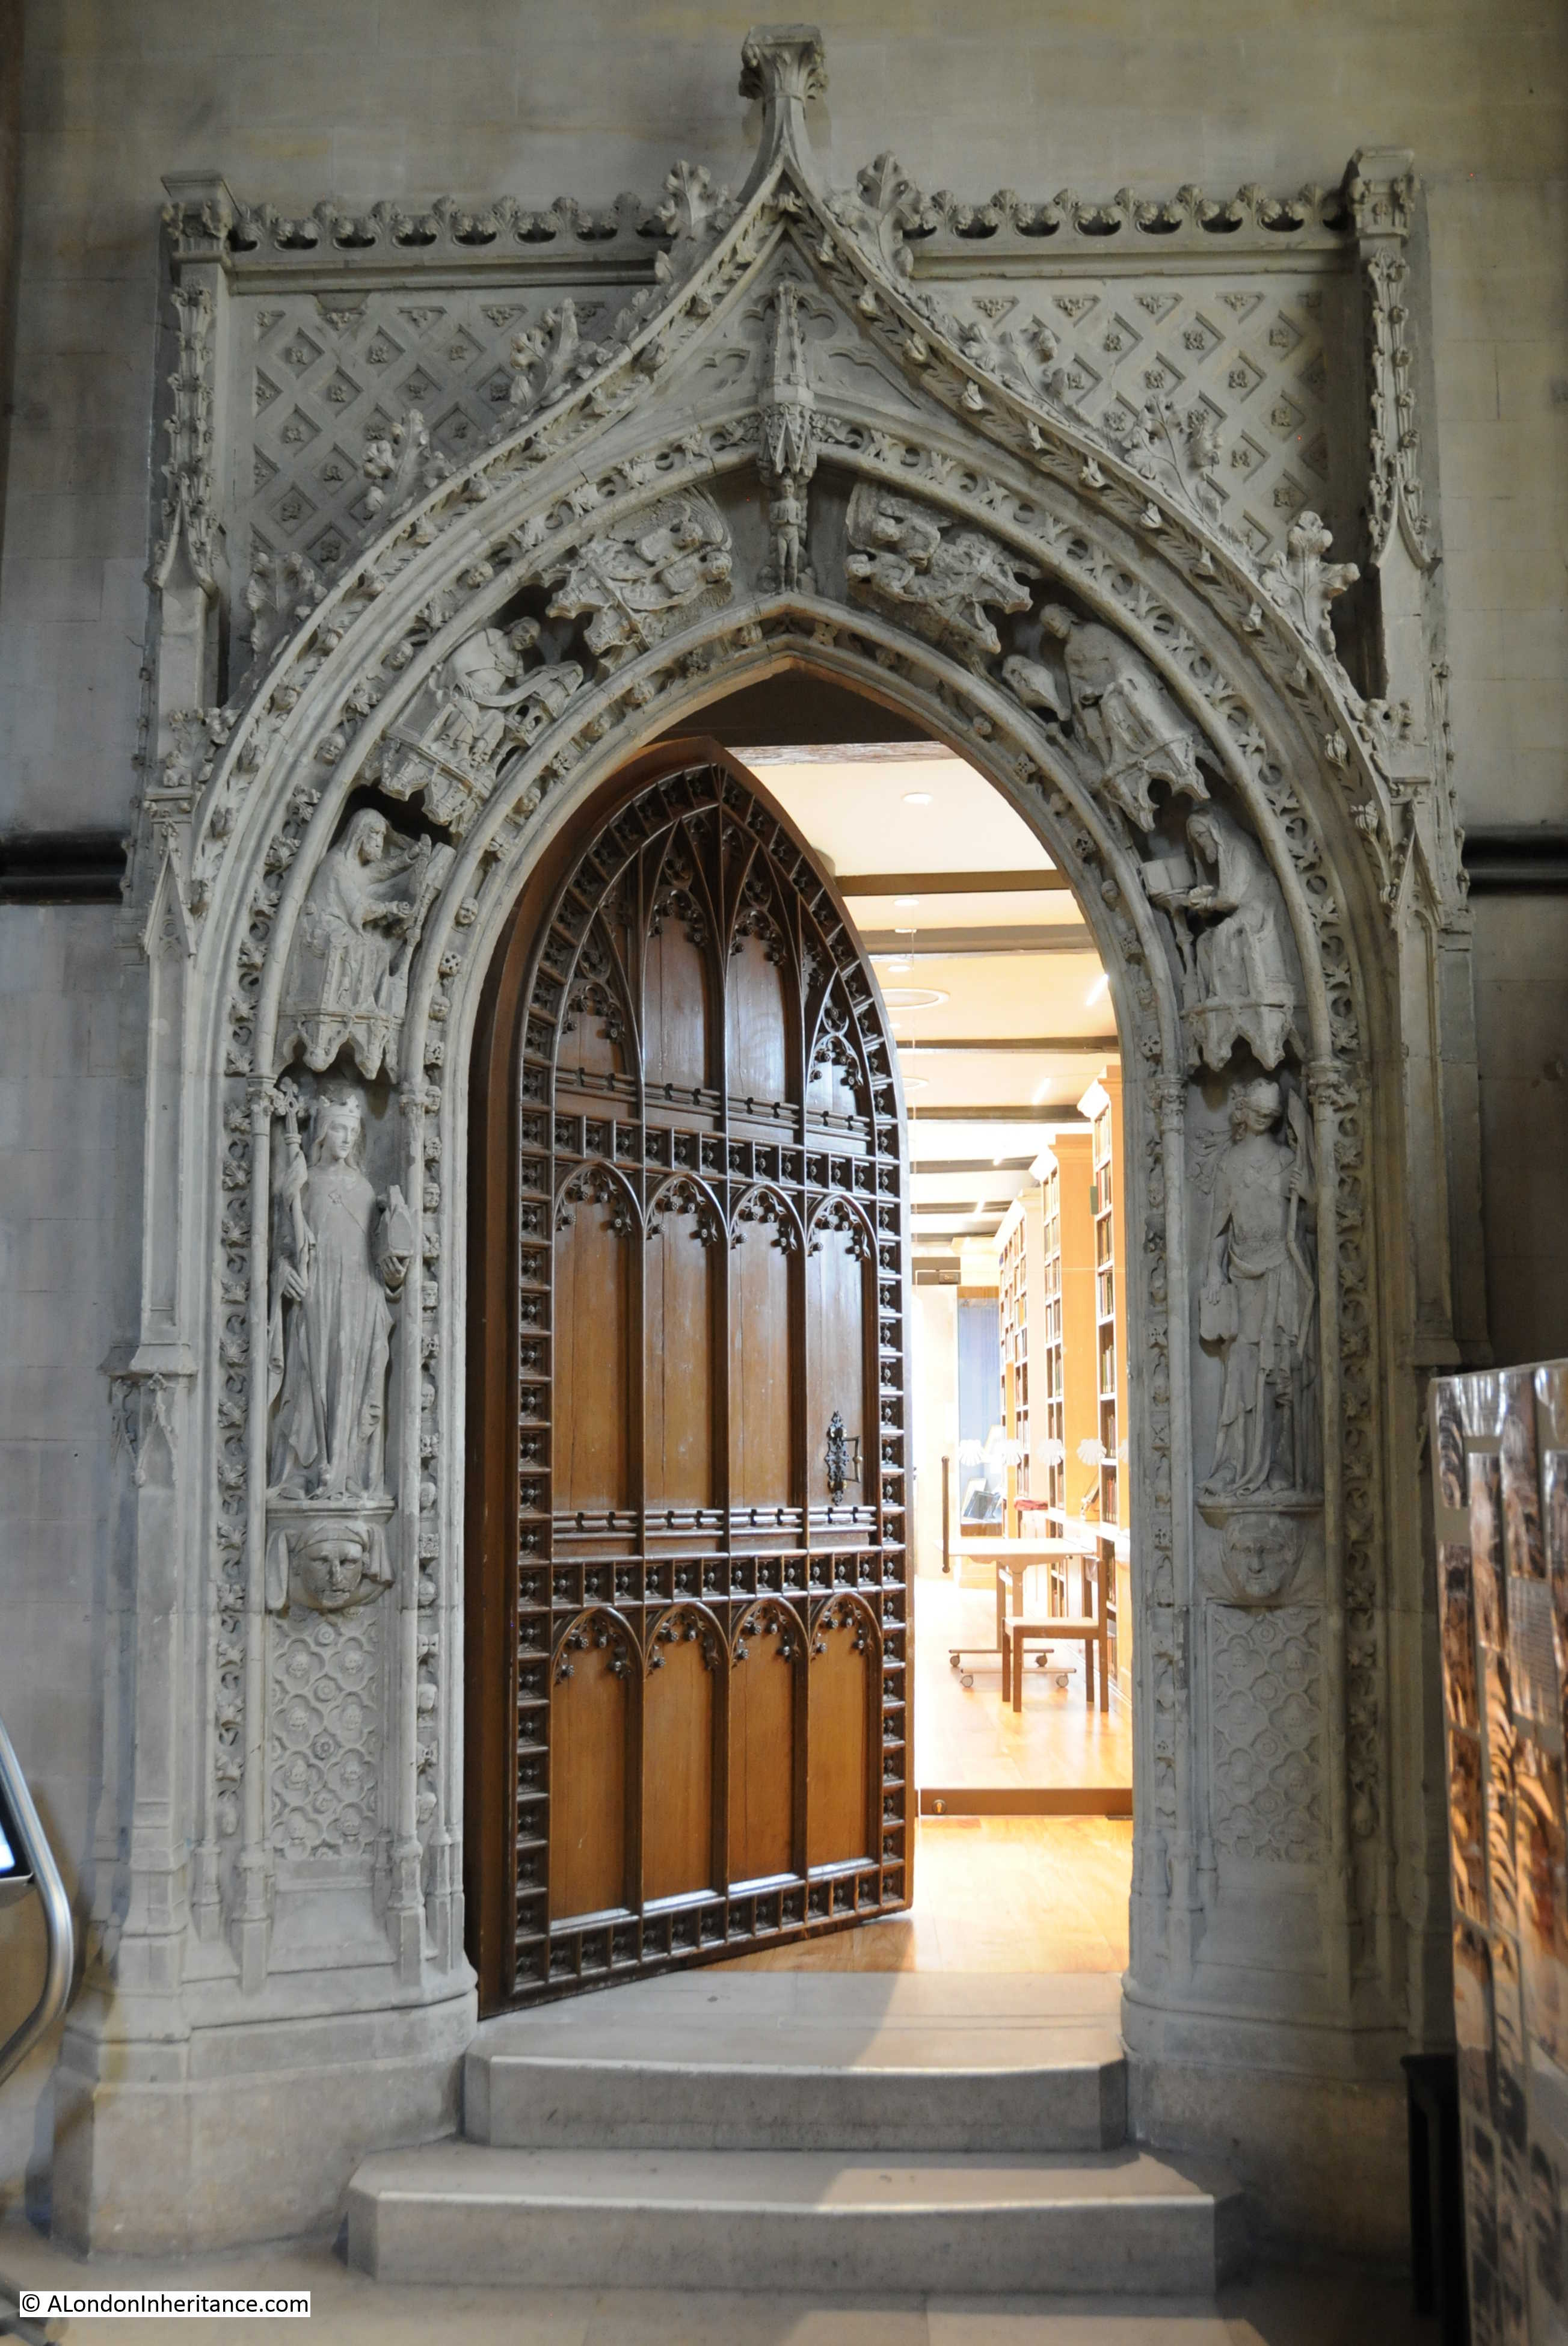
When Henry VIII dissolved the priory attached to the cathedral, the books in the library were taken into the King’s own collection, and then into the Royal Collection and the British Library, however a number of the books have since returned to the library at Rochester.
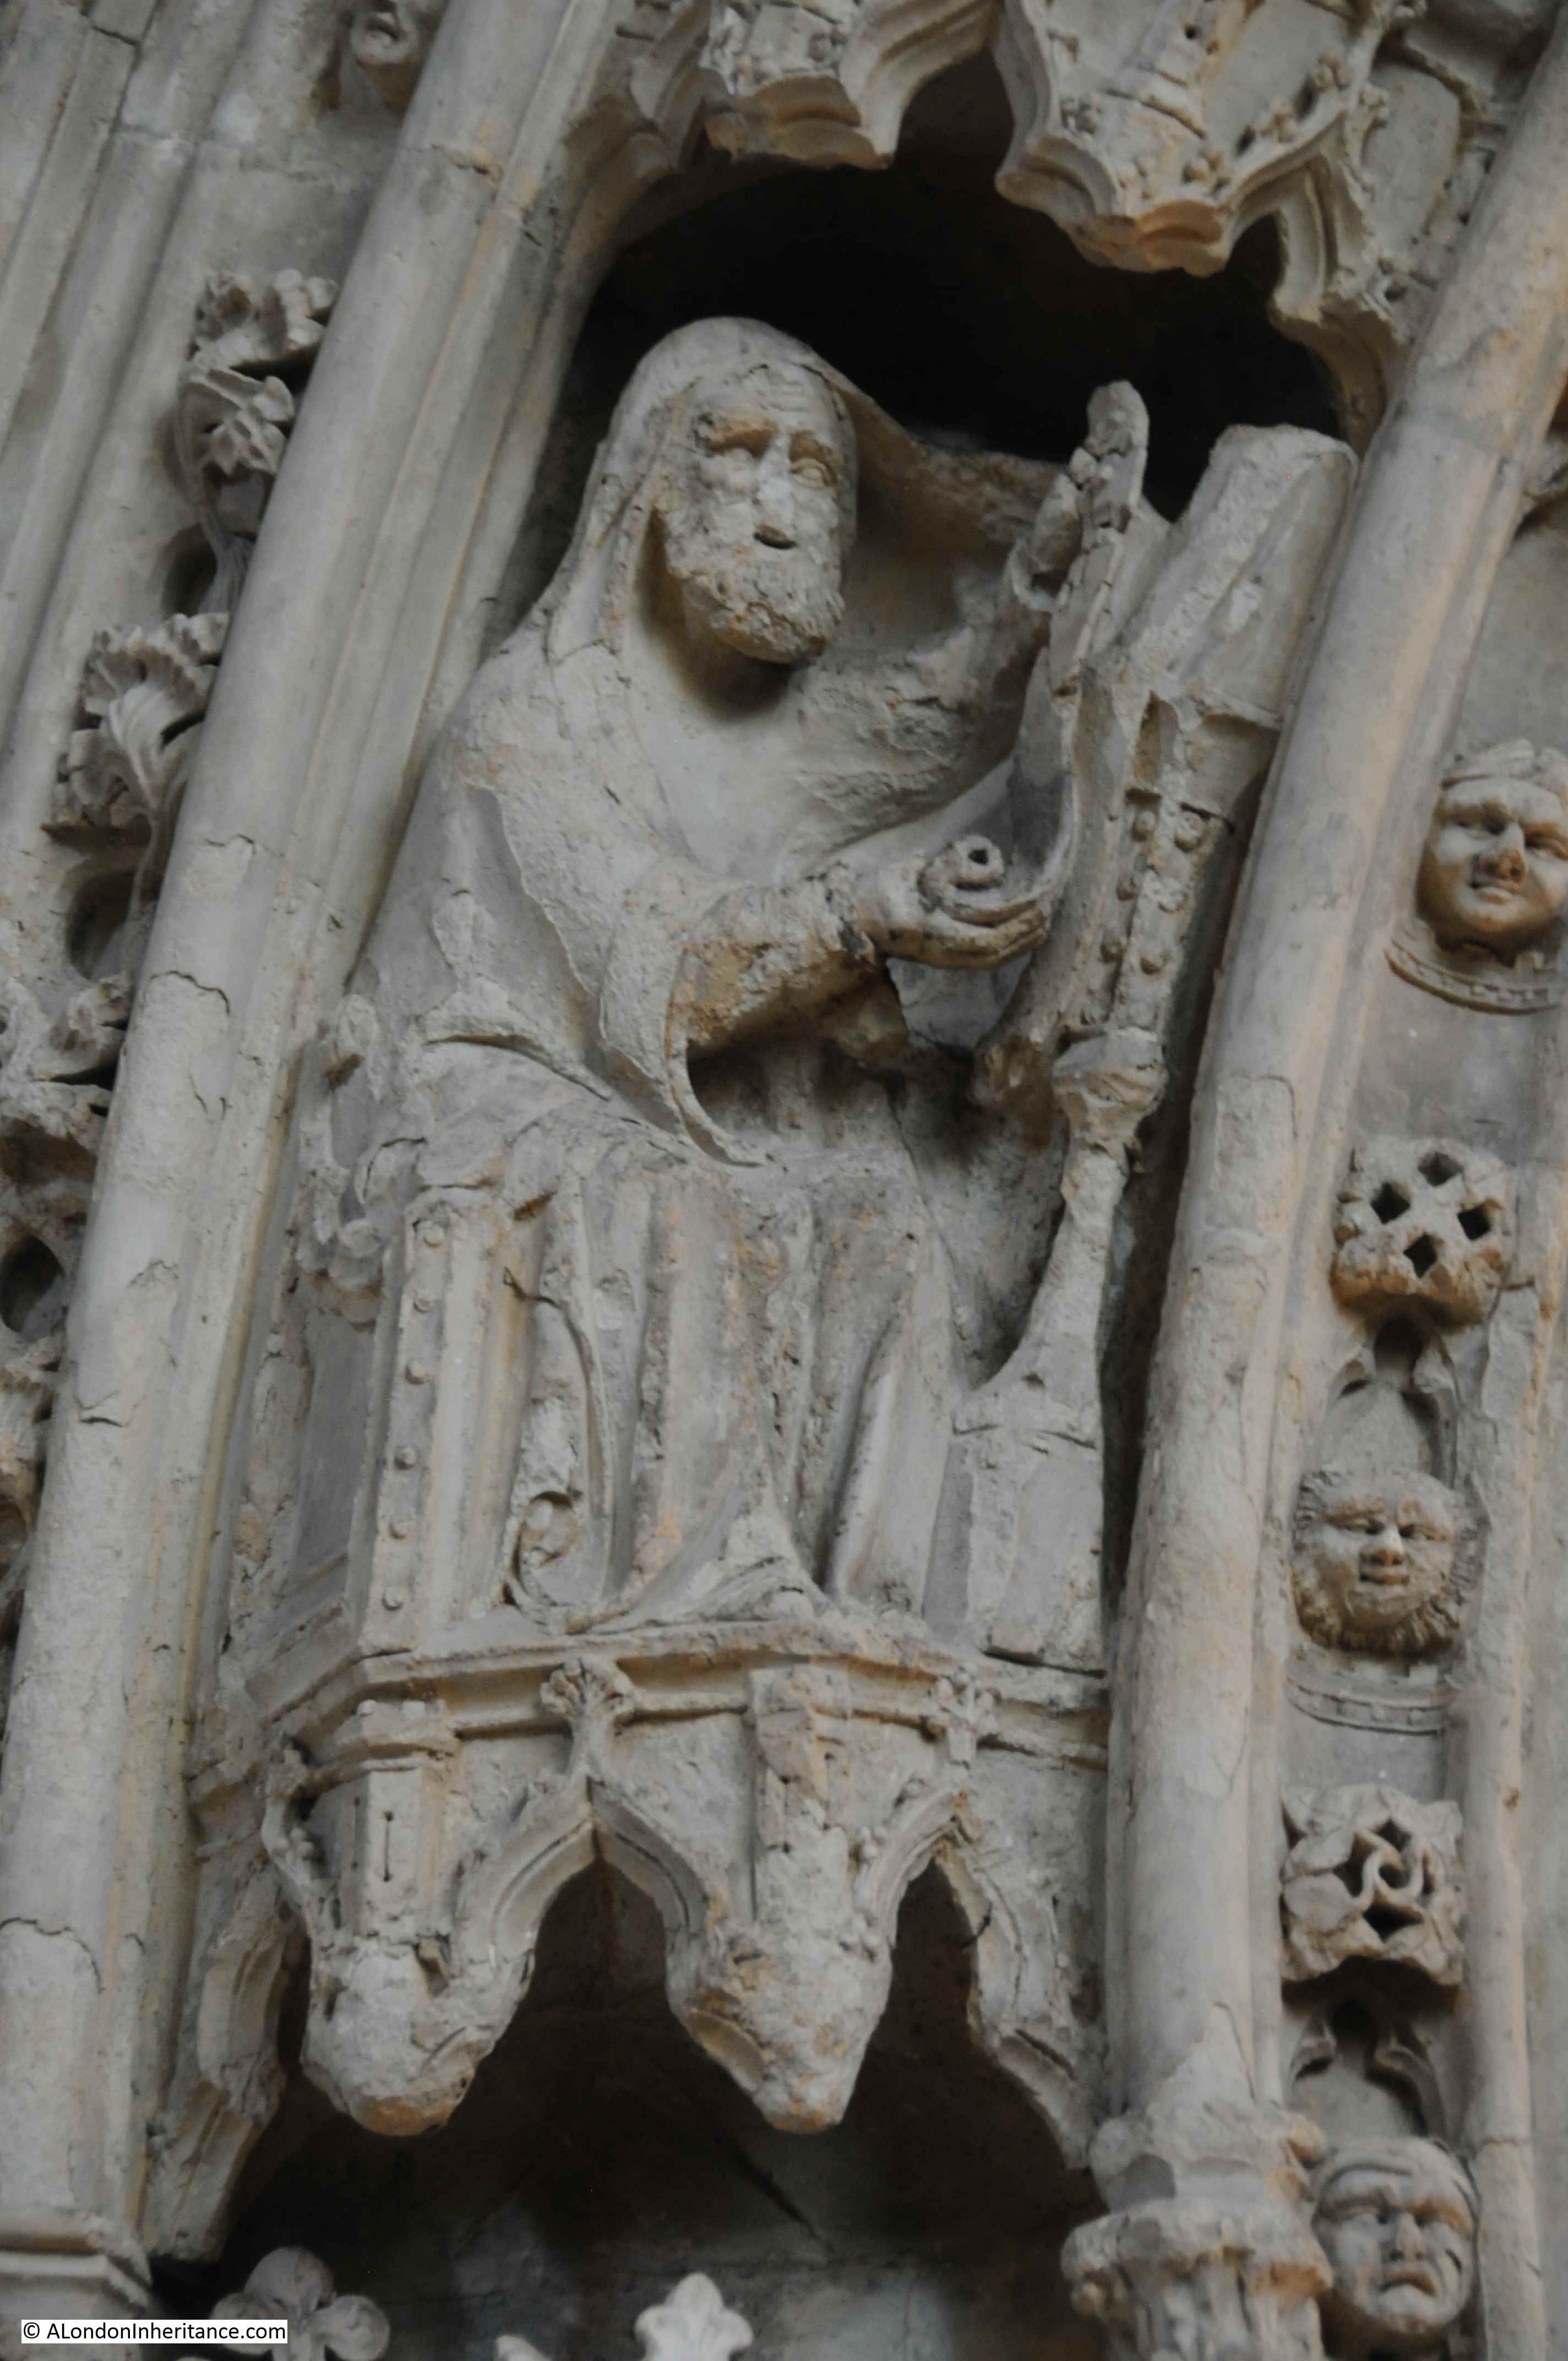
The detail of each carved figure is fascinating, and show the level of craftsmanship that went into the Cathedral in the 14th century.
Gardens to the south of the cathedral mark the original location of the priory attached to the cathedral, and the chapter house.

Original 12th and early 13th century walls surround the gardens.
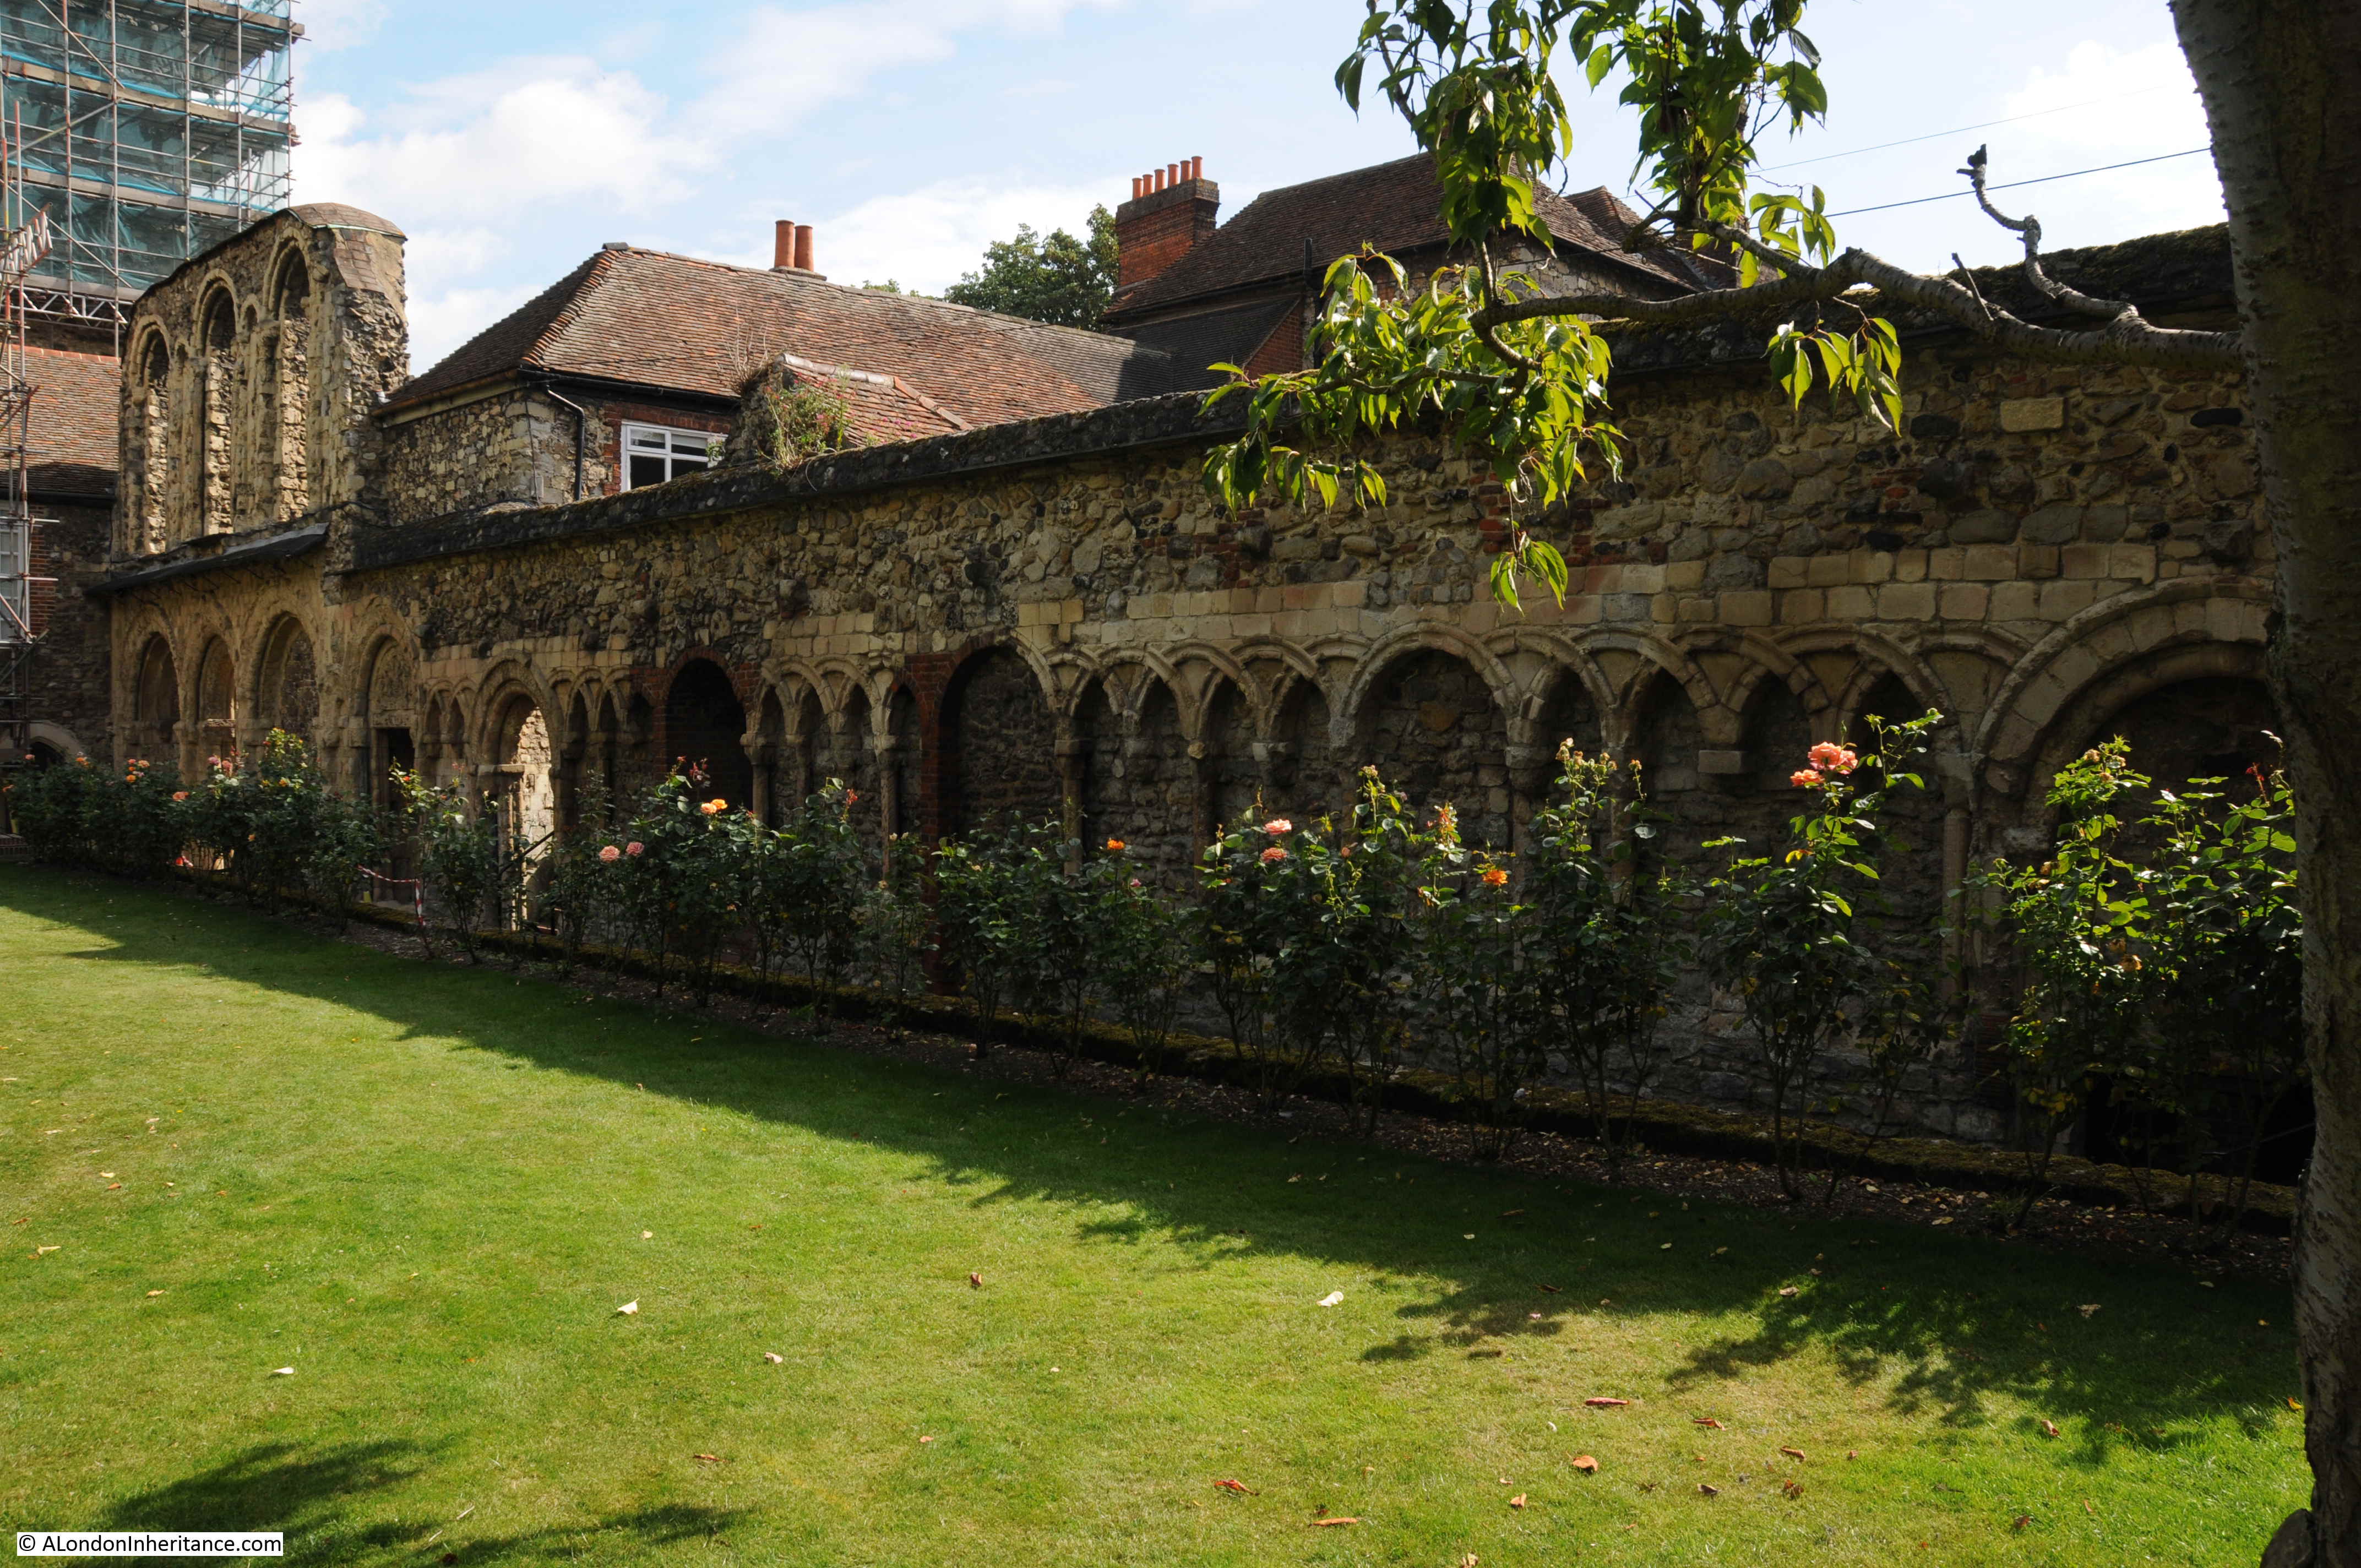
This archway originally led to the 12th century Chapter House. After the dissolution, the chapter house had briefly become part of a Royal Palace for King Henry VIII, however the roof was later removed and it fell into decay.
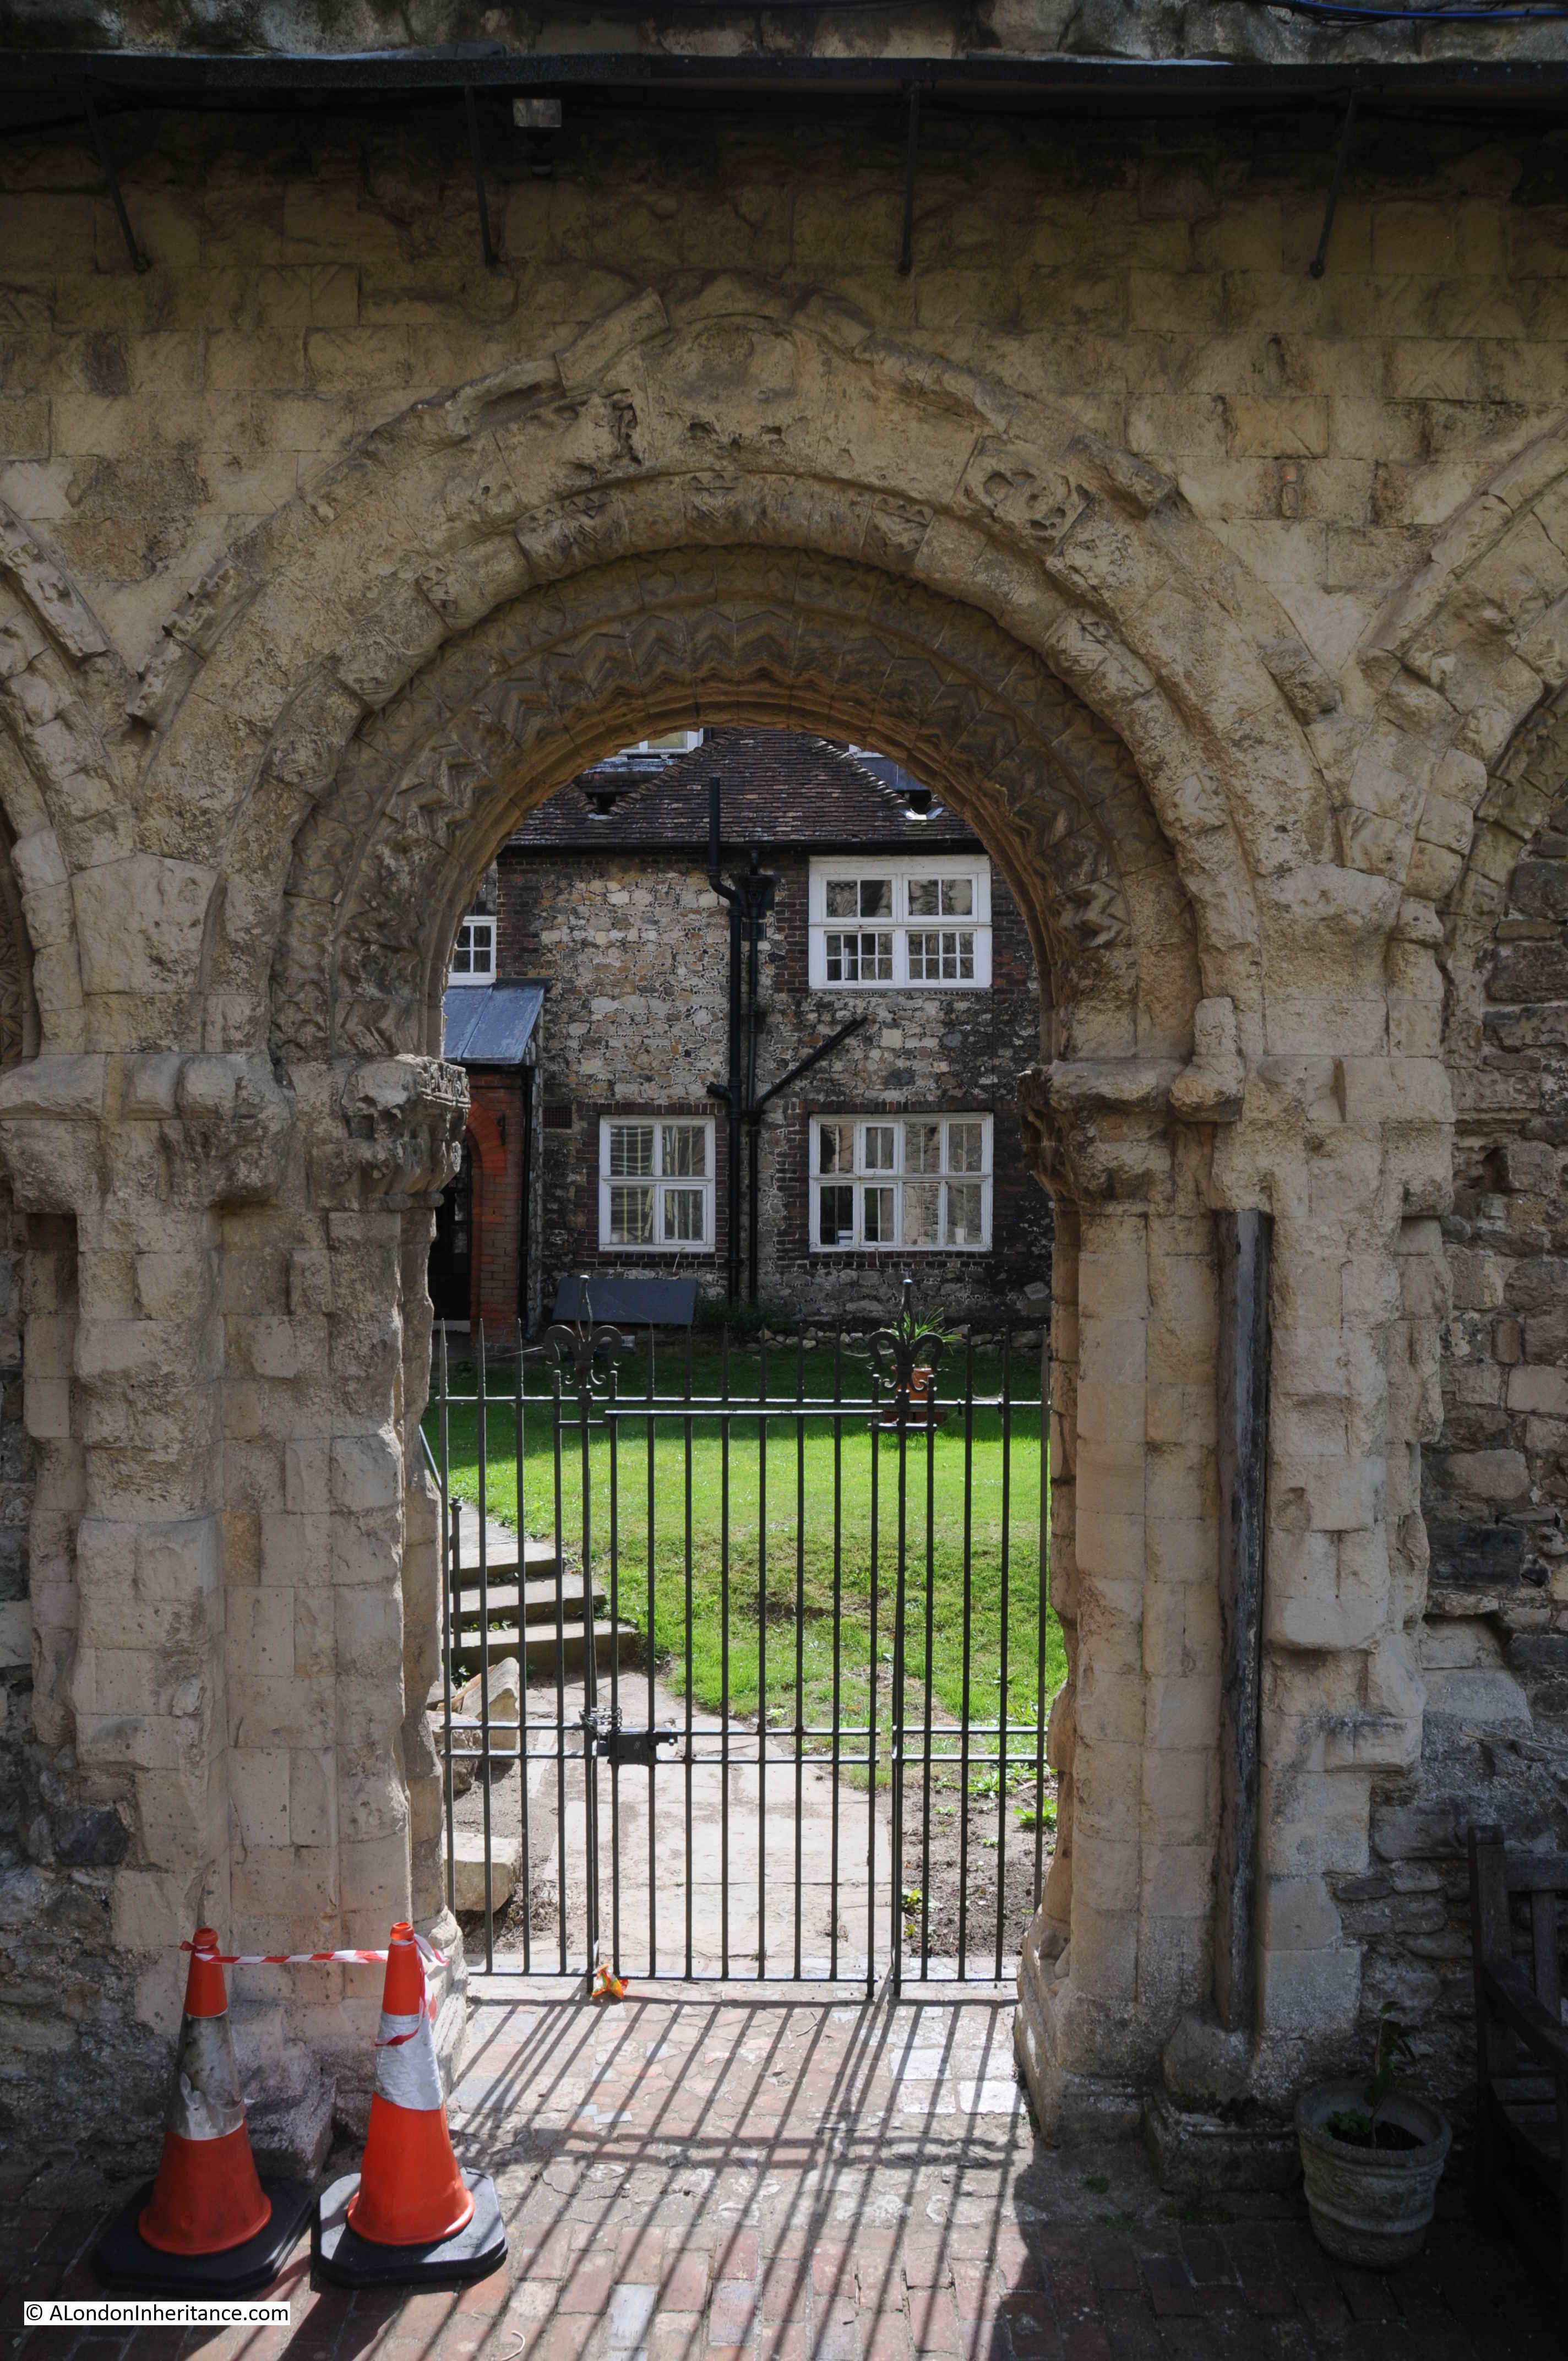
Although worn by centuries of weathering, it is still evident how ornate and carefully carved these walls, arches and doorways were from the 12th and 13th centuries.
Rochester High Street
Rochester High Street retains the look and feel of an important, provincial town. A straight, relatively narrow road runs along the centre of the High Street, leading originally from the crossing over the River Medway (there is now a wider road bypassing the centre of the town).
The High Street is lined by a variety of architectural styles from the last few centuries and the buildings support a variety of shops and businesses, fortunately, many still local.
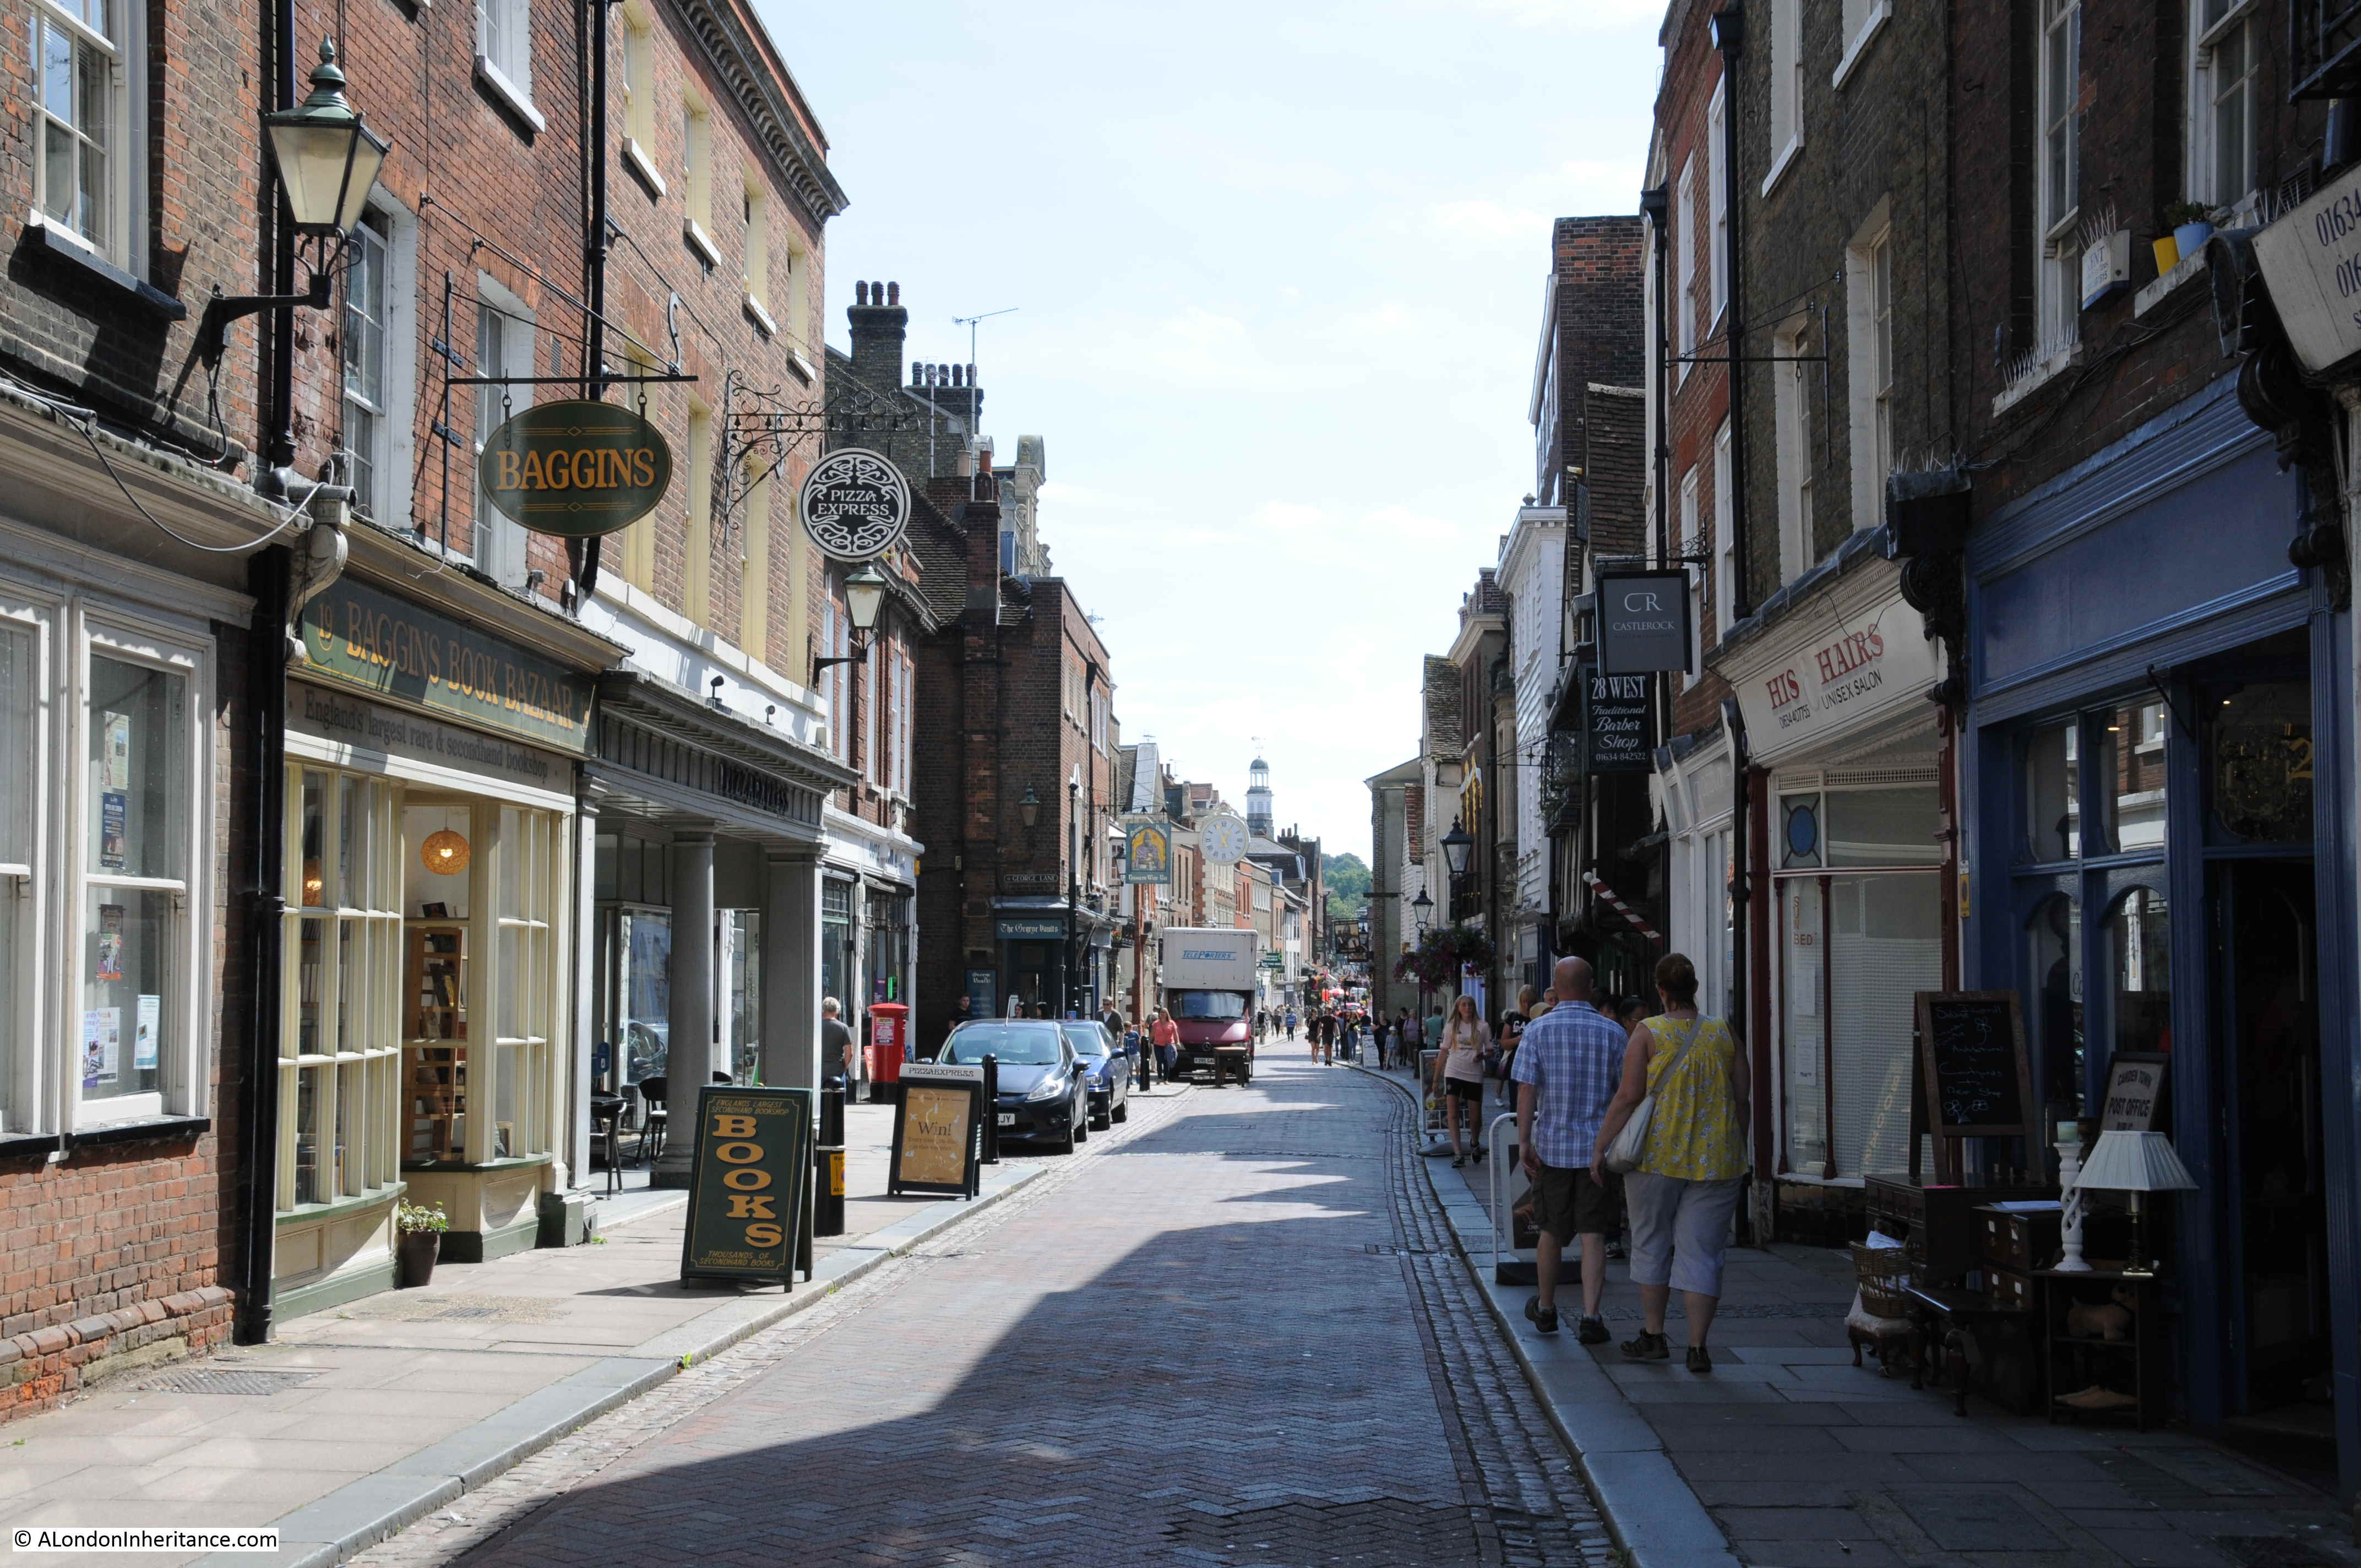
In the above photo, on the left, is the type of shop that always damages my credit card. Baggins Book Bazaar is one of the most remarkable second-hand bookshops I have been in for a long time. A standard shop front, but once inside, the bookshop extends a long way back and offers multiple levels stacked high with books – I came out with several.
The building in the following photo was erected in 1706 “at the sole charge and expense of Sir Cloudsley Shovel” who represented Rochester as MP during three Parliaments in the reign of King William III and one Parliament during the reign of Queen Anne.

The following rather plain looking building has an interesting history.
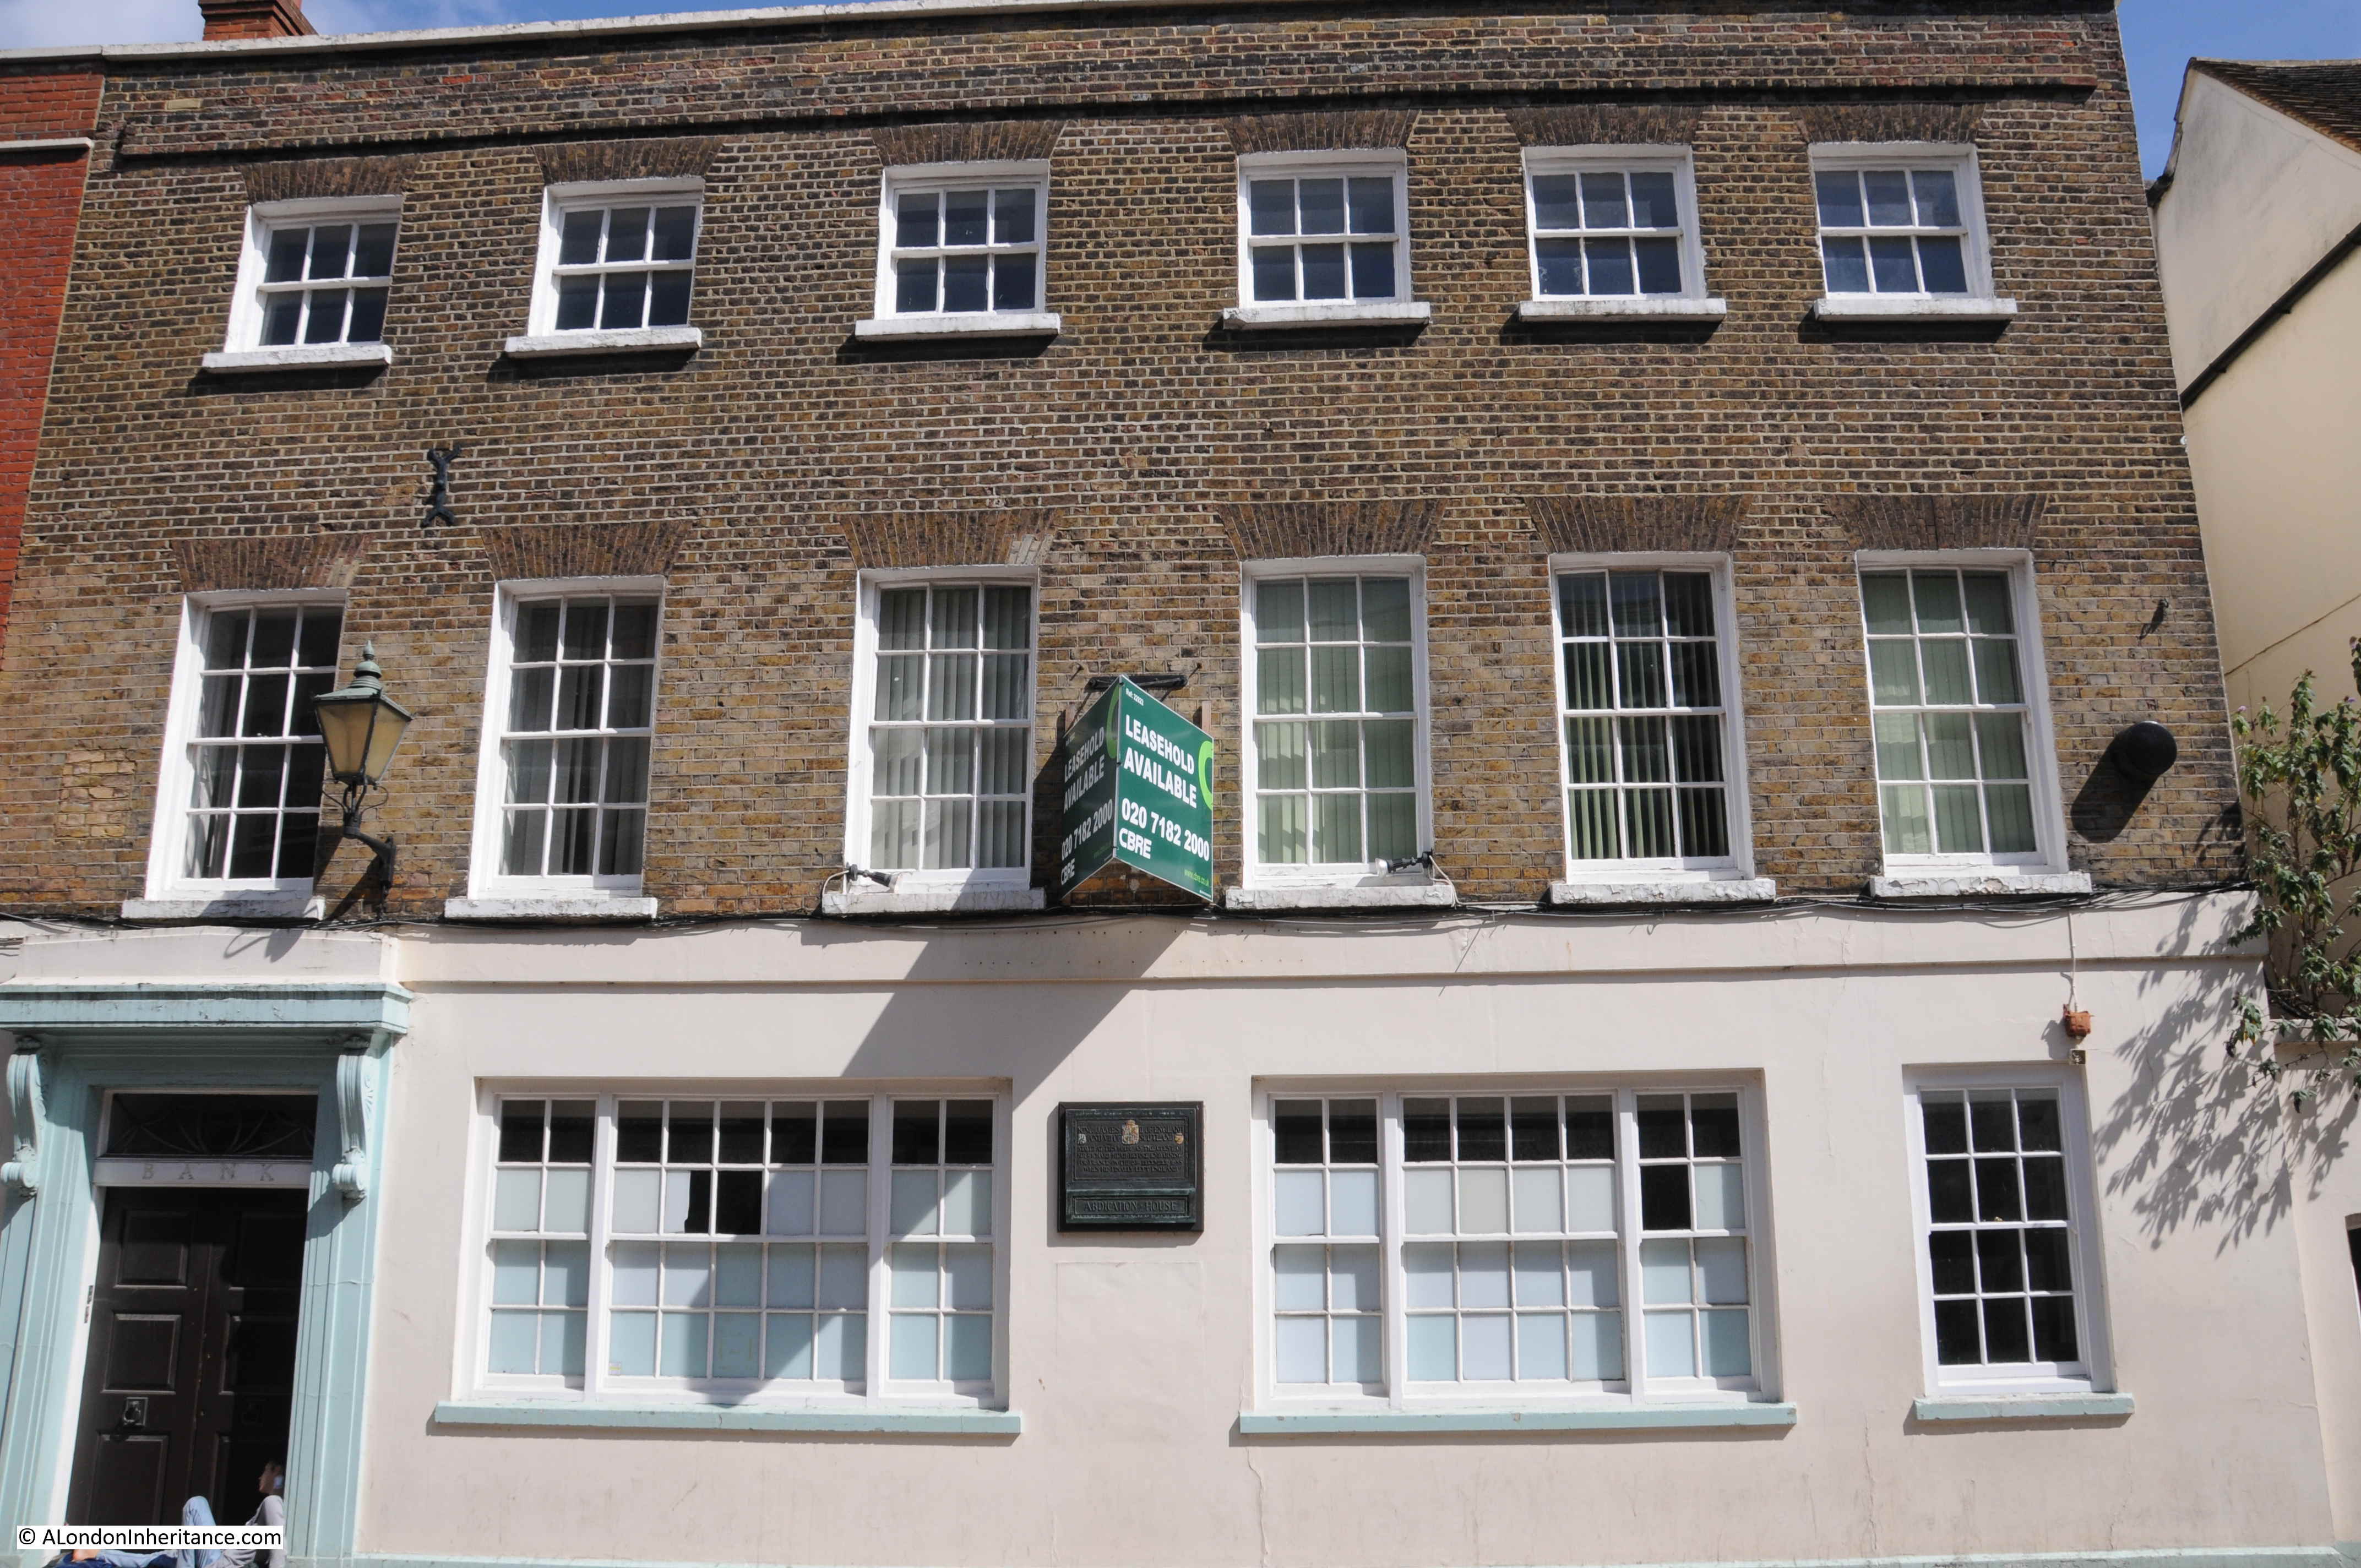
The building has the name Abdication House and the plaque on the front provides the background as “King James II of England stayed at the house as a guest of Sir Richard Head before embarking for France on the 23rd December 1688 when he finally left England”.
The following building is the site of the French Hospital Almshouses.
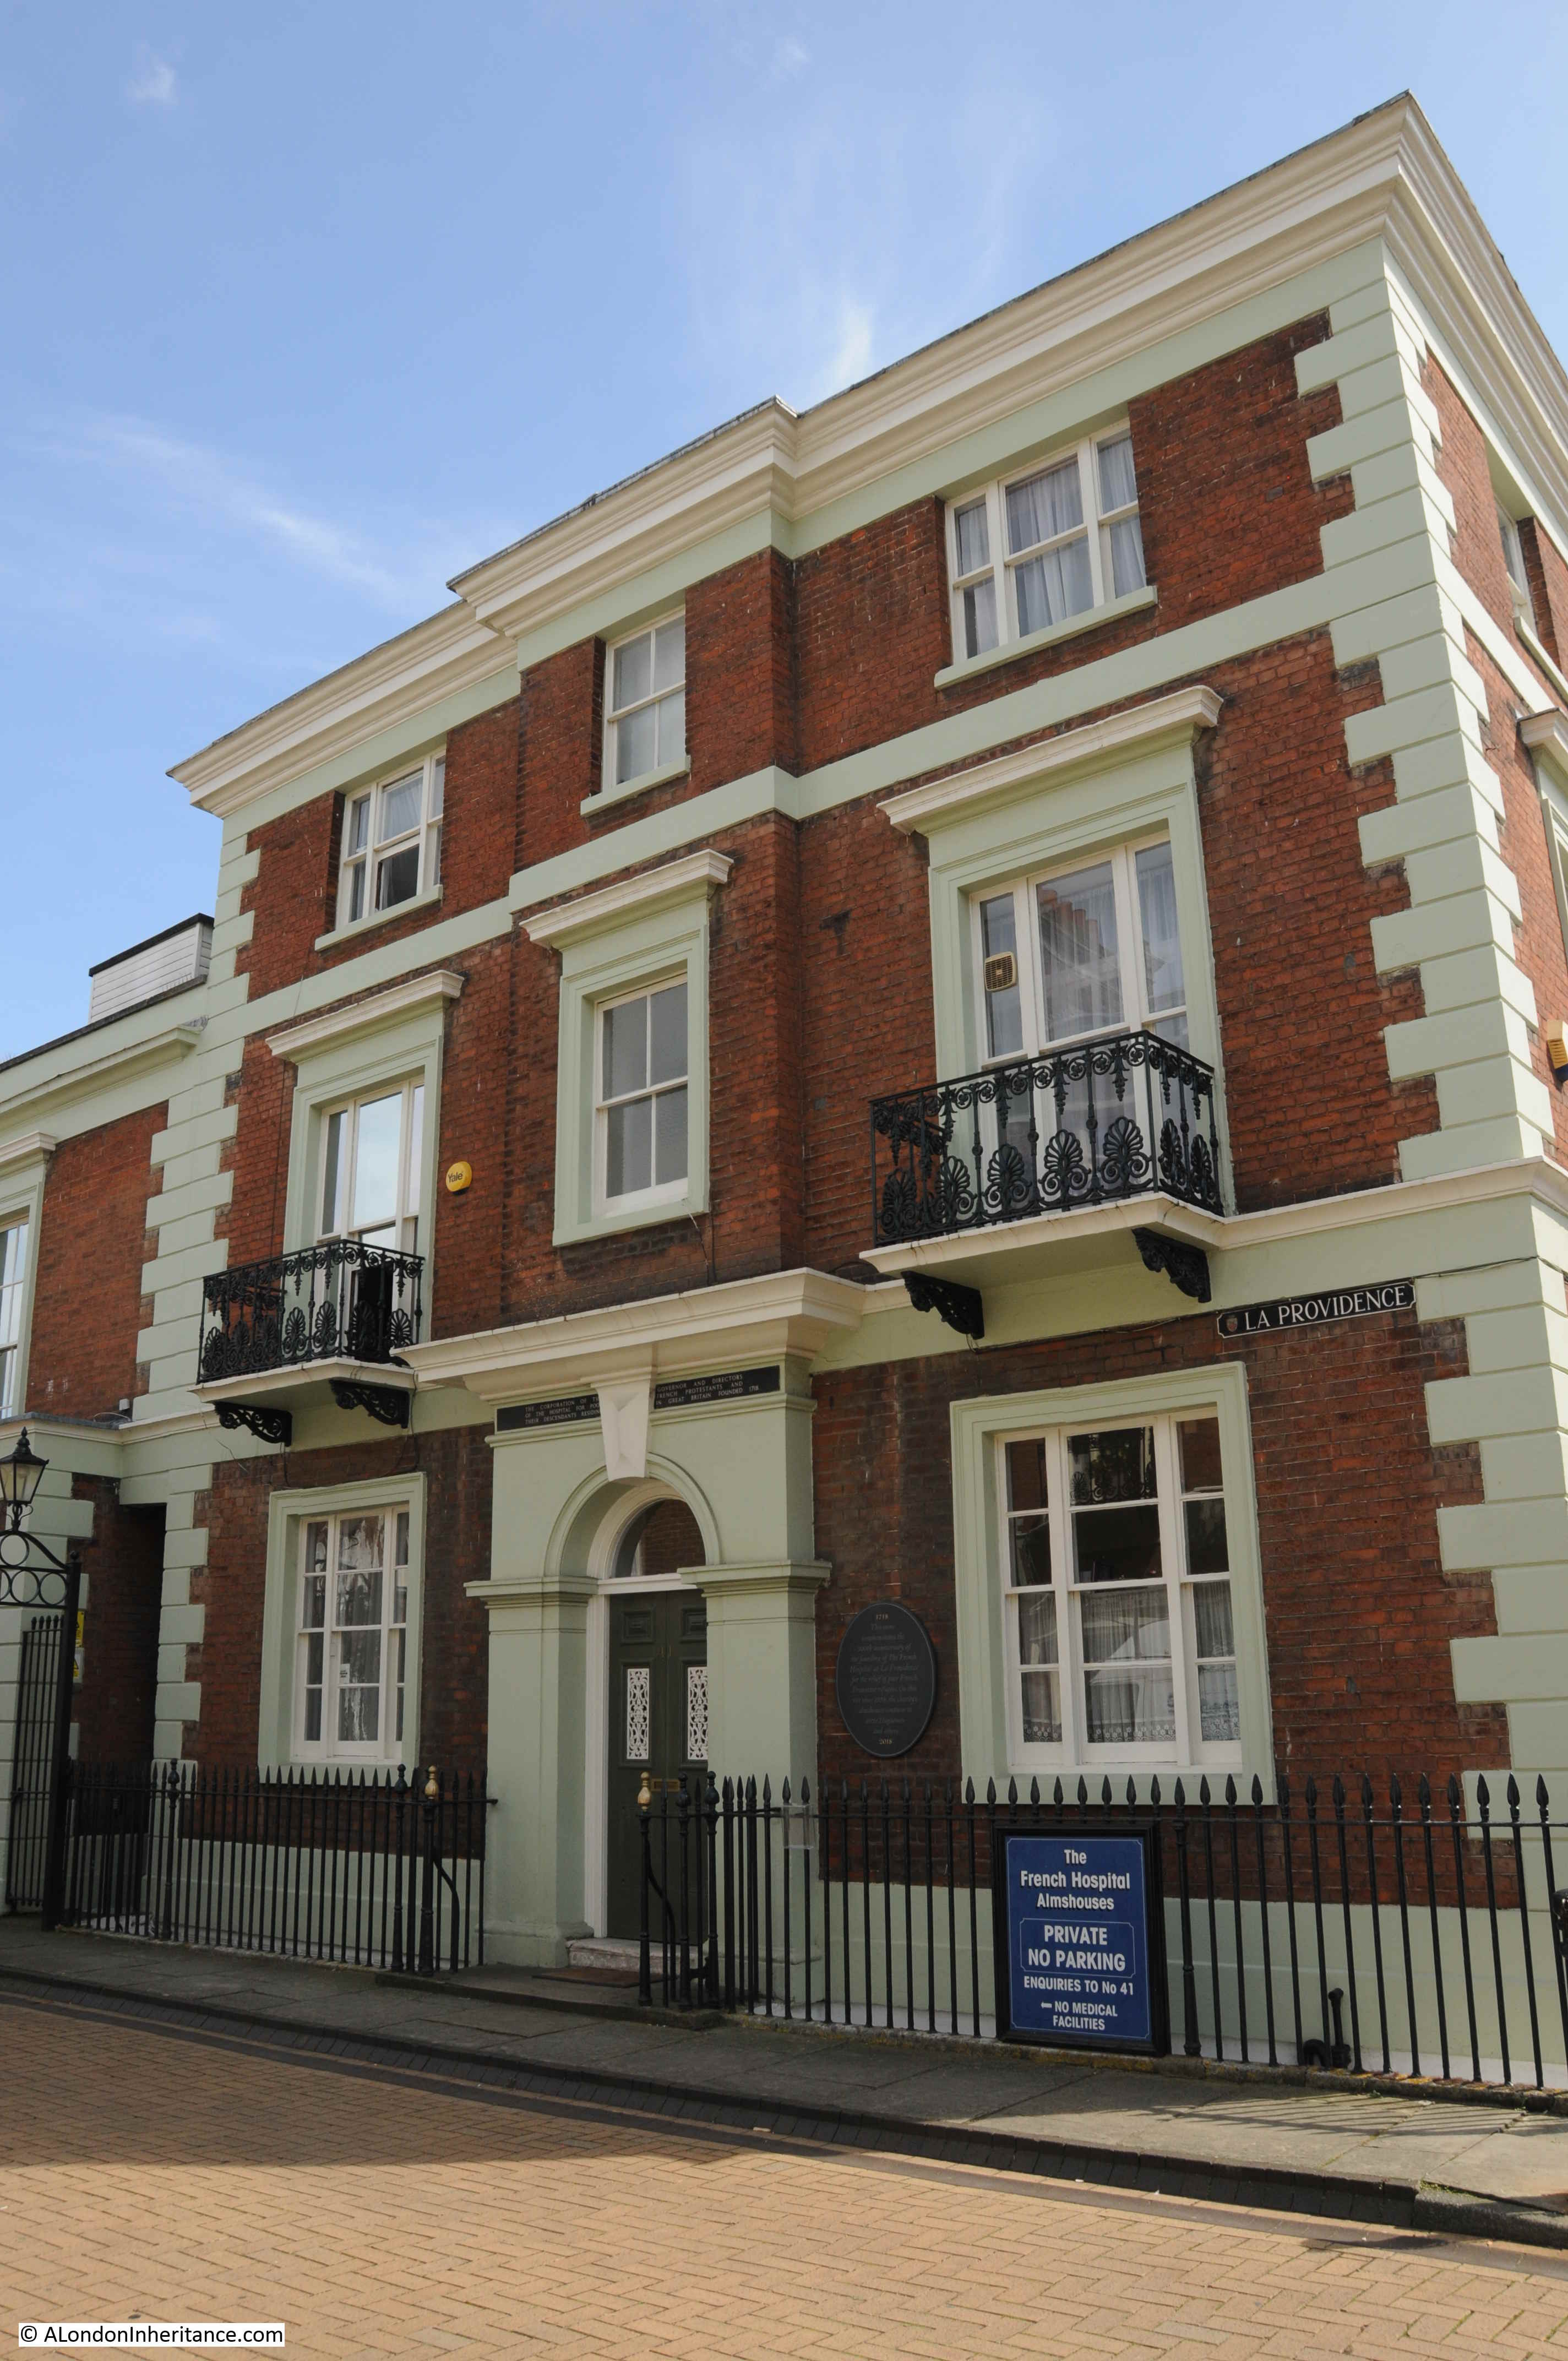
The Almshouses were founded in 1718 for “poor French protestants and their descendants residing in Great Britain”.
This was a quick run through Rochester High Street – there are many more buildings that tell the history of the area and the importance of Rochester as a town. The above examples – King James II before leaving for France, and the almshouses for protestant refugees arriving from France highlight Rochester’s’ role as a gateway town, where people would leave and enter the country, with one of the main roads to London running through the town providing easy access to the capital, alongside the River Medway.
There was one final place that I wanted to visit whilst in this part of Kent.
St James Church, Cooling
North of Rochester on the Hoo Peninsula is the village of Cooling and it was St. James Church that was my intended destination.
Cooling church was the inspiration for the setting of the encounter between Pip and Magwitch in the opening of Charles Dickens book Great Expectations. In the book Dickens describes the area:
“Ours was the marsh country, down by the river, within, as the river wound, twenty miles of the sea.”
The river is still visible from the churchyard, flat fields and marshes provide an unobstructed view, although the traffic and business on the river is now very different to anything that Dickens could have seen, or expected.
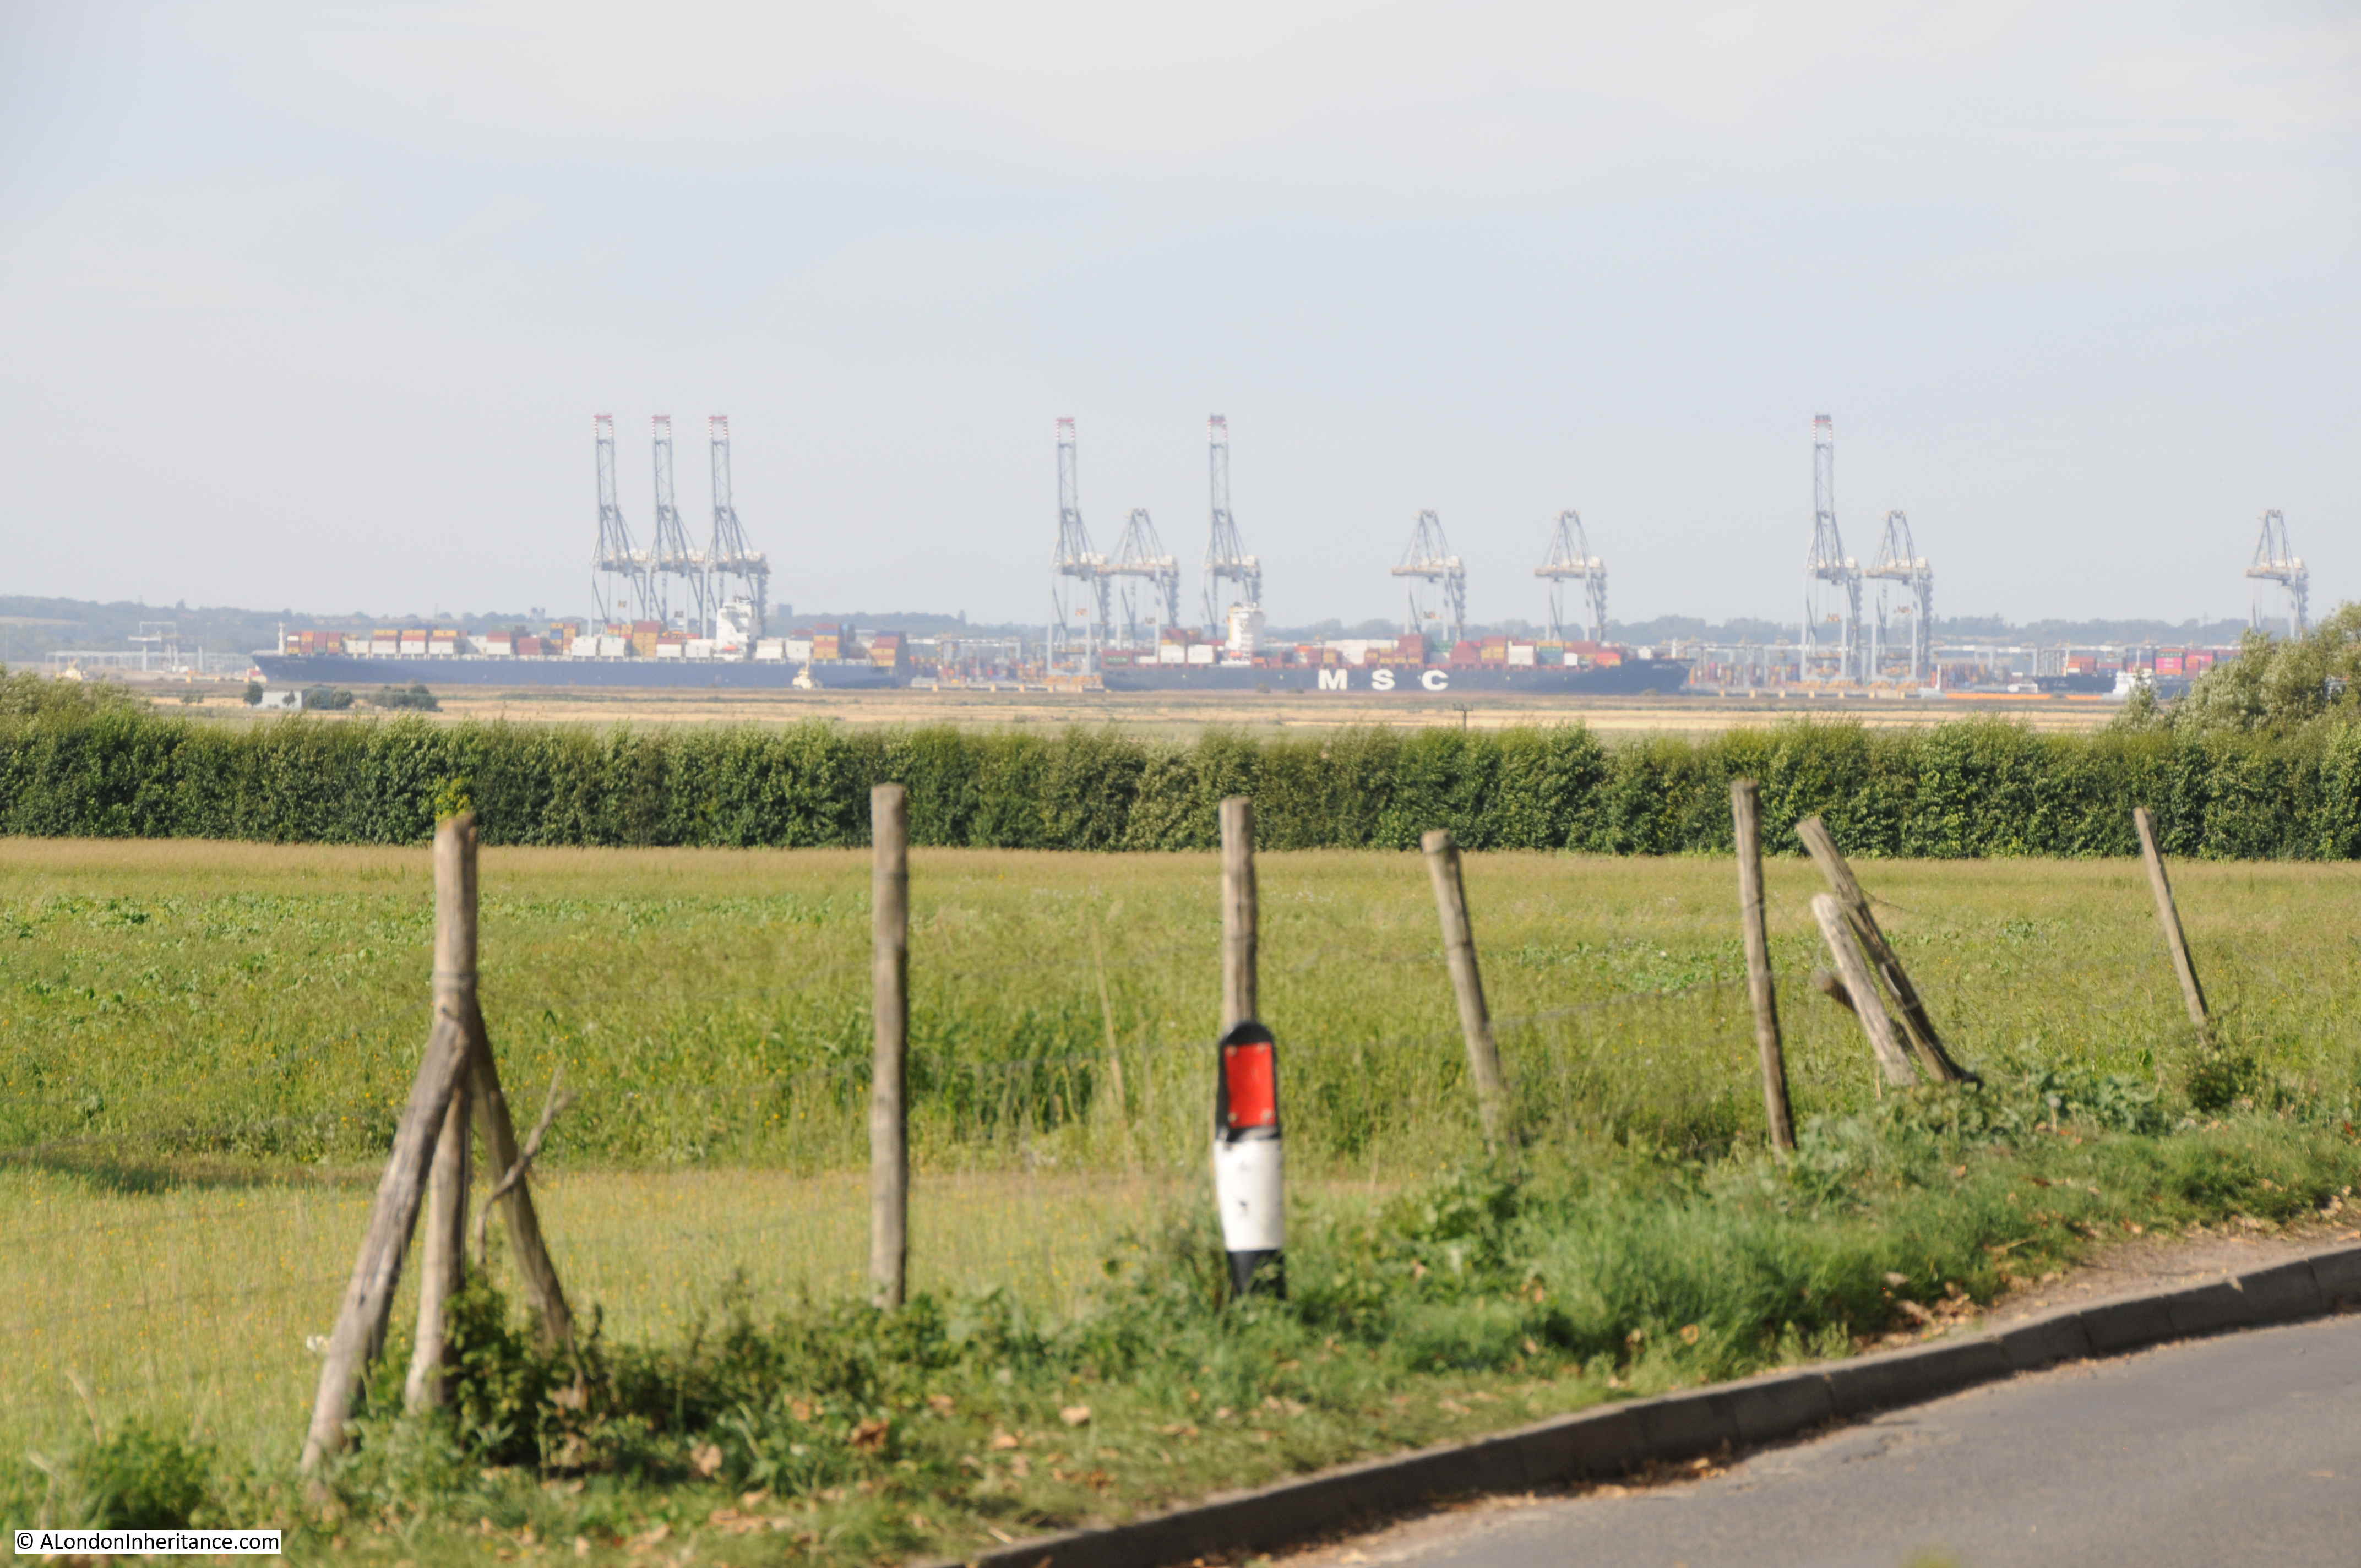
The large container ships docked at the new London Gateway port are clearly visible to the north. A very different form of transport to Dickens’ time, but the river is still a major artery for seaborne trade in and out of the country.
My visit was during a warm and sunny day, very different to the “bleak place overgrown with nettles” on a “raw afternoon towards evening” as described in Great Expectations. It must be a very different place on a late winter’s afternoon, with rain and wind blowing in from the east, along the Thames estuary and across the Hoo Peninsula.
Among the graves surrounding the church are a tragic collection of small graves that were well-known to Dickens.
These are the graves of babies and children from the Baker and Comport families who died between 1771 and 1779. Three of the children died around the age of one month. The graves are a very visible demonstration of the dreadful infant mortality rates that must have inflicted terrible anguish on parents in the centuries before the standards of health we perhaps take for granted today.
They are lined up in what Dickens described as ” little stone lozenges each about a foot and a half long, which were arranged in a neat row beside their (parents) graves”.

Ten smaller graves are on one side of the headstone and three larger graves are on the other side.

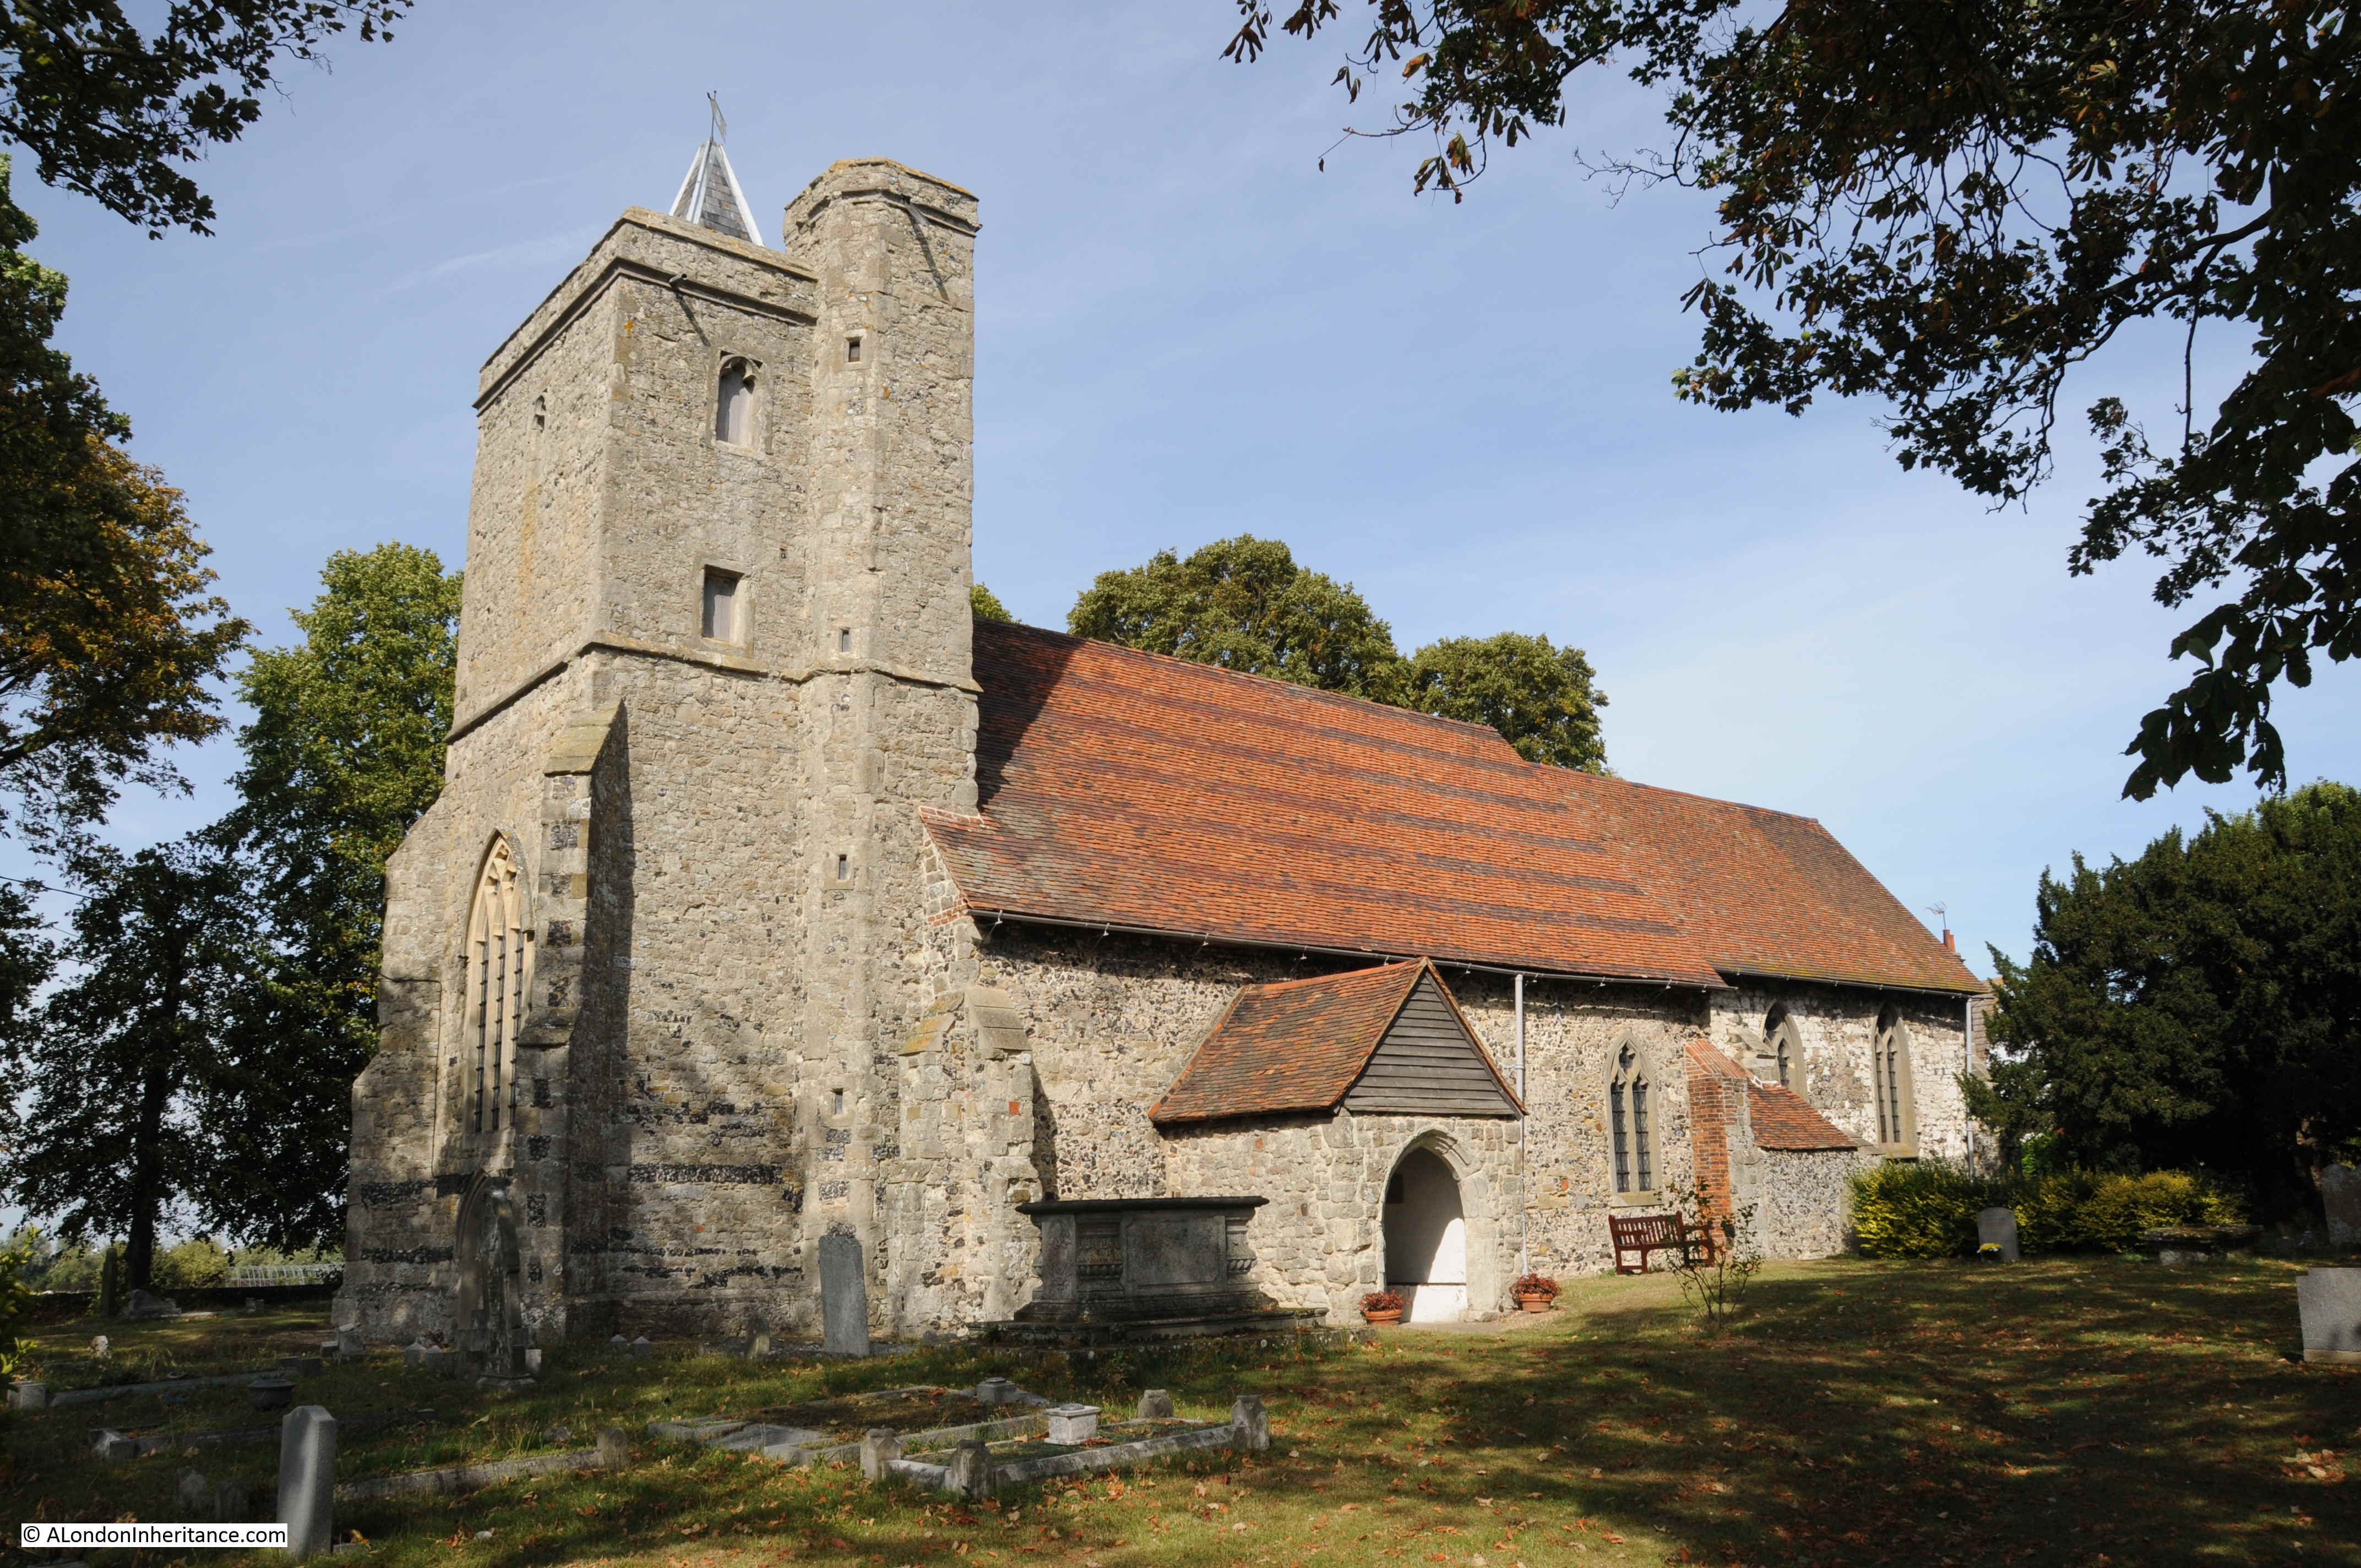
The church of St. James’ Cooling dates from the 13th century. It is no longer an active church, and is in the care of the Churches Conservation Trust
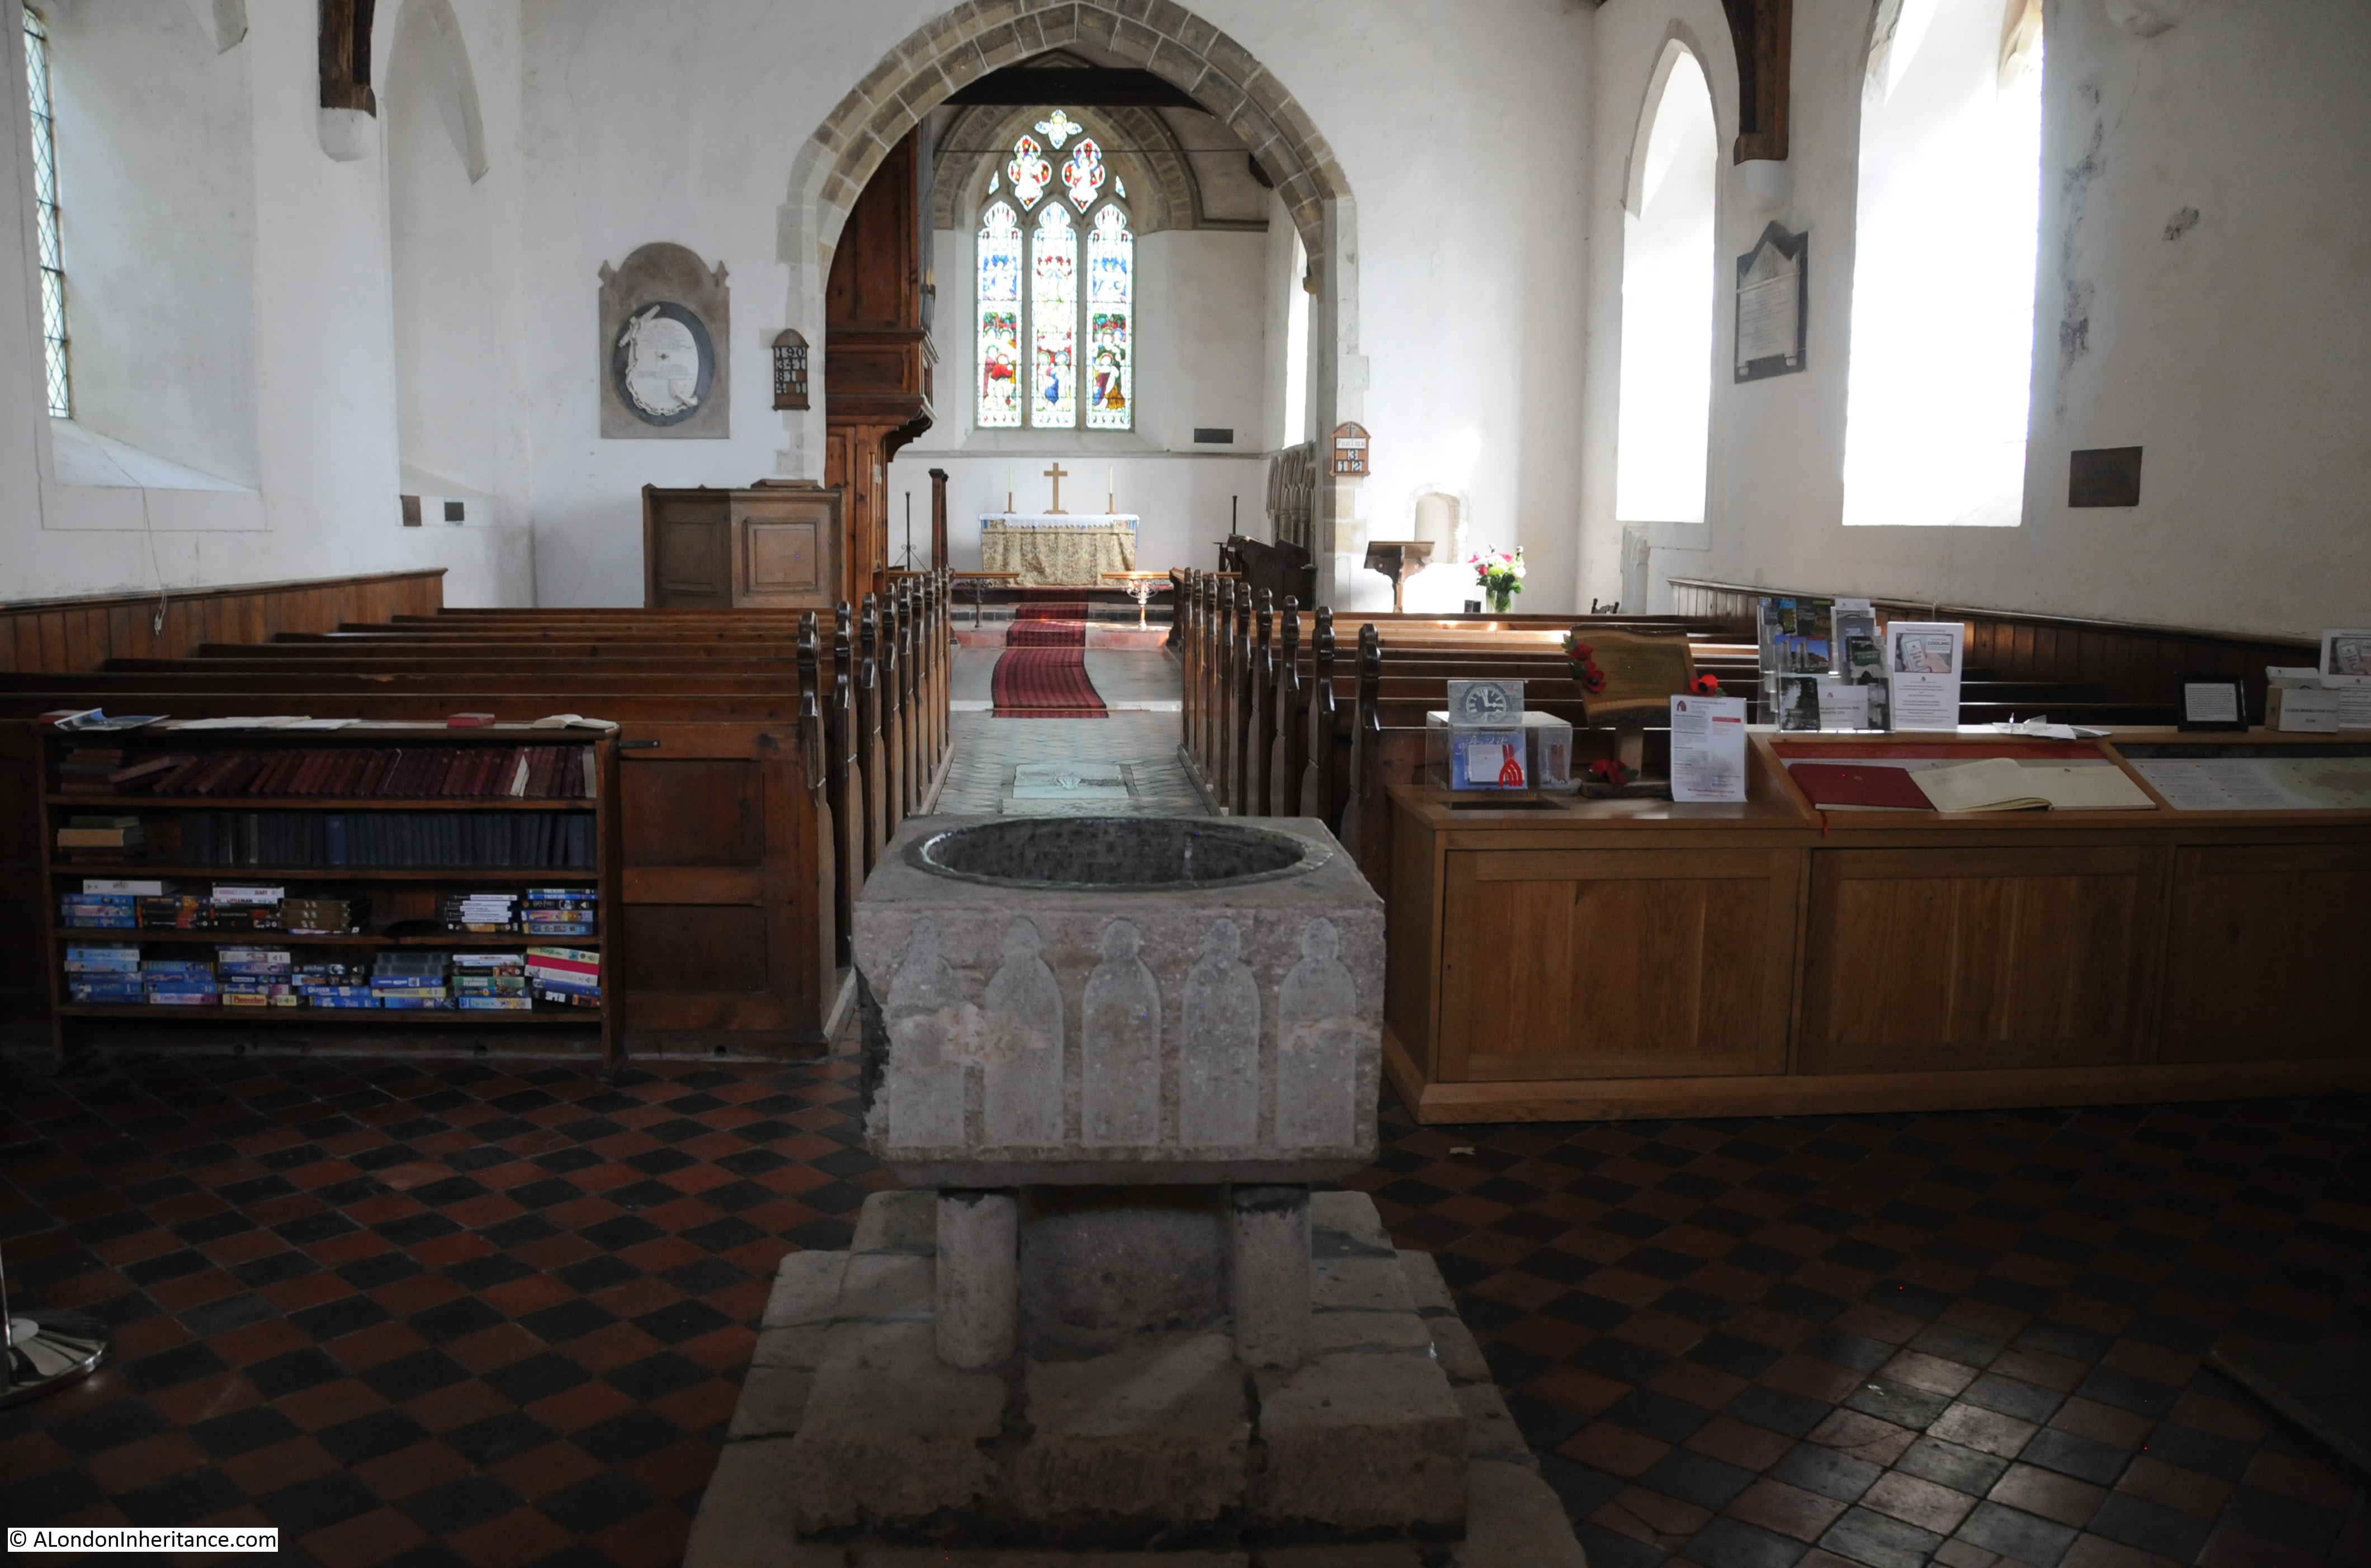
The interior of the church is open and the white walls provide an impression of light and space. The following photo is looking along the nave, with the 13th century font in the foreground.
The pulpit dates from the 18th century, and in common with nearly all churches, there was 19th century restoration work, the majority of the church dates from between the 13th and 15th centuries.
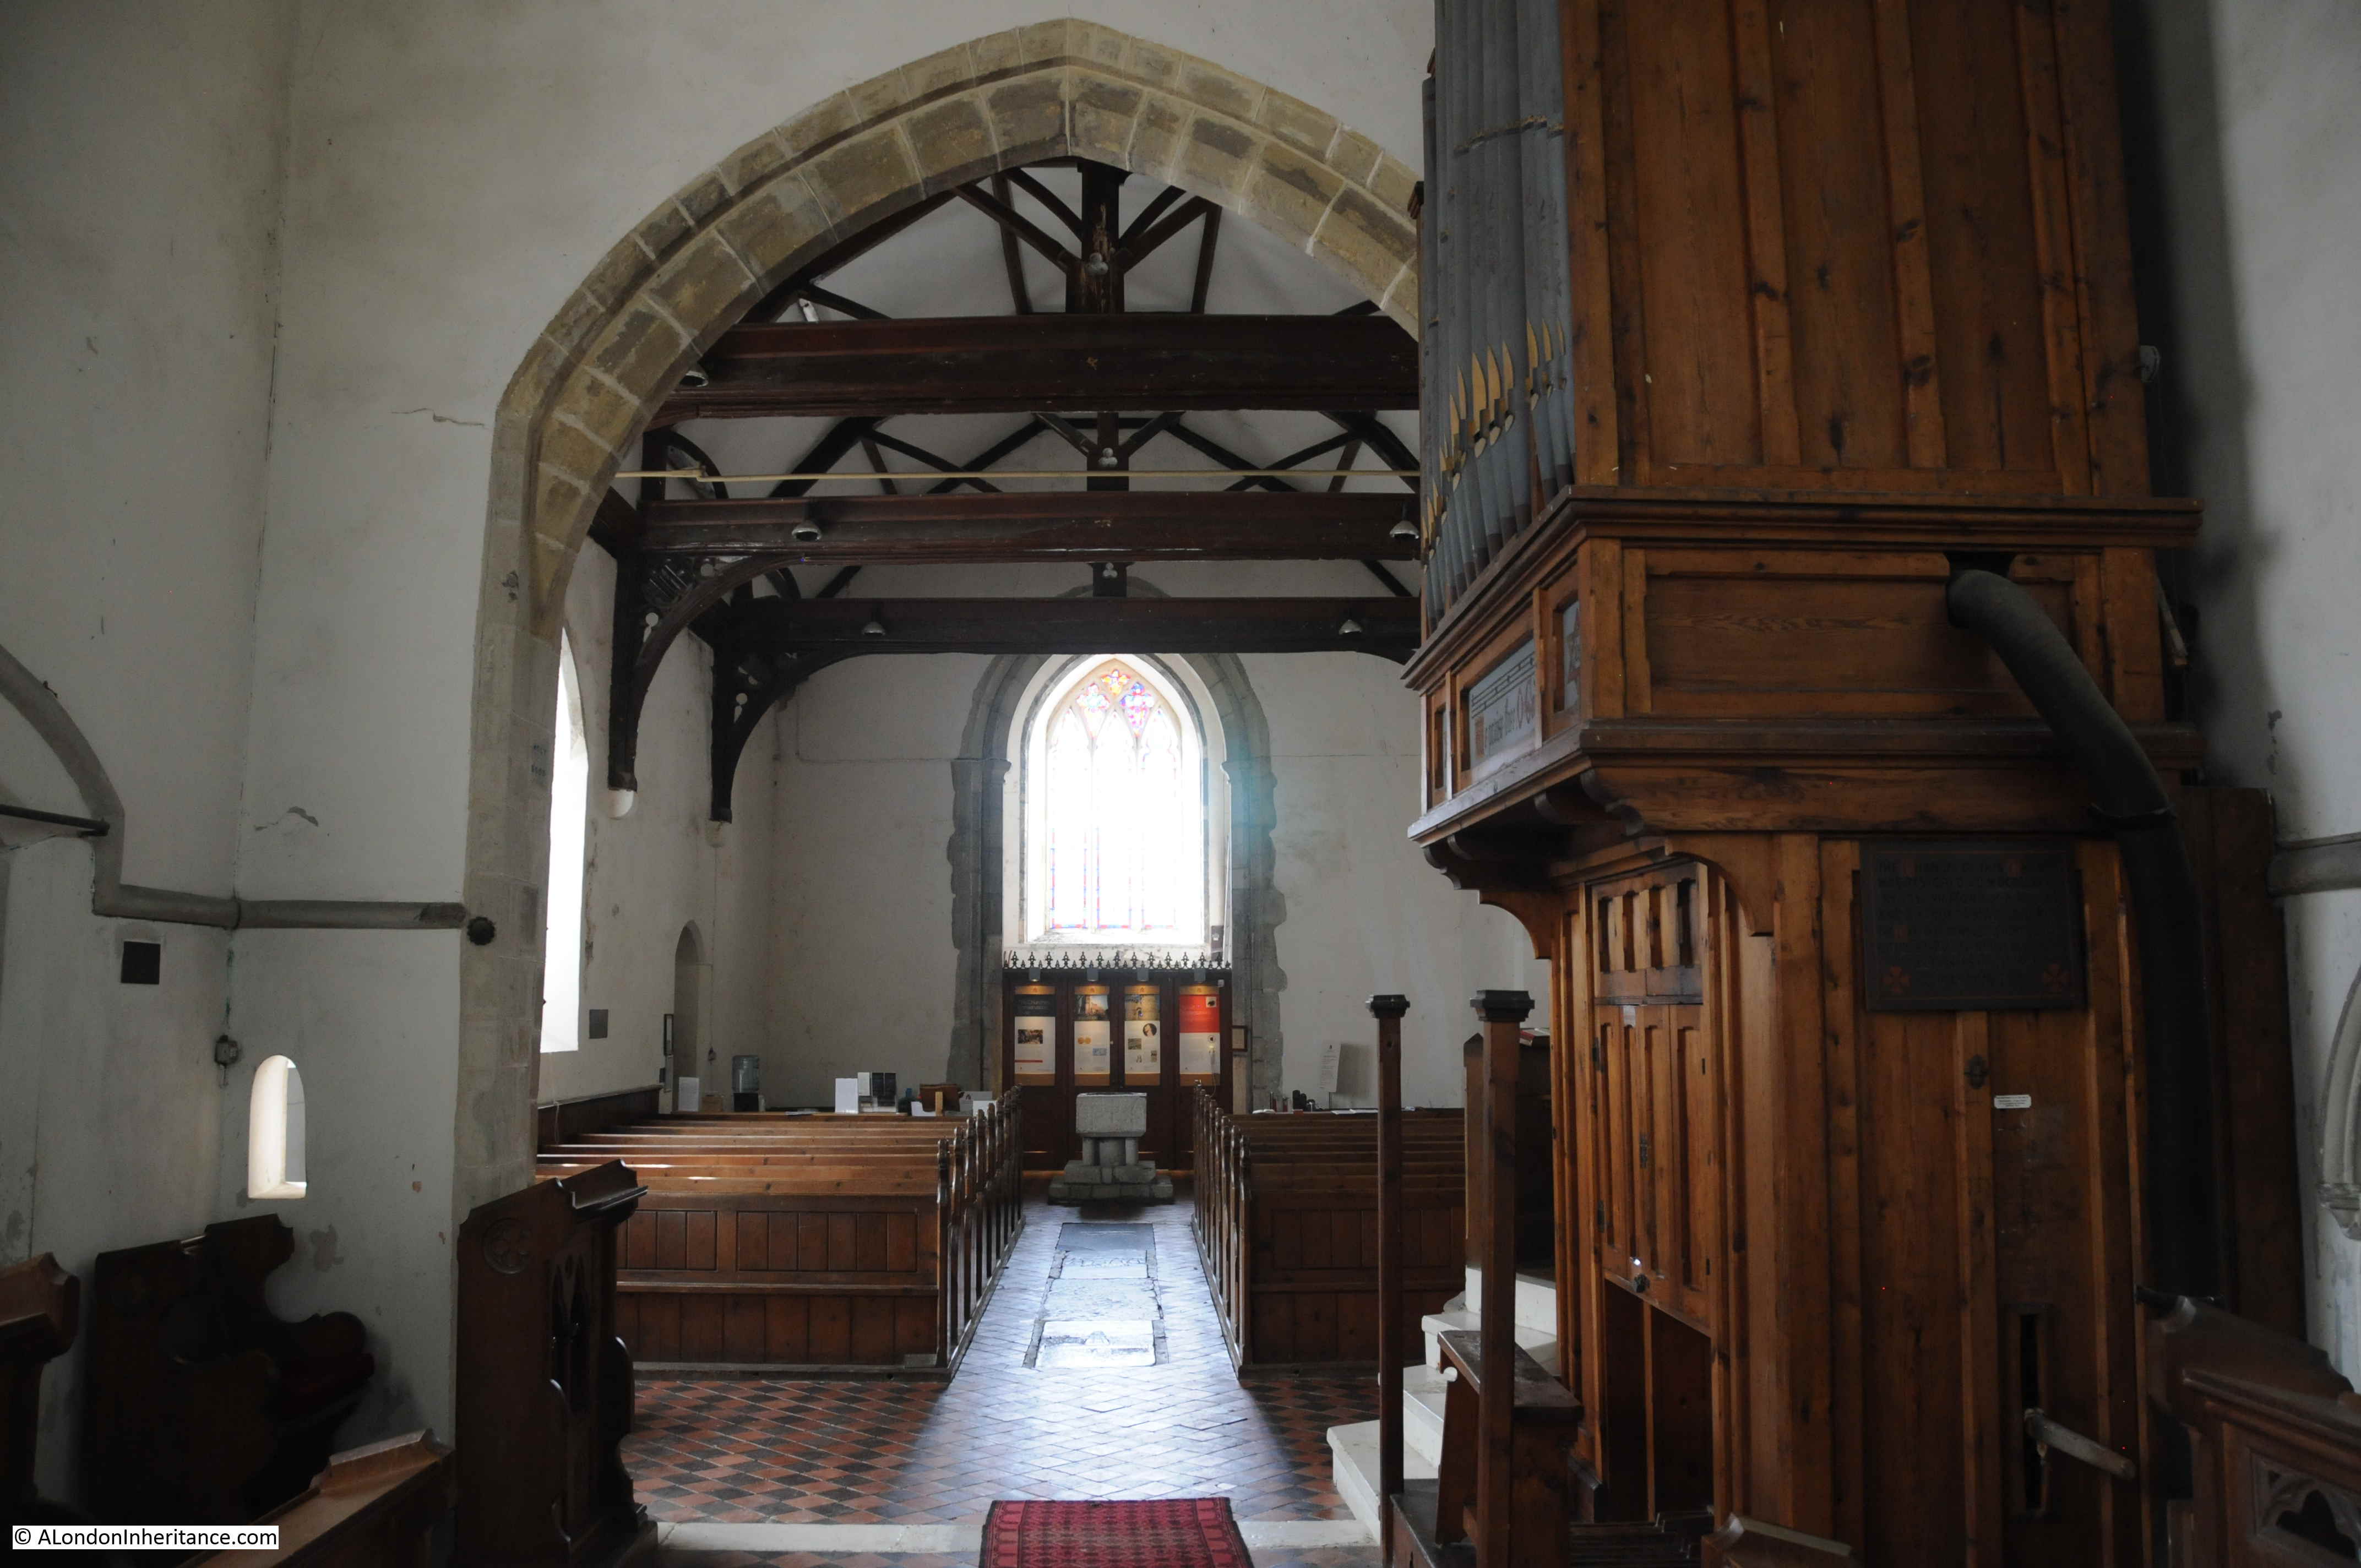
The wooden door on the right of the photo below is around 500 years old, and there are benches that possibly date from the 14th century.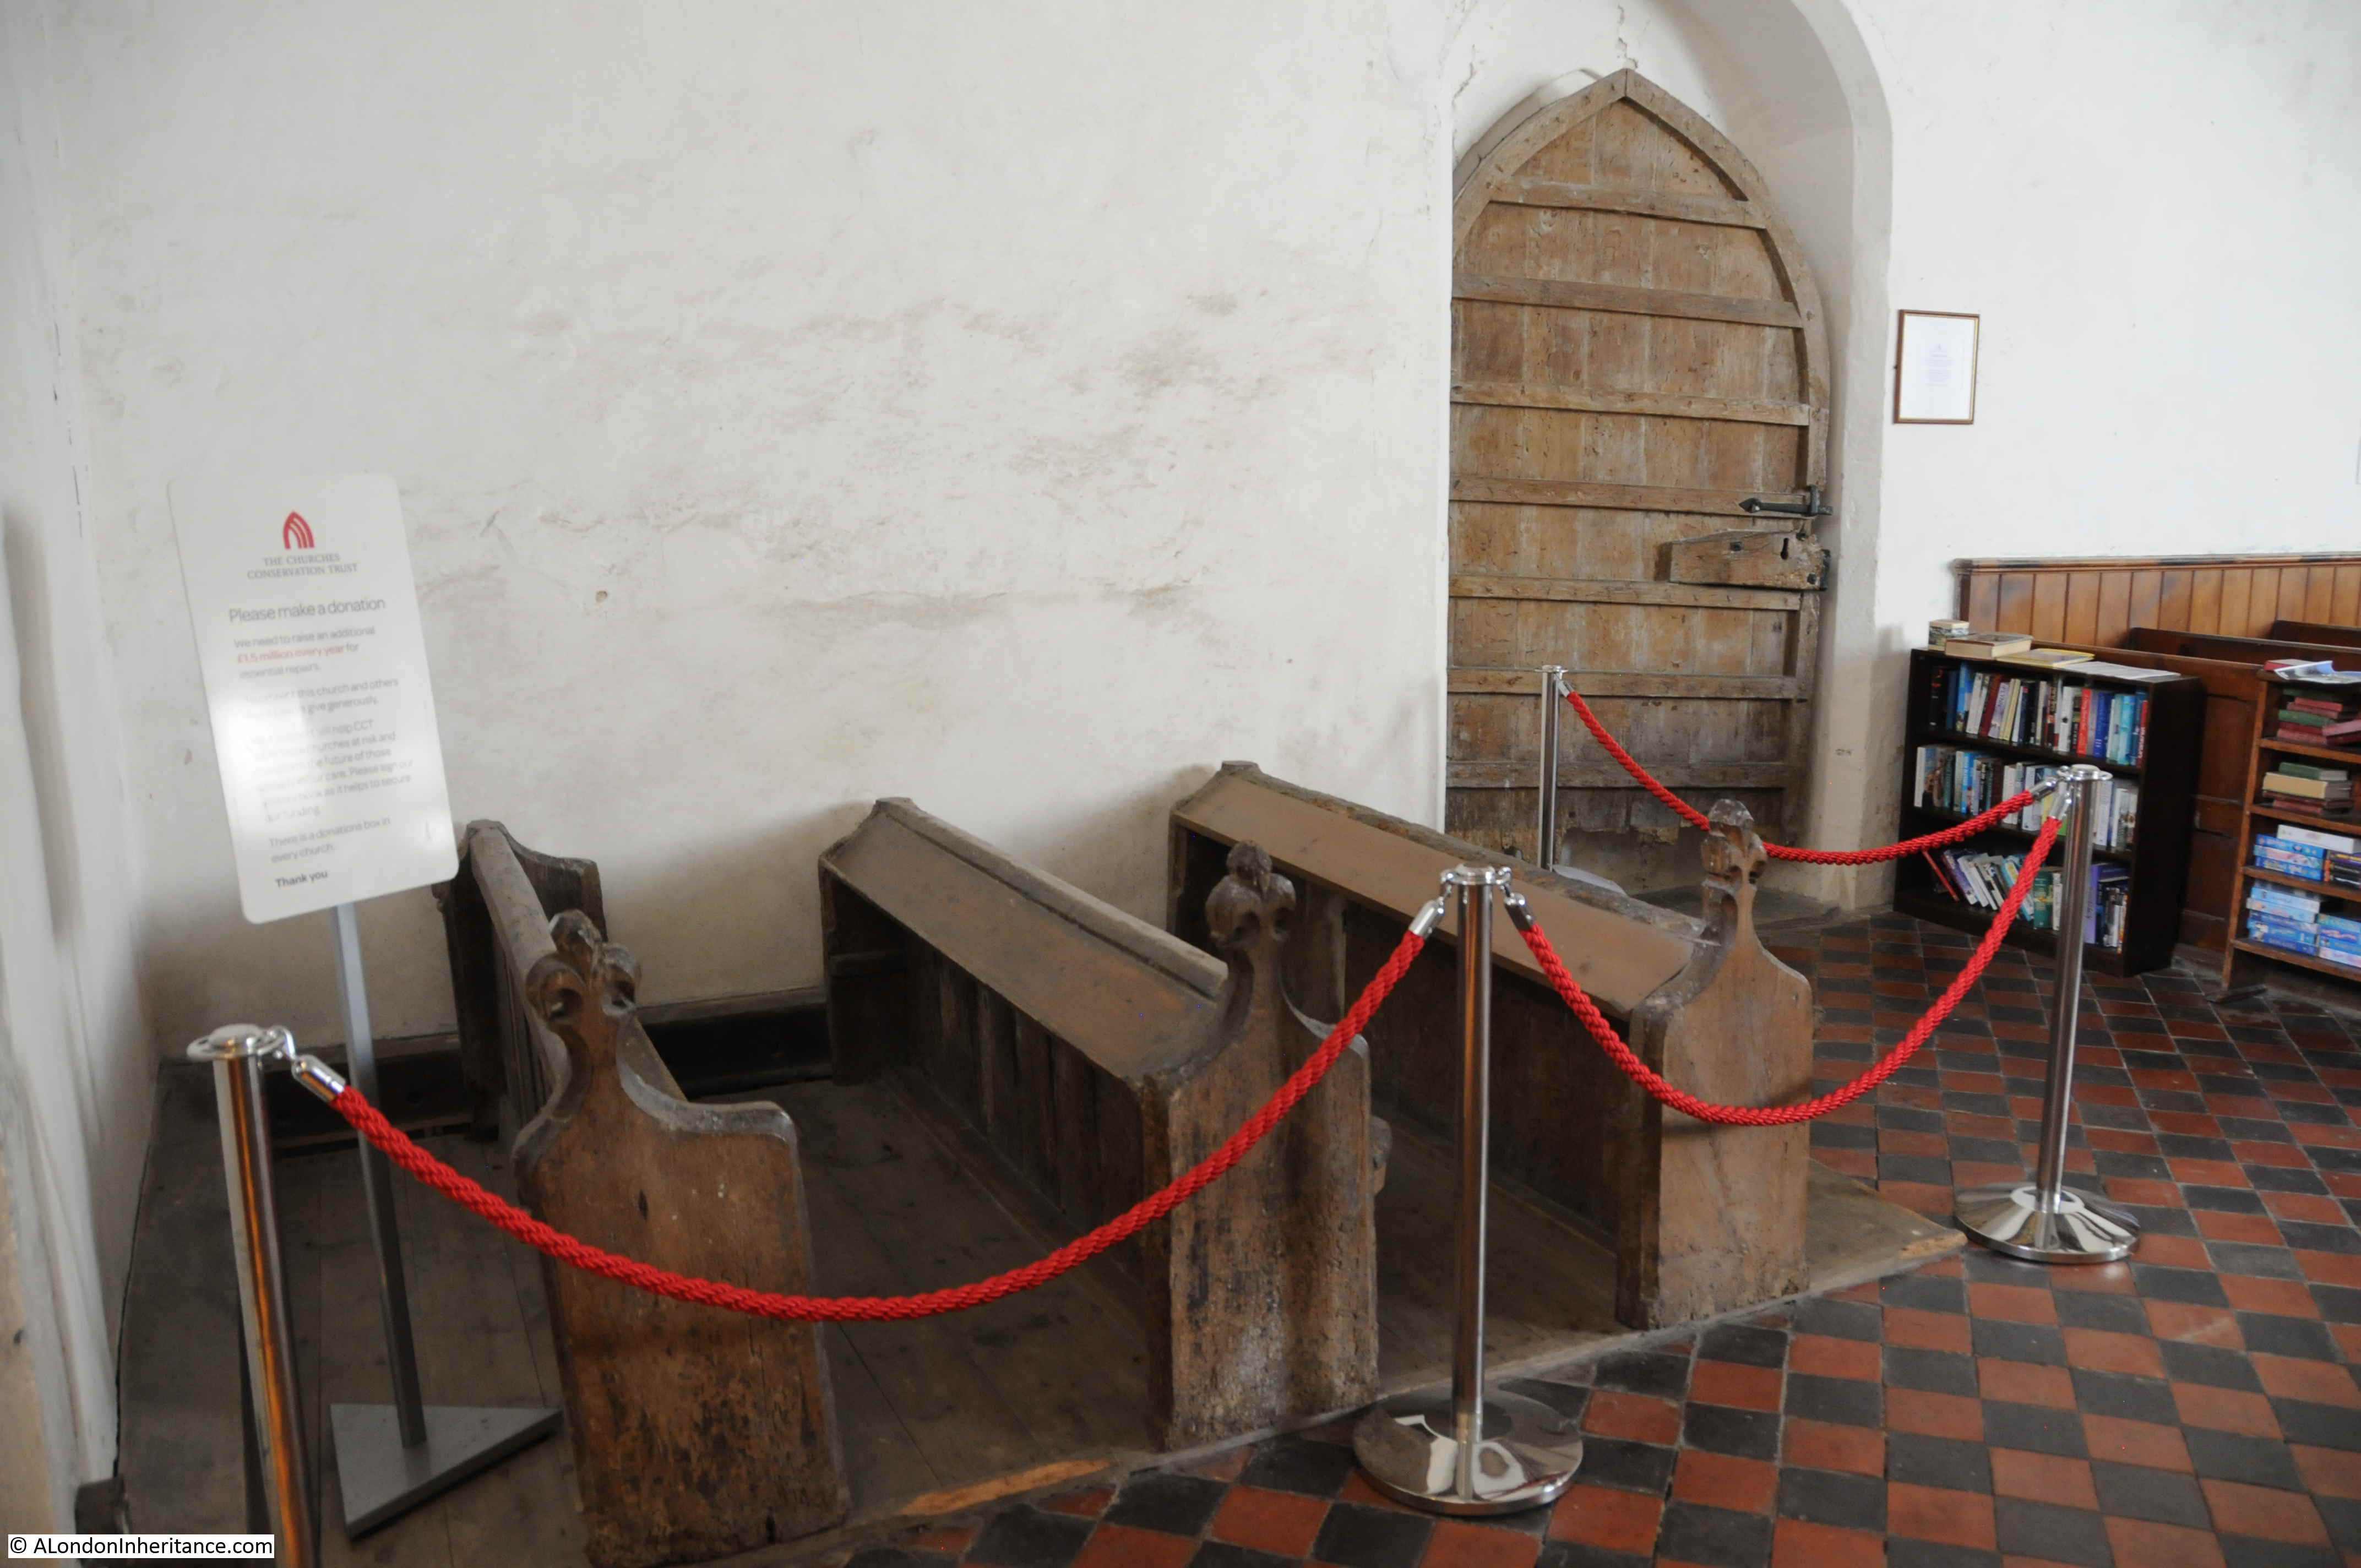
The Churches Conservation Trust now offers the opportunity to stay overnight at St James Church, Cooling on one of their “Champing” experiences. I would rather like to do that on a wet and windy night.
This has been a very quick tour of a number of fascinating sites, and I have not been able to do justice to them in a single post, but there is a theme to these sites.
It is how London’s influence extends far wider than just the City. The boundary markers at Lower Upnor tell of how the City of London tried to exert authority over a much wider area than just the River Thames.
Rochester is a town that probably owes its existence to being on the site where the road from the channel coast and Canterbury to London crossed the River Medway. A crossing that dates back almost 2,000 years to the time of the Roman occupation of Britain.
The exception is St James, Cooling, however the church connects in some ways to the River Thames as the church has seen the changes in river traffic over many hundreds of years.